Abstract
The importance of changing patterns of obesity in society and its implications for public health are well recognized. However, the adult life course of body mass index (BMI) changes in individuals over time is largely unknown and has mostly been extrapolated from cross-sectional studies. The present study examines individual specific variation of BMI during a 15-year follow-up period in a community-based sample of UK females. We attempted to establish whether there is a common, generalized pattern which captures variation in BMI over time. The participants of this study belong to a prospective population cohort of British women studied intensively since 1989: the Chingford Study. The sample originally consisted of 1,003 women aged 45–68 years, who were assessed annually for BMI during follow-up period. Polynomial regression models were used to assess longitudinal BMI variation. We observed a great stability in individual BMI variation during the follow-up period, reflected by high correlations between the baseline BMI and follow-up BMI 10 and 15 years later (r = 0.876, N = 810, and r = 0.824, N = 638, respectively). We also found that three different major age-related patterns in BMI could be clearly identified: no change in 30.6% in 58% it increased and in 11.4% it decreased with age. Thus, our data suggest that individual age-related changes in BMI are very different. Therefore, simply combining all individuals into groups by any other criteria (age, sex, etc.) and overlooking the distinctive patterns of BMI change may lead to biased inferences in epidemiologic and etiologic research of the future.
Electronic supplementary material
The online version of this article (doi:10.1007/s11357-011-9299-0) contains supplementary material, which is available to authorized users.
Keywords: BMI; Follow-up, curve fitting; Age-dependent patterns; Longitudinal; Weight gain
Introduction
Currently, it is clear that all body composition components, including adipose tissue and obesity, experience very substantial age- and generation-related changes. Obesity is one of the most widely spread problems with major public health implications in the developed countries all over the world (Obesity and overweight 2010). Some 60% of the adult population of North America and Australia is currently classified as overweight and obese (body mass index, (BMI) ≥ 25 kg/m2; Torrance et al. 2002; Cameron et al. 2003; Ogden et al. 2006). A similar situation occurs in UK and other European countries (Statistics on obesity 2010; International Obesity Task Force 2009; Diouf et al. 2010) and even in China and many developing countries (Wang et al. 2007; Grujic et al. 2010). Because of its high prevalence, and increased risk for cardiovascular disease and other types of morbidity, many risk factors for obesity have been explored (St Jeor et al. 2004; Nooyens et al. 2008). BMI is the commonest measure to assess cross-sectional obesity and because of its simplicity and correlation with many other measures of body mass. However, the majority of studies were undertaken using a cross-sectional approach and studies of longitudinal modeling of BMI over considerable lengths of time are rare. There are some studies considering BMI age-dependent changes in childhood (Aires et al. 2010), from childhood into adulthood (Kvaavik et al. 2003), and in a variety of clinical conditions (Gustafson et al. 2004). However, there is a paucity of longitudinal studies analyzing age-related patterns in BMI changes in an adult general population.
There are several longitudinal studies focused on tracking BMI in relation to individual age, sex, and other potential predictors (St Jeor et al. 2004; Kvaavik et al. 2003). Although these and other studies used quite sizable samples, they are, as a rule, considered mean trends observed in subgroups defined by sex, age, BMI, or other characteristics of interest, but they were not compared with individual patterns. The present study examined a large community-based sample of middle-aged British women who have been studied intensively for osteoarthritis, osteoporosis, and other traits since 1989 (e.g., Hassett et al. 2003; Zhai et al. 2008; Livshits et al. 2009). The participants of the study were assessed almost annually for BMI over 15 years while measuring many other co-factors, and thus providing us with rare opportunity to examine individual age-related patterns in BMI variation.
It has been long time accepted in gerontology that aging and age-related changes are highly individual phenomenon. It is also commonly accepted that longitudinal study is the only direct method to determine how many individuals in the population maintain stable functional abilities over time, how many improve, and how many deteriorate. The major aim of the present study was, consequently, to examine the individual variability of age-dependent changes in BMI and to establish whether there is/are common, generalized pattern(s) similar, for example, to the charts reflecting childhood growth.
Material and methods
Sample
The participants of this study were taken from the well-established prospective population cohort of middle-aged British women studied intensively since 1989 within the framework of the Chingford Study. The sample originally consisted of 1,003 women aged 45–68 years, selected through General Practitioner records. The cohort has been followed annually, and many clinical, anthropometric, psychosocial, radiological, and metabolic variables have been recorded at least at two time points. However, body weight and height were recorded more frequently, so that up to ten sets of measurements are available for the longitudinal analysis. For each individual, the registered number of visits corresponded to the number of the set. The date of each individual visit was also registered. This enabled us to determine the individual age at each measurement with the precision of 1 day. The number of individuals measured at each visit, varied from 1,003 (visit 1) to 638 (visit 15). For each weight (in kg) and height (in cm) measurement, BMI (kg/m2) was calculated, so that available data included 8,075 BMI values. To control for the variation caused by the number of measurements, we selected 752 individuals who had at least eight measurements in the course of the study. To examine whether there are differences between the individuals included and not included in a follow-up study, their BMI at entrance examination was compared according to 5-year age cohort. The individuals not included in a follow-up study tended to have higher BMI, which reached statistically significant level (p = 0.004) in the oldest available age group, >60: 25.4 (SD = 3.65) vs 27.01 (SD = 4.37), Supplementary Table 1. They were also older in average [54.28 (SD = 5.90) vs 55.89 (SD = 6.22), p = 0.003], which partly explained the difference. It should be mentioned that surplus of the overweight individual in the oldest group may introduce some bias in population-based inferences of this study.
The data analysis
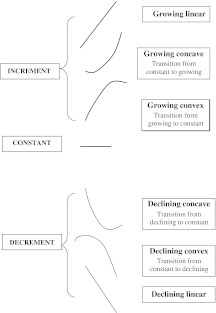
Polynomial regression modeling was used to assess age dependence of BMI. Several models with increasing degree of age derivatives (from constant to quadratic) were tested, and the maximum likelihood estimates (MLE) for model parameters were calculated for each person separately. Using likelihood ratio test (LRT), we compared the more complex models with the hierarchically simpler model (e.g., quadratic polynomial vs linear or linear vs. constant model) to choose the most parsimonious (MP) and best fitting curve for each individual. Preliminary review of the total sample showed that BMI change fell into three main categories: (a) age-dependent increment (INC), (b) age-dependent decrement (DEC), and (c) no significant changes in relation to age (CNST). However, as illustrated in Fig. 1, each of the INC and DEC groups can be in turn divided into three sub-categories: pure linear, and two quadratic types, convex (having maximum) and concave (having minimum) fitting curves. In total, it gives seven types of BMI change pattern. Quadratic model describe sloping regression line: for example, growing convex model means that there was a change of growing-up pattern of curve to constant (or to decline), whereas growing concave means that there was transition from constant curve pattern to growth or decline.
Fig. 1.
The different main patterns of BMI age dependence during the follow-up period in Chingford Study sample
For the entire follow-up period, each person was characterized by initial age (AGEINI) and average BMI (BMIAV). We investigated the correlations between mean age and BMI and found parameter estimates of the best fitting curve. Since individual BMI variance clearly increased with the mean BMI (heteroscedasticity), we introduced the ratio of the specific individual measurement (BMIij) to BMIAV as a measure of relative magnitude of change (BMIREL). We examined also the patterns and parameters of age dependence of BMIREL.
To test whether the BMI curve patterns depend on BMI itself, we examined the distribution curve patterns by WHO definition of weight (Haslam and James 2005): (1) normal, with BMIAV < 25 kg/m2; (2) overweight, BMIAV = 25–30 kg/m2; (3) obese, BMIAV > 30 kg/m2; and by four age groups (AGEINI ≤ 50 years; 51–55 years; 56–60 years; AGEINI > 60 years). Finally, we compared BMI fitting curves generated using the cross-sectional data with the above longitudinal fitting curves. The cross-sectional curves were first obtained from the data for each of the first five visits separately. The heterogeneity of the cross-sectional curves by visit was tested by LRT. Since the observed differences were not significant, the data were combined together. Data analysis was performed using the program MAN-2009.
Results
Cross-sectional data
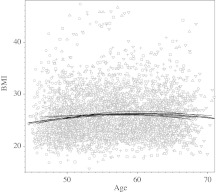
Table 1 provides the basic descriptive statistics by visit number and gives sample size available at each time point. Overall, mean BMI increased significantly from 25.61 to 27.22 during the follow-up (paired t test = 6.88, p < 0.0001), with average age in the sample, 54.7 at first visit and 69.1 at visit 15. There is a highly significant correlation (0.909, p < 0.001) between the mean age and mean BMI. However, the situation changes when the individual BMI data for each of the five first visits were contrasted with age in a cross-sectional manner (Fig. 2). The relation between age and BMI was curvilinear in all five groups; a quadratic equation described the relation better then a linear equation did (χ2 = 14.2, df = 1, p = 0.0002). The test for heterogeneity of curve patterns among the five visits showed no significant differences by LRT (χ2 = 14.8, df = 12, p = 0.25). Mean age explained only a minor portion of the visit-specific BMI variation, with multiple determination coefficient from maximal R2 = 0.011 (p = 0.006) for visit 1 to minimal R2 = 0.001 (p = 0.73) for visit 3. This was in agreement with virtually zero correlation (r = 0.01, p = 0.77) observed between the mean values of age and BMI.
Table 1.
Basic descriptive statistics of the Chingford Study sample
| Visit number | ||||||||||
|---|---|---|---|---|---|---|---|---|---|---|
| 1 | 2 | 3 | 4 | 5 | 6 | 8 | 9 | 10 | 15 | |
| Sample size | 1,003 | 813 | 663 | 854 | 821 | 834 | 841 | 808 | 810 | 638 |
| Age mean | 54.7 | 56.2 | 57.5 | 57.4 | 58.4 | 59.2 | 61.2 | 62.1 | 64.1 | 69.1 |
| Age median | 54.2 | 55.9 | 57.6 | 57.0 | 58.0 | 58.8 | 60.8 | 61.7 | 63.8 | 68.5 |
| Age IRQ | 10.9 | 10.3 | 10.4 | 10.8 | 10.9 | 10.7 | 10.6 | 10.5 | 10.7 | 10.0 |
| Age minimum | 44.6 | 45.6 | 46.4 | 47.4 | 48.4 | 49.4 | 51.4 | 52.3 | 53.5 | 59.8 |
| Age maximum | 67.9 | 69.1 | 70.0 | 70.7 | 70.9 | 71.7 | 73.6 | 74.9 | 77.6 | 81.9 |
| BMI mean | 25.61 | 25.75 | 25.96 | 26.12 | 26.32 | 26.65 | 26.73 | 27.05 | 26.78 | 27.22 |
| BMI median | 24.86 | 25.00 | 25.15 | 25.46 | 25.71 | 25.97 | 26.11 | 26.40 | 26.26 | 26.59 |
| BMI IRQ | 4.97 | 5.12 | 5.29 | 5.28 | 5.56 | 5.54 | 5.60 | 5.80 | 5.86 | 6.30 |
| Number of visits attended by participant | ||||||||||
| 1 | 2 | 3 | 4 | 5 | 6 | 7 | 8 | 9 | 10 | |
| Count of individuals | 42 | 27 | 29 | 29 | 19 | 38 | 68 | 119 | 305 | 328 |
Fig. 2.
Cross-sectional BMI–age relationship for five first visits in the Chingford Study sample. The data for different visits shown by different signs. The most parsimonious and best fitting quadratic function curves for each visit and in total (bold) shown separately
Longitudinal data
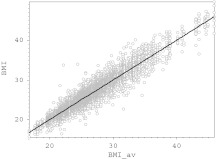
Figure 3 shows bi-plot of individual BMI measurements vs the corresponding mean BMI and, with just a few exceptions, suggests remarkable stability of BMI during the follow-up period. Some 91% of the total sample BMI variation was attributable to BMIAV, suggesting that only minor individual fluctuations occurred during these years. Indeed the correlations between the BMI at the entrance examination and 10 and 15 years later were high and statistically significant (r = 0.876, N = 810, and r = 0.824, N = 638 respectively, p < 0.001 in both instances).
Fig. 3.
Correlation of the individual BMI measurements with average individual BMIAV for the entire follow-up period in the total Chingford Study sample. The variance decomposition analysis suggests that 9% and 91% of the total BMI variance are attributable to intra- and inter-individual variation, respectively. Correlation (r = 0.49, p = 0.0002) was found between the standard deviation of the repeated individual BMI measurements and individual average BMI
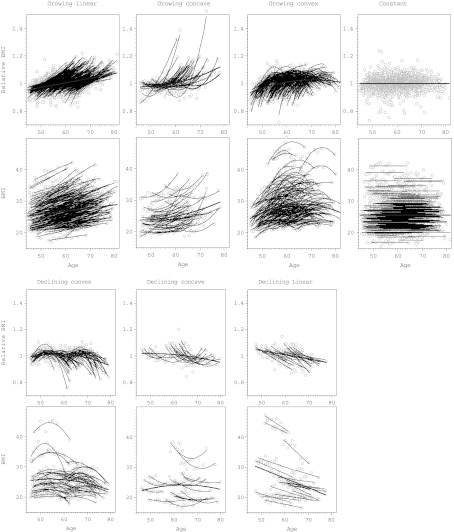
Figure 4 provides individual MP BMI curves found using MLE approach. The curves were divided into the seven main categories according to age-dependent pattern of change (Fig. 1). Comparison of the first and last available BMI measurement showed that 57.9% had increasing BMI and in 11.4% BMI declined. The upper part of Fig. 4 shows BMIREL curves, the lower part shows unadjusted BMI curves. For the same individual, both BMIREL and BMI curve had the similar pattern. Each graph also shows the mean curve for the given pattern. The observed age dependencies included 30.6% of the individuals whose MP curves were best approximated by constant (no age-dependent changes) model (Fig. 4d). The rest showed significant age-dependent trends: 34.0% exhibited linear dependence (Fig. 4a, g) and 35.3% was approximated best by the quadratic model, including 7.8% of concave curves (Fig. 4b, f) and 27.5% of convex curves (Fig. 4c, e).
Fig. 4.
Longitudinal changes in BMI in relation to age in Chingford Study sample. The results presented for seven types of relation as defined in Fig. 1. For each type the upper graph shows relative BMI = BMI/BMIAV vs age, and the lower graph shows BMI in kg/m2
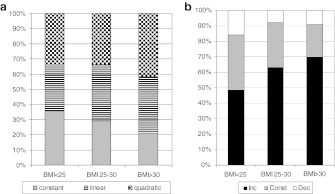
We next examined whether the pattern of BMI curve depends on BMI and age of an individual. Figure 5a shows proportions of three major curve patterns, constant (no change), linear, and quadratic in three mean BMI subdivisions. The figure suggests certain dependence between the distribution of the BMI curve types and mean BMI group and significant inter-group heterogeneity (χ2 = 11.08, df = 4, p = 0.025). The differences were caused by gradual changes in frequency of each of the three main curve types. With BMI increase, the proportion of the constant curves diminished from 36% to 21% with parallel increase in the proportion of linear and quadratic curves. Of interest is also the observation that the percentage of curves reflecting the increasing BMI (INC) enlarged especially substantially in this direction (from 49% to 70%), while the proportion of declining BMI curves (DEC) diminished (Fig. 5b). The heterogeneity test, comparing the frequency distribution of these three types of curves (INC, CNST, and DEC, according to Fig. 1), was highly significant (χ2 = 25.95, df = 4, p = 0.00003) and confirmed the above trend.
Fig. 5.
a Proportion of different types of most parsimonious polynomial models (quadratic, linear, or constant) in three BMIAV groups: normal, overweight, and obese. b Proportion of different types of the individual BMI growth patterns divided in three categories, growing, constant, and declining, in three BMIAV groups, normal, overweight, and obese
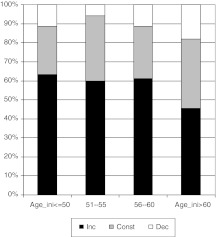
Comparing the BMI curves by age cohort revealed a significant dependence between the two variables (χ2 = 24.11, df = 6, p = 0.0005). As seen in Fig. 6, the dependence was in particular strong with the proportion of INC curves. It is gradually decreased from 63% among younger participants, AGEINI ≤ 50 during the follow-up period, to 46% among those who were AGEINI ≥ 60. The percentage of BMI curves, having CNST and DEC patterns tended to increase with the age of the participants. However, the trend is not as clear as with the INC curves. The consideration of each of the seven types of curves in relation to mean BMI and mean AGE is provided in the Supplementary material.
Fig. 6.
Proportion of different types of the individual BMI growth patterns divided in three categories, growing, constant, and declining, in four AGEINI groups representing quartiles of the age distribution in the total sample
Using the contingency tables we examined the multivariate distribution of BMI curve patterns in relation to three BMIAV categories and in two age groups (GR1 < 55 vs GR2 ≥ 55, Table 2). Chi-square test showed significant difference (p < 0.001) in the distribution of the proportions. The most prominent differences were observed in the frequency of CNST curves between younger and older individuals with BMI > 30, 16.5% vs 30.6%, and in the frequency of DEC between younger and older individuals with BMI < 25, 11.4% vs 21.9%. Of interest also, INC curves portion consistently increased with BMI, and decreased with age.
Table 2.
Frequency distribution of BMI age-related curve patterns by individual initial age and average BMI during the follow-up period
| AGE GR | BMIAV GR | N | CNST | INC | DEC |
|---|---|---|---|---|---|
| AGEINI < 55 | BMI < 25 | 185 | 71 (0.384) | 93 (0.503) | 21 (0.114) |
| BMI 25–30 | 160 | 41 (0.256) | 111 (0.694) | 8 (0.050) | |
| BMI > 30 | 79 | 13 (0.165) | 58 (0.734) | 8 (0.101) | |
| AGEINI ≥ 55 | BMI < 25 | 137 | 44 (0.321) | 63 (0.460) | 30 (0.219) |
| BMI 25–30 | 138 | 46 (0.333) | 77 (0.558) | 15 (0.109) | |
| BMI > 30 | 53 | 15 (0.283) | 34 (0.642) | 4 (0.075) | |
| Total | 752 | 230(0.306) | 436 (0.580) | 86 (0.114) |
The numbers in parenthesis show pattern frequency in the given age/BMI category
Discussion
It is well established that obesity represents one of the major risk factors for cardiovascular disease and a huge variety of comorbidities (e.g., Lavie and Milani 2003), although the association may not be simple (Lavie et al. 2009). However, there is almost complete lack of longitudinal data concerning individual patterns of age-related variation in obesity. Since BMI represents a commonly accepted and widely used measure of obesity, the major aim of this study was to establish the general patterns of age-related change in the middle-aged population. Our study is novel in that it examines individual specific variation of BMI during the 15-year follow-up period in quite sizable community-based sample, 1,003 UK females, randomly collected from the general population. Only individuals with at least eight BMI measures were included. The study revealed the following main findings:
When mean BMI for different visits was compared, they showed strong correlation with mean sample age (Table 1), as expected from previous studies (St Jeor et al. 2004; Sorkin et al. 1999).
There is a great stability in individual BMI variation over time (Fig. 3), which was reflected in high correlations between the baseline BMI and BMI 10–15 years later (r = 0.876, N = 810, and r = 0.824, N = 638, respectively). This finding is in accord with previous studies tracking BMI, defined as a proportion of individuals maintaining their relative position in the trait distribution during the follow-up period (Mahoney et al. 1991). Thus, for example, Wilsgaard et al. (2001), who had 16 years follow-up in a large Norwegian sample of women and men aged 20–61 years, found a high degree of BMI tracking (standardized regression coefficients = 0.85 for men and 0.80 for women). We find it interesting that when this study computed a simple correlation between the first and last surveys, their estimate, 0.80, in women was very similar to ours. Very similar tracking coefficients were obtained in even larger study conducted in an Austrian sample (Ulmer et al. 2003). The remarkable finding of this study is that the tracking coefficients (standardized betas) were between 0.85 and 0.89, regardless of sex and age cohort of the enrolled participants. Note finally, even tracking of BMI from young age, showed very substantial degree of correlation (r = 0.54) both in women and men (Kvaavik et al. 2003), contrary to the growth of very young children (Chivers et al. 2009). These findings are also in good agreement with familial studies of BMI heritability, which showed consistently substantial and significant estimates of the putative genetic effects on BMI variation in adults (Livshits et al. 1998; Manek et al. 2003).
Despite such an age-related stability, BMI of only 30.6% of the sample showed no age-related changes at all (Fig. 4d). The BMI of the rest varied with age and showed different patterns of association (Fig. 4): BMI in some individuals (∼58%) increased, but in others decreased with the age. The corresponding curves were simply linear (Fig. 4a, g) or could be approximated by quadratic function (Fig. 4b, c, e, f). The individual parameter estimates within the curve category, although significantly heterogeneous, still allowed their inclusion into the particular class. This was not the case when curves belonging to different classes were compared. They were not compatible by LRT. This is an important observation that suggests that consideration of the average BMI “growth” pattern in adulthood and elderly may not be appropriate. As in the other studies (Nooyens et al. 2008; Sorkin et al. 1999), when we consider average BMI in the sample for the given age, it shows significant increase with the age (Table 1). Moreover, similar to other studies (Nooyens et al. 2008; Ogden et al. 2004; Flegal et al. 2010), when we examine our data as cross-sectional collection (Fig. 3), they demonstrate well-known patterns of BMI increase with age until age 60–65 years and decline thereafter. We observed this for separately taken five first visits and for all combined. The average curves were approximated by the same quadratic equation and showed no significant heterogeneity when compared. However, as seen in Fig. 4, this could also be a misleading conclusion in light of profound differences in the individual longitudinal patterns of BMI variation.
We saw significant differences in the frequency distribution of different patterns of BMI curves in relation to BMI and age at entrance examination or in average (Figs. 5 and 6). The notable difference was observed between the individuals with low BMIAV, who demonstrated the lowest trend to change, in comparison to obese individuals with higher proportion of the BMI variation during the follow-up. Almost 36% of the individuals with BMIAV < 25 showed no significant age-related changes, as compared to only 21%, among those with BMIAV > 30 (Fig. 5a). Moreover, they had the highest percentage, 70% of the INC curves vs 47% in lean group (Fig. 5b). Another interesting observation is that BMI of younger people more often increase (63% in AGEINI group ≤50) in comparison to older individuals (46%, in AGEINI group >60), who also more often diminish their BMI then younger women (Fig. 6). The later trend was also observed recently by Nooyens et al. (2008) during 6 to 11 years follow-up study in the Netherlands. They observed highest increase in BMI over 11 years in the youngest group, aged 20–29 years at baseline (2.2 kg/m2), and lowest increase in the oldest group, aged 50–59 years at baseline (1.1 kg/m2). However, this longitudinal study also did not consider the individual growth curves and presented specific patterns in average for differently defined cohorts. It means that there is a probability that the individuals with opposite growth patterns (INC vs DEC) were combined in the same cohort. In this case, the observed average trend would be biased to the extent of intermixture of different BMI curve patterns. Our study suggests a very substantial and highly significant individual heterogeneity in BMI patterns, regardless of the BMI and or age cohort at baseline or in average. Thus the combination of individuals in groups, even of similar age or BMI, may be misleading as the opposite growth patterns could be combined.
There are several limitations in this study. The major ones include variety of ages at entrance examination and therefore a variety of age segments were examined in the same analysis. This is, however, an unavoidable and common situation in all community-based projects. Another limitation is the dropout of participants during the follow-up, which is also inevitable and inherent to longitudinal studies. The most important drawback of our study is probably the fact that participants were only females, and we cannot make reliable inference for males. Finally, it should be mentioned that although this is apparently a healthy cohort, diabetes, hypertension, and other potential morbidity were not taken into account. Moreover, we did not test the effect of the potential confounding factors, such as smoking, lifestyle, etc., on the rate and pattern of BMI changes, nor did we enquire about efforts to reduce calorific intake or increase amount of exercise to facilitate weight loss.
Nevertheless, the results of this study are very clear and of importance. They show that at the population level, average BMI increases with age, as it is reported in many other studies. However, the individuals fell into a number of different patterns; from age-dependent increase to no change during 15 years, or even a relative decrease to baseline examination. The data suggest that simply combining the individuals in group and corresponding common adjustment for age affect may lead to biased inferences and implies that individual patterns should be taken into account when possible.
This in particular may be important when assessment regarding the age-related changes of BMI as a risk factor for vascular (and) other morbidity is considered. It is of importance when influence of covariates, especially genetic polymorphisms, on a pattern of BMI variation is examined. To our knowledge, no study has classified subjects into the groups on the basis of their individual patterns. Consequently, additional studies are needed to fully explore age-related patterns of growth of BMI and other obesity-related phenotypes in adulthood.
Electronic supplementary material
(DOC 56 kb)
Acknowledgments
The authors would like to thank all the Chingford members who participated in the study and to acknowledge the financial support from the Wellcome Trust and Arthritis Research UK for funding the Chingford Study. The study was also partially supported by Israel Science Foundation (Grant #994/10).
References
- Aires L, Mendonça D, Silva G, Gaya AR, Santos MP, Ribeiro JC, et al. A 3-year longitudinal analysis of changes in body mass index. Int J Sports Med. 2010;31:133–137. doi: 10.1055/s-0029-1243255. [DOI] [PubMed] [Google Scholar]
- Cameron AJ, Welborn TA, Zimmet PZ, Dunstan DW, Owen N, Salmon J, et al. Overweight and obesity in Australia: the 1999–2000 Australian Diabetes, Obesity and Lifestyle Study (AusDiab) Med J Aust. 2003;178:427–432. doi: 10.5694/j.1326-5377.2004.tb05998.x. [DOI] [PubMed] [Google Scholar]
- Chivers P, Hands B, Parker H. Longitudinal modeling of body mass index from birth to 14 years. Obes Facts. 2009;2:302–310. doi: 10.1159/000235561. [DOI] [PMC free article] [PubMed] [Google Scholar]
- Diouf I, Charles MA, Ducimetière P, Basdevant A, Eschwege E, Heude B. Evolution of obesity prevalence in France: an age–period–cohort analysis. Epidemiology. 2010;21:360–365. doi: 10.1097/EDE.0b013e3181d5bff5. [DOI] [PMC free article] [PubMed] [Google Scholar]
- Flegal KM, CarrollMD OCL, Curtin LR. Prevalence and trends in obesity among US adults, 1999–2008. JAMA. 2010;303:235–241. doi: 10.1001/jama.2009.2014. [DOI] [PubMed] [Google Scholar]
- Grujic V, Dragnic N, Radic I, Harhaji S, Susnjevi S. Overweight and obesity among adults in Serbia: results from the National Health Survey. Eating Weight Disord. 2010;15:e34–e42. doi: 10.1007/BF03325278. [DOI] [PubMed] [Google Scholar]
- Gustafson D, Lissner L, Bengtsson C, Björkelund C, Skoog I. A 24-year follow-up of body mass index and cerebral atrophy. Neurology. 2004;63:1876–1881. doi: 10.1212/01.WNL.0000141850.47773.5F. [DOI] [PubMed] [Google Scholar]
- Haslam DW, James WP. Obesity. Lancet. 2005;366:1197–1209. doi: 10.1016/S0140-6736(05)67483-1. [DOI] [PubMed] [Google Scholar]
- Hassett G, Hart DJ, Manek NJ, Doyle DV, Spector TD. Risk factors for progression of lumbar spine disc degeneration: the Chingford Study. Arthritis Rheum. 2003;48:3112–3117. doi: 10.1002/art.11321. [DOI] [PubMed] [Google Scholar]
- International Obesity Task Force (2009) EU platform on diet, physical activity and health. EU Platform Briefing Paper. http://ec.europa.eu/health/ph_determinants/life_style/nutrition/documents/iotf_en.pdf. Accessed August 2009
- Kvaavik E, Tell GS, Klepp KI. Predictors and tracking of body mass index from adolescence into adulthood: follow-up of 18 to 20 years in the Oslo Youth Study. Arch Pediatr Adolesc Med. 2003;157:1212–1218. doi: 10.1001/archpedi.157.12.1212. [DOI] [PubMed] [Google Scholar]
- Lavie CJ, Milani RV. Obesity and cardiovascular disease: the Hippocrates paradox? J Am Coll Cardiol. 2003;42:677–679. doi: 10.1016/S0735-1097(03)00784-8. [DOI] [PubMed] [Google Scholar]
- Lavie C, Milani RV, Ventura HO. Obesity and cardiovascular disease risk factor, paradox, and impact of weight loss. J Am Coll Cardiol. 2009;53:1925–1932. doi: 10.1016/j.jacc.2008.12.068. [DOI] [PubMed] [Google Scholar]
- Livshits G, Yakovenko K, Ginsburg E, Kobyliansky E. Genetics of human body size and shape: pleiotropic and independent genetic determinants of adiposity. Ann Hum Biol. 1998;25:221–36. doi: 10.1080/03014469800005592. [DOI] [PubMed] [Google Scholar]
- Livshits G, Zhai G, Hart DJ, Kato BS, Wang H, Williams FM, et al. Interleukin-6 is a significant predictor of radiographic knee osteoarthritis: the Chingford Study. Arthritis Rheum. 2009;60:2037–2045. doi: 10.1002/art.24598. [DOI] [PMC free article] [PubMed] [Google Scholar]
- Mahoney LT, Lauer RM, Lee J, Clarke WR. Factors affecting tracking of coronary heart disease risk factors in children. The Muscatine Study. Ann NY Acad Sci. 1991;623:120–132. doi: 10.1111/j.1749-6632.1991.tb43723.x. [DOI] [PubMed] [Google Scholar]
- Manek NJ, Hart D, Spector TD, MacGregor AJ. The association of body mass index and osteoarthritis of the knee joint: an examination of genetic and environmental influences. Arthritis Rheum. 2003;48:1024–1029. doi: 10.1002/art.10884. [DOI] [PubMed] [Google Scholar]
- Nooyens AC, Visscher TL, Verschuren WM, Schuit AJ, Boshuizen HC, Mechelen W, et al. Age, period and cohort effects on body weight and body mass index in adults: The Doetinchem Cohort Study. Public Health Nutr. 2008;12:862–870. doi: 10.1017/S1368980008003091. [DOI] [PubMed] [Google Scholar]
- Obesity and overweight (2010). http://www.who.int/dietphysicalactivity/publications/facts/obesity/en/
- Ogden CL, Fryar CD, Carroll MD, Flegal KM. Mean body weight, height, and body mass index, United States 1960–2002. Adv Data. 2004;27:1–17. [PubMed] [Google Scholar]
- Ogden CL, Carroll MD, Curtin LR, McDowell MA, Tabak CJ, Flegal KM. Prevalence of overweight and obesity in the United States, 1999–2004. JAMA. 2006;295:1549–1555. doi: 10.1001/jama.295.13.1549. [DOI] [PubMed] [Google Scholar]
- Sorkin JD, Muller DC, Andres R. Longitudinal change in height of men and women: implications for interpretation of the body mass index: the Baltimore Longitudinal Study of Aging. Am J Epidemiol. 1999;150:969–977. doi: 10.1093/oxfordjournals.aje.a010106. [DOI] [PubMed] [Google Scholar]
- St Jeor ST, Hayman LL, Daniels SR, Gillman MW, Howard G, Law CM, et al. Prevention Conference VII: obesity, a worldwide epidemic related to heart disease and stroke: group II: age-dependent risk factors for obesity and comorbidities. Circulation. 2004;110:e471–e475. doi: 10.1161/01.CIR.0000140092.48032.D2. [DOI] [PubMed] [Google Scholar]
- Statistics on obesity, physical activity and diet: England (2010) http://www.ic.nhs.uk/pubs/opadjan08
- Torrance GM, Hooper MD, Reeder BA. Trends in overweight and obesity among adults in Canada (1970–1992): evidence from national surveys using measured height and weight. Int J Obes Relat Metab Disord. 2002;26:797–804. doi: 10.1038/sj.ijo.0801991. [DOI] [PubMed] [Google Scholar]
- Ulmer H, Kelleher C, Diem G, Concin H. Long-term tracking of cardiovascular risk factors among men and women in a large population-based health system: the Vorarlberg Health Monitoring & Promotion Programme. Eur Heart J. 2003;24:1004–1013. doi: 10.1016/S0195-668X(03)00170-2. [DOI] [PubMed] [Google Scholar]
- Wang H, Du S, Zhai F, Popkin BM. Trends in the distribution of body mass index among Chinese adults, aged 20–45 years (1989–2000) Int J Obes. 2007;31:272–278. doi: 10.1038/sj.ijo.0803416. [DOI] [PubMed] [Google Scholar]
- Wilsgaard T, Jacobsen BK, Schirmer H, Thune I, Løchen ML, Njølstad I, et al. Tracking of cardiovascular risk factors: the Tromsø study, 1979–1995. Am J Epidemiol. 2001;154:418–426. doi: 10.1093/aje/154.5.418. [DOI] [PubMed] [Google Scholar]
- Zhai G, Hart DJ, Valdes AM, Kato BS, Richards JB, Hakim A, et al. Natural history and risk factors for bone loss in postmenopausal Caucasian women: a 15-year follow-up population-based study. Osteoporos Int. 2008;19:1211–1217. doi: 10.1007/s00198-008-0562-x. [DOI] [PubMed] [Google Scholar]
Associated Data
This section collects any data citations, data availability statements, or supplementary materials included in this article.
Supplementary Materials
(DOC 56 kb)


