

Abstract
Objective
To investigate the public health impact of obesity and other modifiable risk factors related to physical inactivity in adults with knee osteoarthritis (OA).
Methods
The frequency of inactivity as defined by the United States Department of Health and Human Services was assessed from objective accelerometer monitoring of 1089 participants with radiographic knee OA aged 49 to 84 years during the OAI 48 month visit (2008–2010). The relationship between modifiable factors (weight status, dietary fat, fiber, smoking, depressive symptoms, knee function, knee pain, knee confidence) with inactivity was assessed using odds ratios (OR) and attributable fractions (AF) controlling for descriptive factors (age, gender, race, education, live alone, employment, frequent knee symptoms, comorbidity).
Results
Almost half (48.9%) of participants with knee OA were inactive. Being overweight (OR=1.8, CI: 1.2, 2.5) or obese (OR=3.9, CI: 2.6, 5.7), inadequate dietary fiber intake (OR =1.6, 95% CI: 1.2, 2.2), severe knee dysfunction (OR=1.9, 95% CI: 1.3, 2.8), and severe pain (OR=1.7, 95% CI: 1.1, 2.5) were significantly related to inactivity, controlling for descriptive factors. Modifiable factors with significant average AFs were being overweight or obese (AF=23.8%, 95% CI: 10.5%, 38.6%) and inadequate dietary fiber (AF=12.1%, 95% CI: 0.1%, 24.5%) controlling for all factors.
Conclusion
Being obese or overweight, the quality of the diet, severe pain, and severe dysfunction are significantly associated with physical inactivity in adults with knee OA. All components should be considered in designing physical activity interventions that target arthritis populations with low activity levels.
Arthritis is a growing public health problem in the United States affecting almost 50 million adults.1 The prevalence of activity limitations attributable to arthritis is over 21 million. OA affecting the knee is currently a leading cause of disability in adults.2–4 It is widely recognized that physical activity offers important benefits to persons with arthritis including knee OA. Physical activity programs can reduce pain, improve physical performance, reduce depressive symptoms, and prevent or delay disability in knee OA.5–8 In addition to disease-specific benefits, randomized clinical trials show that physical activity can improve muscle strength and increase aerobic capacity, flexibility, and strength.9–11 Recent federal guidelines now include people with arthritis in the physical activity recommendations to promote these benefits.12
Despite important health benefits from being physically active, persons with arthritis are particularly inactive and are at risk for poor health outcomes.13,14 In a national US survey 44% of persons with arthritis were classified as inactive (i.e. reporting no sustained 10 minute periods of moderate-to-vigorous physical activity in a week) compared to 36% of adults without arthritis.15 Physical inactivity may account for an estimated 21% of activity limitations attributed to arthritis.16 Furthermore, physical inactivity threatens full participation in both employment opportunities and independent community living, and leads to increased healthcare costs.17
Identifying predictors of inactivity is important to develop public health interventions aimed at reducing inactivity. Therefore, this study simultaneously investigated risk factors that are modifiable and related to inactivity to identify strategic targets for public health intervention For example, knee pain and function are commonly viewed as barriers to being physically active for adults with knee OA and significant associations between inactivity were reported in the National Health Interview Survey (NHIS)15 and Canadian National Population Health Survey (CNHS)18 studies. Similarly being overweight, depressive symptoms, and smoking are associated with inactivity7,19,20 and knee confidence is implicated by its strong association with physical function.21 Literature from the general population shows that low fiber intake has been associated with low physical activity levels.22,23
There are limited reports on objectively measured physical activity that examine characteristics of inactivity. The purpose of this study was to identify modifiable risk factors that may increase the frequency of physical inactivity among adults with knee OA and to calculate the attributable fraction of modifiable risk factors that account for the excess physical inactivity in this sample.
MATERIALS AND METHODS
Study Population
This physical activity study evaluated a subcohort from the Osteoarthritis Initiative (OAI), a prospective study investigating risk factors and biomarkers associated with the development and progression of knee OA in adults aged 45–79 years at enrollment, with or at high risk to develop knee OA. Annual OAI evaluations began in 2004 at four clinical sites (Baltimore, Maryland, Columbus, Ohio, Pittsburgh, Pennsylvania, and Pawtucket, Rhode Island) and are currently ongoing (see http://www.oai.ucsf.edu/datarelease/About.asp). IRB approval was obtained at each of the participating sites. Each participant provided written informed consent. The OAI excluded individuals with rheumatoid or inflammatory arthritis; severe joint space narrowing in both knees on the baseline knee radiograph, or unilateral total knee replacement and severe joint space narrowing in the other knee; bilateral total knee replacement or plans to have bilateral knee replacement in the next 3 years; inability to undergo a 3.0T magnetic resonance imaging (MRI) exam of the knee because of contraindications; positive pregnancy test; inability to provide a blood sample; use of ambulatory aides other than a single straight cane for more than 50% of the time during ambulation; comorbid conditions that might interfere with the ability to participate in a 4 year study; current participation in a double-blind randomized trial. All OAI participants underwent knee radiography at baseline. The radiographic acquisition protocol may be found at http://www.oai.ucsf.edu/datarelease/OperationsManuals.asp. Baseline films were assessed by clinic readers for OARSI atlas24 grades of tibiofemoral osteophytes and joint space narrowing. The baseline visit identified 2679 participants with radiographic evidence of knee OA (i.e., definite, or OARSI-atlas grade ≥1, osteophytes) in one or both knees from the total OAI enrollment of n=4796 persons in 2004–2005.
Accelerometer monitoring of physical activity study was offered to a subcohort of OAI participants at the 48 month follow-up visit between 2008 and 2010. A total of n=2127 persons consented to participate in accelerometer monitoring representing 78.4% of the 2712 eligible subcohort participants. (Another 1543 OAI participants had visits that preceded the accelerometer study start date and 541 were deceased/withdrew from the OAI study or/did not return for the 48 month visit). This report included only the 1223 participants with baseline radiographic knee OA as shown in Figure 1. Accelerometer and 48 month visit data were merged with OAI public data25 containing information on participant characteristics.
Figure 1.

Flow chart of analytical sample OAI participants in accelerometer study
Outcome---Physical Activity Measures
Physical activity was measured using a GT1M Actigraph accelerometer, a small uniaxial accelerometer that measures vertical accelerations.26 Uniaxial accelerometer validation studies against whole-body indirect calorimetry showed high correlation with metabolic equivalent (r=0.93) and total energy expenditure (r=0.93).27 The accuracy28 and test-retest reliability29 of Actigraph accelerometers under field conditions are established in many populations including persons with OA.30 Accelerometers output an activity count, which is the weighted sum of the number of accelerations measured over 1 minute periods, where the weights are proportional to the magnitude of measured acceleration.
Trained research personnel gave participants uniform scripted instructions to wear the unit on a belt at the natural waistline on the right hip in line with the right axilla upon arising in the morning and continuously until retiring at night, except during water activities, for seven consecutive days. Participants maintained a daily log to record time spent in water and cycling activities, which may not be fully captured by accelerometers.
Accelerometer data were analytically filtered using methodology validated in adults with rheumatic disease.31–33 Non-wear periods were defined as ≥90 minutes with zero activity counts (allowing for two interrupted minutes with counts<100).32 Accelerometer data included at least 4 or more valid days for each participant. A valid day of monitoring was defined as ≥10 wear hours in a 24 hour period.31 Total daily minutes of moderate-to-vigorous (MV) physical activity was calculated using methodology from the National Institute of Health (counts ≥2020/minute occurring in bouts lasting ≥10 minutes, with allowance for interruptions of 1 or 2 min below the MV threshold).31 Each person was classified according to the US Department of Health and Human Services (DHHS) physical activity guidelines27: Meet Recommendations (≥150 minutes of MV activity bouts/week in bouts lasting at least 10 minutes), Low Active (10–149 minutes of MV bouts/week) or Inactive (zero minutes of MV activity bouts/week).12
Modifiable Risk Factors
Modifiable general health factors included body mass index (BMI) and depressive symptoms. BMI was calculated from measured height and weight [weight (kg)/height (m)2]. Persons were classified as normal weight (BMI=18.5–24.9), overweight (BMI=25.0–29.9), or obese (BMI ≥ 30). High depressive symptoms were assessed by a score ≥ 16 from the Center for Epidemiological Studies Depression scale.34 Knee specific factors included knee function, knee pain, and knee confidence. Self-reported current knee function and pain in the past 7 days were obtained from the WOMAC (Western Ontario and McMaster University OA Index, Likert version 3.1, modified in the OAI).35 Person-level scores used the maximum WOMAC value of the two knees. For the purpose of analysis, we classified WOMAC knee function symptoms based on tertiles as no dysfunction (bottom tertile): 0; moderate: 0.1–11.2; severe dysfunction (top tertile): 11.3–68. Similarly, WOMAC knee pain was classified using tertiles as no pain (bottom tertile): 0, moderate: 0.1–3.9; severe pain (top tertile): 4–20. Knee confidence was assessed using the Knee injury and Osteoarthritis Outcome Score (KOOS)36 question “How much are you troubled with lack of confidence in your knees?” with possible responses of not at all, mildly, moderately, severely, and extremely.
Modifiable behavior factors included smoking status and dietary intake. Smoking status was dichotomized: current smoking versus not current smoking or missing. Dietary intake was assessed at baseline using the BLOCK 2000 systematic nutrition assessment.37,38 For dietary intake variables, we focused on fat intake and dietary fiber intake as they represent the two extremes of low and high calorie dense food. Dietary factors were dichotomized: high (≥35% of daily calories) versus adequate/low fat and inadequate (<20g/day) versus adequate fiber.39,40 Additional nutritional factors measured by the BLOCK 2000 were only weakly associated with inactivity status and therefore were not considered relevant as modifiable factors. The questionnaires can be obtained from the publically available OAI website (http://www.oai.ucsf.edu/datarelease/OperationsManuals.asp).
Descriptive Factors
Covariates were measured at the OAI 48 month visit except where noted. Descriptive covariates included sociodemographics and prior health factors. Sociodemographic baseline factors included race, age, gender, living status, education, and employment (at 24 month visit). Descriptive prior health factors included frequent knee symptoms, comorbidity, and the report of a total knee replacement prior to enrollment. Frequent knee symptoms were ascertained from a positive response to “During the past 12 months, have you had pain, aching, or stiffness in or around your right/left knee on most days for at least one month?” Comorbidities were assessed by the modified Charlson comorbidity index41 at the 24 month visit.
Statistical analysis
Univariate analyses of baseline trend effects across physical activity levels were evaluated by a Mantel Haenszel test for ordinal categories. A chi-square test for overall differences was applied to nominal variables. Modifiable factors associated with physical inactivity were evaluated by logistic regression controlling for all descriptive and modifiable factors; an associated 95% confidence interval that falls above 1 indicates a significant association. Further analyses added interaction terms between gender and each modifiable factor to logistic regression models.
The attributable fraction (AF) related to inactivity was estimated for each modifiable risk factor.42 The sample AF estimates “excess” inactivity based on the risk factor frequency and its association with inactivity. The term “excess” conceptually refers to the reduction in the outcome that would occur if the risk factor were removed from the population. In a cross sectional sample, the AF is the potential reduction in the outcome (e.g., inactivity) if the risk factor was totally absent (e.g., no obesity),43,44 but it does not imply cause and effect. An average AF (AAF) accounts for individuals with multiple factors, estimating the excess proportion of the outcome that can be attributed to any of the designated risk factors.45 The AAF is usually lower than the sum of individual AFs because an outcome is typically attributable to more than one risk factor. The AF estimates were assessed using Poisson regression with robust error variance and the sample prevalence of the modifiable risk factors employing SAS version 9.2 with SAS macro in 2010–2011.46,47
RESULTS
A total of 1223 persons aged 49–84 years with radiographic knee OA participated in physical activity measurement using accelerometers at the 48 month OAI visit. At the baseline OAI visit, 67.1% of these had definite joint space narrowing equivalent of Kellgren-Lawrence grade 3 or 4.48 Participants in this study had similar baseline age (62.0 versus 62.8 years), BMI (29.2 versus 29.8 kg/m2) compared to the non-participating OAI radiographic knee OA cohort, but were more frequently male (44.9% vs. 38.9%), White (81.0% versus 75.3%), with slightly less pain (mean WOMAC pain 3.5 versus 4.6). Of the participants, 1111 (90.8%) had at least 4 valid days of accelerometer monitoring data; 1089 (all but 2%) had complete covariate data.
These 1089 adults with knee OA had mean age of 66.1 years, were primarily female (54.8%), white (83.7%), working (53.9%), did not live alone (78.3%), and had post high school education (84.9%). Few smoked (5.7%), or had high depressive symptoms (11.5%), but substantial portions reported high fat intake (46.3%), inadequate dietary fiber (79.2%), some limitations in knee function (69.1%), knee pain (68.6%), some trouble with lack of knee confidence (53.2%) and were overweight/obese (79.0%). In regard to physical activity, 48.9% (39.8% of men and 56.3% of women) were inactive, demonstrating no 10 minute bouts of moderate-to-vigorous activity during the week of monitoring. Only 10.2% attained recommended activity levels.
Descriptive and modifiable characteristics of this sample by physical activity characteristics are shown in Table 1. All descriptive factors were significantly associated with physical activity levels. Among modifiable factors, greater levels of physical inactivity were significantly associated with greater prevalence of overweight/obesity, inadequate dietary fiber intake, greater WOMAC knee dysfunction, and greater WOMAC knee pain.
Table 1.
Physical activity distribution of adults with radiographic knee OA (n=1089)
| DESCRIPTIVE FACTORS | N | Inactive (%) | Low Active (%) | Met Recommendations (%) | Trend test p-value* |
|---|---|---|---|---|---|
| Overall | 1089 | 48.9 | 41.0 | 10.2 | - |
| Age in years: | |||||
| 49–59 | 300 | 33.7 | 54.3 | 12.0 | <.0001 |
| 60–69 | 374 | 42.8 | 45.7 | 11.5 | |
| 70–79 | 415 | 65.3 | 27.0 | 7.7 | |
| Gender: | |||||
| Male | 492 | 39.8 | 47.2 | 13.0 | <.0001 |
| Female | 597 | 56.3 | 35.9 | 7.9 | |
| Race/Ethnicity: | |||||
| White | 911 | 46.9 | 41.3 | 11.9 | <.0001 |
| Non-White | 178 | 59.0 | 39.3 | 1.7 | |
| Live Alone | |||||
| Yes | 236 | 58.1 | 33.1 | 8.9 | 0.0061 |
| No | 853 | 46.3 | 43.1 | 10.6 | |
| Education | |||||
| Post high school | 925 | 45.5 | 43.4 | 11.1 | <.0001 |
| High school or less | 164 | 67.7 | 27.4 | 4.9 | |
| Employed | |||||
| Working | 587 | 40.6 | 47.4 | 12.1 | <.0001 |
| Not working | 464 | 58.6 | 33.0 | 8.4 | |
| Missing/Other | 38 | 57.9 | 39.5 | 2.6 | |
| Chronic Knee pain | |||||
| No | 576 | 46.9 | 40.1 | 13.0 | 0.0114 |
| Yes | 513 | 51.1 | 41.9 | 7.0 | |
| Total knee replacement prior to enrollment | |||||
| No | 1020 | 68.1 | 27.5 | 4.4 | 0.0012 |
| Yes | 69 | 47.6 | 41.9 | 10.6 | |
| Comorbidity | |||||
| Score 0 | 782 | 44.1 | 44.3 | 11.6 | <.0001 |
| 1–2 | 262 | 61.1 | 32.4 | 6.5 | |
| 3 or more | 45 | 60.0 | 33.3 | 6.7 | |
|
| |||||
| MODIFIABLE FACTORS | |||||
| General Health Factors | |||||
| BMI Normal† | 229 | 35.8 | 46.3 | 17.9 | <.0001 |
| Overweight†† | 441 | 44.0 | 43.5 | 12.5 | |
| Obese††† | 419 | 61.1 | 35.3 | 3.6 | |
| Depressive symptoms | |||||
| Not High | 964 | 48.2 | 41.0 | 10.8 | 0.0948 |
| High (CESD≥16) | 125 | 53.6 | 40.8 | 5.6 | |
| Health Behaviors | |||||
| Fat Intake | |||||
| Adequate/Low | 585 | 47.4 | 41.2 | 11.5 | 0.1394 |
| High | 504 | 50.6 | 40.7 | 8.7 | |
| Dietary Fiber Intake | |||||
| Adequate | 227 | 40.5 | 45.4 | 14.1 | 0.0018 |
| Low | 862 | 51.0 | 37.8 | 9.2 | |
| Smoker | |||||
| No | 1027 | 48.7 | 41.2 | 10.1 | 0.8391 |
| Yes/Missing | 62 | 51.6 | 37.1 | 11.3 | |
| Knee-specific Health Factors | |||||
| WOMAC dysfunction‡ | |||||
| None | 337 | 42.1 | 43.9 | 14.0 | <.0001 |
| Moderate (Middle tertile) | 378 | 46.0 | 41.5 | 12.4 | |
| Severe (Top tertile) | 374 | 57.8 | 37.7 | 4.6 | |
| WOMAC knee pain‡‡ | |||||
| None | 342 | 43.3 | 42.7 | 14.0 | <.0001 |
| Moderate (Middle tertile) | 364 | 47.5 | 40.7 | 11.8 | |
| Severe (Top tertile) | 383 | 55.1 | 39.7 | 5.2 | |
| Knee Confidence | |||||
| Not troubled | 510 | 48.8 | 39.6 | 11.6 | 0.2006 |
| Mild/Moderately Troubled | 530 | 47.6 | 43.2 | 9.3 | |
| Severely/extremely Troubled | 49 | 63.3 | 30.6 | 6.1 | |
Mantel-Haenszel chi-square test for trend (1 d.f.) except for race, gender, and living arrangement comparisons, which used chi-square test for overall differences;
Normal includes 1 person with BMI below the range 18.5–24.9;
Overweight BMI 25.0–29.9;
Obese BM ≥ 30;
WOMAC function tertiles based on maximum of left and right knees: low 0.0, middle 1.0–11.2; top tertile ≥ 11.3;
WOMAC pain tertiles based on maximum of left and right knees: none, 0<middle<4.0; top (most pain) tertile ≥ 4.0
The association of modifiable factors with inactivity quantified as odds ratios (OR) is summarized in Table 2. Modifiable factors significantly related to inactivity were being overweight (OR=1.8, 95% CI=1.2, 2.5) or obese (OR=3.9, 95% CI=2.6, 5.7), inadequate dietary fiber intake (OR=1.6, 95% CI=1.2, 2.2), severe dysfunction (OR=1.9, CI=1.3, 2.8), and severe pain (OR=1.7, 95% CI=1.1, 2.5), after controlling for descriptive factors. Being overweight (OR=1.8, CI: 1.2, 2.5) or obese (OR=3.7, CI: 2.5, 5.4) and inadequate dietary fiber intake (OR =1.5, 95% CI: 1.1, 2.1) were significantly related to inactivity, when controlling for all descriptive and modifiable factors.
Table 2.
Modifiable health factor odds ratios for physical inactivity in adults with radiographic knee OA (n=1089)
| Modifiable Health Factors | N | Percent Inactive | Unadjusted Odds Ratio (95% CI) | Odds Ratio Adjusted for Descriptive Factors# (95% CI) | Odds Ratio Adjusted for Descriptive Factors and Other Modifiable Factors## (95% CI) |
|---|---|---|---|---|---|
| Health Behaviors | |||||
| Fat Intake | |||||
| Adequate/Low | 585 | 47.4 | Reference | Reference | Reference |
| High | 504 | 50.6 | 1.1 (0.9, 1.4) | 1.3 (0.9, 1.6) | 1.0 (0.8, 1.3) |
|
| |||||
| Dietary Fiber Intake | |||||
| Adequate | 227 | 40.5 | Reference | Reference | Reference |
| Inadequate | 862 | 51.0 | 1.5 (1.1, 2.1) | 1.6 (1.2, 2.2) | 1.5 (1.1, 2.1) |
|
| |||||
| Smoker | |||||
| No | 1027 | 48.7 | Reference | Reference | Reference |
| Yes/Missing | 62 | 51.6 | 1.1 (0.7, 1.9) | 1.4 (0.8, 2.5) | 1.4 (0.8, 2.5) |
|
| |||||
| General Health Factors | |||||
| Weight status Normal† | 229 | 35.8 | Reference | Reference | Reference |
| Overweight†† | 441 | 44.0 | 1.4 (1.0, 2.0) | 1.8 (1.2, 2.5) | 1.8 (1.2, 2.5) |
| Obese††† | 419 | 61.1 | 2.8 (2.0, 3.9) | 3.9 (2.6, 5.7) | 3.7 (2.5, 5.4) |
|
| |||||
| Depressive symptoms | |||||
| Not high | 964 | 48.2 | Reference | Reference | Reference |
| High | 125 | 53.6 | 1.2 (0.9, 1.8) | 1.2 (0.8, 1.8) | 1.0 (0.7, 1.6) |
|
| |||||
| Knee Specific Factors | |||||
| WOMAC function‡ | |||||
| No dysfunction | 337 | 42.1 | Reference | Reference | Reference |
| Moderate (middle tertile) | 378 | 46.0 | 1.2 (0.9, 1.6) | 1.3 (0.9, 1.8) | 1.1 (0.7, 1.7) |
| Severe (top tertile) | 374 | 57.8 | 1.9 (1.4, 2.5) | 1.9 (1.3, 2.8) | 1.7 (0.9, 3.1) |
|
| |||||
| WOMAC knee pain‡‡ | |||||
| No pain | 342 | 43.3 | Reference | Reference | Reference |
| Moderate (middle tertile) | 364 | 47.5 | 1.2 (0.9, 1.6) | 1.4 (0.9, 1.9) | 1.3 (0.8, 2.0) |
| Severe (top tertile) | 383 | 55.1 | 1.6 (1.2, 2.2) | 1.7 (1.1, 2.5) | 1.1 (0.6, 2.0) |
|
| |||||
| Knee Confidence | |||||
| Not troubled | 510 | 48.8 | Reference | Reference | Reference |
| Mildly/Moderately troubled | 530 | 47.6 | 1.0 (0.7, 1.2) | 1.0 (0.7, 1.3) | 0.8 (0.6, 1.1) |
| Severely/extremely troubled | 49 | 63.3 | 1.8 (1.0, 3.3) | 1.8 (0.9, 3.6) | 1.4 (0.6, 2.9) |
Adjusted for descriptive factors (age, gender, race, living status, education, employment, chronic knee pain, total knee replacement, comorbidities) with associated 95% confidence interval.
Adjusted for all descriptive and other modifiable factors with associated 95% confidence interval.
Normal includes 1 person with BMI below the range 18.5–24.9;
Overweight BMI 25.0–29.9;
Obese BM ≥ 30;
WOMAC function tertiles based on maximum of left and right knees: no dysfunction 0.0, moderate >.0–11.2; severe >11.2;
WOMAC pain tertiles based on maximum of left and right knees: none 0.0, moderate >0–3.9; severe>3.9.
The influence of modifiable factors on inactivity is further examined from a public health perspective. Figure 2 presents the modifiable factor AAFs adjusted for descriptive and other modifiable factors. The AAF accounts for the fact that some individuals have multiple modifiable risk factors. For example, among overweight/obese adults in this study, 80.2% had low fiber diets and 70.8% had knee pain. AAF model includes the significant modifiable factors based on the bivariate relationship between inactivity using logistic regression: dietary fiber intake, weight status, knee function, knee pain. Being overweight/obese had a statistically significant 23.8% (95% CI =10.5%, 38.6%) relationship to excess inactivity. Inadequate dietary fiber was significantly related to another 12.1% (95% CI=0.1%, 24.5%). Together, being obese/overweight and having a low fiber diet accounted for 35.9% of excess inactivity in these adults with knee OA. Remaining modifiable factors were related to less than 7% excess inactivity and were not significant.
Figure 2. Adjusted* average attributable fraction of inactivity for modifiable factors.
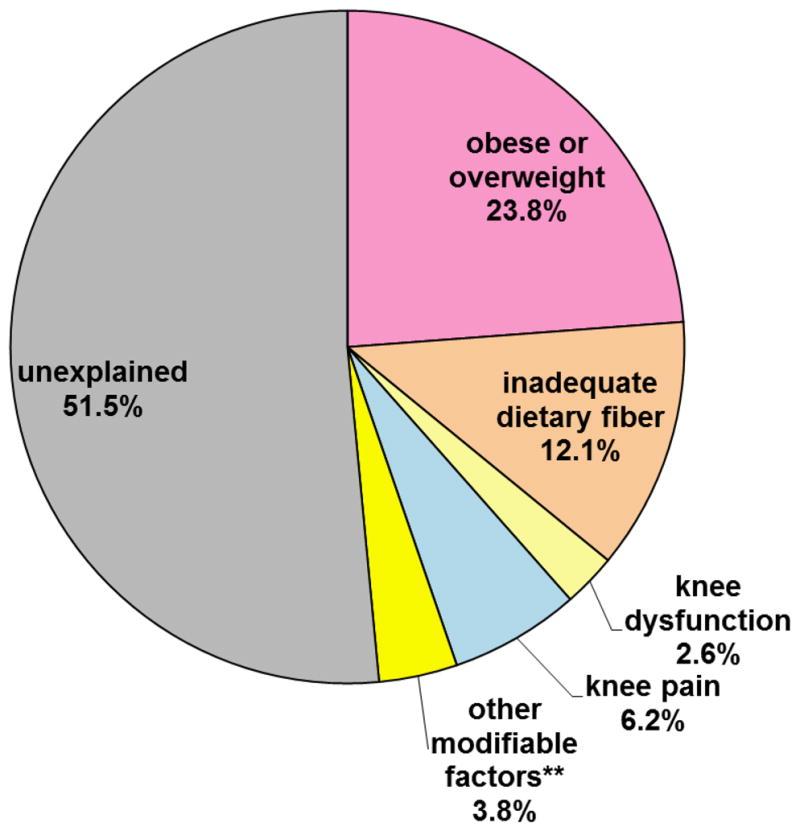
*Adjusted for descriptive factors (age, gender, race, living status, education, employment, chronic knee pain, total knee replacement, comorbidities) and all modifiable factors (obese/overweight, inadequate dietary fiber, knee dysfunction, knee pain, a high fat diet, smoking, high depressive symptoms, or being troubled by knee confidence).
**Aggregated contribution of remaining modifiable risk factors (high fat diet, smoking, high depressive symptoms, or being troubled by knee confidence)
DISCUSSION
This study contributes to public health efforts to improve health outcomes of persons with arthritis by examining the association of potentially modifiable risk factors associated with physical inactivity in a large cohort of adults with radiographic evidence of knee OA. An important strength of this study is the objective assessment of physical inactivity. Only one of ten adults with knee OA had recommended physical activity levels. Notably, over one-third of men and half the women were completely inactive, doing no sustained moderate-to-vigorous activity that lasted ≥10 minutes in a week. Modifiable factors significantly associated with inactivity were being overweight/obese and consuming a diet with inadequate fiber, the report of severe knee limitations, and severe knee pain. Over 23.8% of excess inactivity was related to being overweight/obese, and another 12.1% was related to inadequate dietary fiber consumption, after accounting for other descriptive and modifiable factors.
A low level of physical activity among adults with arthritis is a recognized public health concern. However, assessing the magnitude of the problem has been a challenge due to differing methods for assessing physical activity. Earlier studies that relied on self-reported physical activity levels estimate that 23.8–57.8% adults with arthritis in the Unites States are inactive.13,15,16,18–20 Imbedded into these estimates are differences related to the self-report of physical activity and how inactivity was defined. Inactivity was defined by no reported leisure time activity19,49, less than 10 minutes/week MV leisure activities;13 less than 3 sessions/month lasting ≥15 minutes of activities associated with moderate intensity energy expenditure,16,18 and no reported activities lasting ≥10 minutes.15 In this study, definition of physical inactivity is anchored on the federal DHHS definition and is assessed by objective accelerometer monitoring.
Modifiable factors were evaluated from two perspectives. The first perspective identifies factors associated with physical inactivity at the level of the individual. Modifiable factors significantly associated with inactivity based on adjusted ORs were obesity, knee pain, knee dysfunction, and dietary fiber intake. Earlier studies on adults reporting an arthritis diagnosis18,19 found a significant relationship between inactivity and being overweight, but a 2002 NHIS study did not find a significant association.15 These reports evaluate broader arthritis populations than the current study and rely on self-report to assess inactivity and weight status. Self-report is related to underreporting of weight51 and over reporting of physical activity amount/intensity.51 It is not known how reporting accuracy may influence the apparent association between inactivity and weight status, but measurement issues may contribute to the mixed findings across earlier studies.
Significant associations between inactivity and self-reported knee dysfunction (OR=1.9) and pain (OR=1.7), were in line with findings from the NHIS15 and CNHS18 studies. We also found a significant association between inactivity and inadequate fiber intake (OR=1.6). In the general adult population, low fiber intake has been associated with low physical activity levels.22,23 This association may partially reflect the association of a low fiber diet, representing low intake of fruits, vegetables, whole grains and high consumption of refined carbohydrate/sugar related to snacking and a sedentary lifestyle.52,53 Thus, a low fiber diet may be a marker for unhealthy behaviors that include inactivity and high-fat/high-sugar snacking.
A second public health perspective examined the influence of each modifiable factor on inactivity by estimating the AAF for the sample. The sample AAF has public health relevance because the metric incorporates population criteria related to the risk factor prevalence plus its association with the outcome. Recognizing that many individuals had multiple modifiable risk factors (e.g., 80.2% of overweight/obese adults had low fiber diets and 70.8% reported pain), we examined the simultaneous effect of all modifiable risk factors on inactivity. While pain (AAF=6.2%) and dysfunction (AAF=2.6%) are associated with lower levels of inactivity, being obese/overweight (AAF=23.8%) and inadequate dietary fiber (AAF=12.1%) explain a significant and larger proportion of inactivity. The results reinforce the contribution of excess weight and poor diet.
Pain and poor function are commonly viewed as barriers to being physically active for adults with knee OA.15,18,54 These findings indicate that being overweight/obese and an unhealthy diet are also important to consider. There is evidence that higher BMI is related to greater knee pain and poor function in adults with knee OA.55–58 In turn, high levels of pain are associated with binge eating.59 If obesity due to poor dietary patterns contributes to knee pain and resulting poor function through mechanical stress due to excess weight on the joint, then obesity supported by poor dietary choices may contribute to the relationship between knee pain and inactivity. However, randomized controlled trials show that exercise is safe and effective for overweight/obese adults with OA58. Taken together, these results support incorporating weight loss and diet modification into interventions designed to promote health benefits from physical activity.
There are limitations to acknowledge in the present study. Accelerometers do not provide information on the type of the physical activity (e.g., household, transportation), information which may be helpful in targeting interventions. The accelerometer used in this study cannot capture water activities and may underestimate upper body movement or activities such as cycling. Diary information showed a median of 0 minutes/day spent in water and cycling activities, so the potential underestimate of inactivity is negligible. Radiographic data on knee joint damage and dietary information were only available from baseline, 4 years prior to the current study. Because joint damage does not improve over time and people with subsequent knee replacements were excluded, radiographic verification remains valid. Dietary fiber intake tends to remain stable or decrease slightly over a three to four year period, as demonstrated by control groups from large nutritional trials;60,61 a potential underestimate of inadequate fiber intake would likely understate the strength of its relationship with inactivity found in our analyses. Self-reported data are commonly subject to social desirability bias and recall bias. However, to minimize biases we have used validated questionnaires such as BLOCK 2000 for dietary variables, CES-D for depressive symptoms, WOMAC for knee function and pain, and KOOS for knee confidence. Our results will be strengthened if participants over-reported dietary fiber intake as we would have under-estimated the effects of dietary fiber. Finally, causality cannot be inferred from these cross-sectional data. These limitations must be balanced against the substantial strengths of this study which include the large sample size, clinical measures of height and weight as opposed to self-reports, radiographic verification of knee OA, and the age and gender diversity of this OA cohort. An important strength of this study is that federal DHHS definition of inactivity27 based on objective accelerometer monitoring was used.
Despite substantial health benefits related to physical activity, adults with radiographic knee OA were particularly inactive. A substantial 48.9% of adults with knee OA were classified as inactive, demonstrating no 10 minute episodes of moderate-to-vigorous activity in a week. There is a critical need to intensify public health efforts to reduce physical inactivity among adults with knee OA. Being obese/overweight, the quality of the diet, severe pain, severe dysfunction, and levels of physical activity are inter-related in adults with knee OA. One cannot hope to improve physical activity patterns in adults with knee OA without consideration for weight management, diet, and OA pain and disability, as all may affect successful achievement of activity goals. All components should be considered in developing physical activity interventions that target arthritis populations with low activity levels.
Significance and Innovations.
We investigated the potential public health impact of modifiable factors including being obese/overweight, low fiber diet, inadequate dietary fat, smoking status, depressive symptoms, severe knee pain, and severe knee dysfunction related to physical inactivity in adults with knee osteoarthritis.
The public health importance of each modifiable risk factor on physical inactivity was estimated using the attributable fraction.
Modifiable factors significantly associated with physical inactivity (being obese/overweight, the quality of the diet, severe knee pain, and severe knee dysfunction) should be considered in developing physical activity interventions that target arthritis populations with low activity levels.
Acknowledgments
This study is supported in part by National Institute for Arthritis and Musculoskeletal Diseases (grant no. P60-AR48098, R01-AR055287, R01- AR054155, and R21-AR059412) and the Falk Medical Research Trust. The OAI is a public-private partnership comprised of five contracts (N01-AR-2-2258; N01-AR-2-2259; N01-AR-2-2260; N01-AR-2-2261; N01-AR-2-2262) funded by the National Institutes of Health, a branch of the Department of Health and Human Services, and conducted by the OAI Study Investigators. Private funding partners include Merck Research Laboratories; Novartis Pharmaceuticals Corporation, GlaxoSmithKline; and Pfizer, Inc. Private sector funding for the OAI is managed by the Foundation for the National Institutes of Health. The findings and conclusions in this report are those of the authors and do not necessarily represent the official position of the Centers for Disease Control and Prevention or the OAI.
References
- 1.Centers for Disease Control and Prevention. Prevalence of doctor-diagnosed arthritis and arthritis-attributable activity limitation --- United States, 2007–2009. MMWR Morb Mortal Wkly Rep. 2010;59:1261–5. [PubMed] [Google Scholar]
- 2.Lawrence RC, Felson DT, Helmick CG, et al. Estimates of the prevalence of arthritis and other rheumatic conditions in the United States. Part II Arthritis Rheum. 2008;58:26–35. doi: 10.1002/art.23176. [DOI] [PMC free article] [PubMed] [Google Scholar]
- 3.Yelin E. Cost of musculoskeletal diseases: impact of work disability and functional decline. The Journal of Rheumatology Supplement. 2003;68:8–11. [PubMed] [Google Scholar]
- 4.Felson DT, Lawrence RC, Dieppe PA, et al. Osteoarthritis: new insights. Part 1: the disease and its risk factors. Ann Intern Med. 2000;133:635–46. doi: 10.7326/0003-4819-133-8-200010170-00016. [DOI] [PubMed] [Google Scholar]
- 5.Deyle GD, Henderson NE, Matekel RL, Ryder MG, Garber MB, Allison SC. Effectiveness of manual physical therapy and exercise in osteoarthritis of the knee. A randomized, controlled trial. Ann Intern Med. 2000;132:173–81. doi: 10.7326/0003-4819-132-3-200002010-00002. [DOI] [PubMed] [Google Scholar]
- 6.Ettinger WH, Jr, Burns R, Messier SP, et al. A randomized trial comparing aerobic exercise and resistance exercise with a health education program in older adults with knee osteoarthritis. The Fitness Arthritis and Seniors Trial (FAST) JAMA. 1997;277:25–31. [PubMed] [Google Scholar]
- 7.Penninx BW, Rejeski WJ, Pandya J, et al. Exercise and depressive symptoms: a comparison of aerobic and resistance exercise effects on emotional and physical function in older persons with high and low depressive symptomatology. J Gerontol B Psychol Sci Soc Sci. 2002;57:124–32. doi: 10.1093/geronb/57.2.p124. [DOI] [PubMed] [Google Scholar]
- 8.Penninx BW, Messier SP, Rejeski WJ, et al. Physical exercise and the prevention of disability in activities of daily living in older persons with osteoarthritis. Arch Intern Med. 2001;161:2309–16. doi: 10.1001/archinte.161.19.2309. [DOI] [PubMed] [Google Scholar]
- 9.Ades PA, Ballor DL, Ashikaga T, Utton JL, Nair KS. Weight training improves walking endurance in healthy elderly persons. Ann Intern Med. 1996;124:568–72. doi: 10.7326/0003-4819-124-6-199603150-00005. [DOI] [PubMed] [Google Scholar]
- 10.Cress ME, Buchner DM, Questad KA, Esselman PC, deLateur BJ, Schwartz RS. Exercise: effects on physical functional performance in independent older adults. J Gerontol A Biol Sci Med Sci. 1999;54:242–8. doi: 10.1093/gerona/54.5.m242. [DOI] [PubMed] [Google Scholar]
- 11.Fiatarone MA, Marks EC, Ryan ND, Meredith CN, Lipsitz LA, Evans WJ. High-intensity strength training in nonagenarians. Effects on skeletal muscle. JAMA. 1990;263:3029–34. [PubMed] [Google Scholar]
- 12.Department of Health and Human Services. 2008 Physical Activity Guidelines for Americans. Department of Health and Human Services; USA: Oct, 2008. [Google Scholar]
- 13.Fontaine KR, Heo M, Bathon J. Are US adults with arthritis meeting public health recommendations for physical activity? Arthritis Rheum. 2004;50:624–8. doi: 10.1002/art.20057. [DOI] [PubMed] [Google Scholar]
- 14.Keysor JJ. Does late-life physical activity or exercise prevent or minimize disablement? A critical review of the scientific evidence. Am J Prev Med. 2003;25:129–36. doi: 10.1016/s0749-3797(03)00176-4. [DOI] [PubMed] [Google Scholar]
- 15.Shih M, Hootman JM, Kruger J, Helmick CG. Physical activity in men and women with arthritis National Health Interview Survey, 2002. Am J Prev Med. 2006;30:385–93. doi: 10.1016/j.amepre.2005.12.005. [DOI] [PubMed] [Google Scholar]
- 16.Badley EM, Ansari H. Arthritis and arthritis-attributable activity limitations in the United States and Canada: a cross-border comparison. Arthritis Care Res (Hoboken) 2010;62:308–15. doi: 10.1002/acr.20100. [DOI] [PubMed] [Google Scholar]
- 17.Wang G, Helmick CG, Macera C, Zhang P, Pratt M. Inactivity-Associated medical costs among US adults with arthritis. Arthritis Rheum. 2001;45:439–45. doi: 10.1002/1529-0131(200110)45:5<439::aid-art363>3.0.co;2-m. [DOI] [PubMed] [Google Scholar]
- 18.Colbert CJ, Song J, Dunlop D, et al. Knee confidence as it relates to physical function outcome in persons with or at higher risk for knee osteoarthritis in the osteoarthritis initiative. Arthritis and rheumatism. 2011 doi: 10.1002/art.33505. [DOI] [PMC free article] [PubMed] [Google Scholar]
- 19.Gillman MW, Pinto BM, Tennstedt S, Glanz K, Marcus B, Friedman RH. Relationships of physical activity with dietary behaviors among adults. Preventive medicine. 2001;32:295–301. doi: 10.1006/pmed.2000.0812. [DOI] [PubMed] [Google Scholar]
- 20.Kaplan MS, Huguet N, Newsom JT, McFarland BH. Characteristics of physically inactive older adults with arthritis: results of a population-based study. Prev Med. 2003;37:61–7. doi: 10.1016/s0091-7435(03)00059-8. [DOI] [PubMed] [Google Scholar]
- 21.Mehrotra C, Chudy N, Thomas V. Obesity and physical inactivity among Wisconsin adults with arthritis. WMJ: official publication of the State Medical Society of Wisconsin. 2003;102:24–8. [PubMed] [Google Scholar]
- 22.Strine TW, Balluz LS, Ford ES. The associations between smoking, physical inactivity, obesity, and asthma severity in the general US population. The Journal of Asthma: official journal of the Association for the Care of Asthma. 2007;44:651–8. doi: 10.1080/02770900701554896. [DOI] [PubMed] [Google Scholar]
- 23.Rogers MW, Wilder FV. The association of BMI and knee pain among persons with radiographic knee osteoarthritis: a cross-sectional study. BMC Musculoskeletal Disorders. 2008;9:163. doi: 10.1186/1471-2474-9-163. [DOI] [PMC free article] [PubMed] [Google Scholar]
- 24.Somers TJ, Keefe FJ, Pells JJ, et al. Pain catastrophizing and pain-related fear in osteoarthritis patients: relationships to pain and disability. Journal of Pain and Symptom management. 2009;37:863–72. doi: 10.1016/j.jpainsymman.2008.05.009. [DOI] [PMC free article] [PubMed] [Google Scholar]
- 25.Altman RD, Hochberg M, Murphy WA, Jr, Wolfe F, Lequesne M. Atlas of individual radiographic features in osteoarthritis. Osteoarthritis Cartilage. 1995;3 (Suppl A):3–70. [PubMed] [Google Scholar]
- 26.Center OIC. Osteoarthritis Initiative (OAI) database. San Francisco, CA: 2010. The Osteoarthritis Initiative. Baseline 0.2.2, 12 month visit 1.2.1, 24 month visit 3.2.1 and 36 month visit 5.2.1 ed. [Google Scholar]
- 27.Matthews CE, Ainsworth BE, Thompson RW, Bassett DR., Jr Sources of variance in daily physical activity levels as measured by an accelerometer. Med Sci Sports Exerc. 2002;34:1376–81. doi: 10.1097/00005768-200208000-00021. [DOI] [PubMed] [Google Scholar]
- 28.Kumahara H, Schutz Y, Ayabe M, et al. The use of uniaxial accelerometry for the assessment of physical-activity-related energy expenditure: a validation study against whole-body indirect calorimetry. The British journal of nutrition. 2004;91:235–43. doi: 10.1079/BJN20031033. [DOI] [PubMed] [Google Scholar]
- 29.Brage S, Wedderkopp N, Franks PW, Andersen LB, Froberg K. Reexamination of validity and reliability of the CSA monitor in walking and running. Med Sci Sports Exerc. 2003;35:1447–54. doi: 10.1249/01.MSS.0000079078.62035.EC. [DOI] [PubMed] [Google Scholar]
- 30.Welk GJ, Schaben JA, Morrow JR., Jr Reliability of accelerometry-based activity monitors: a generalizability study. Med Sci Sports Exerc. 2004;36:1637–45. [PubMed] [Google Scholar]
- 31.Farr JN, Going SB, Lohman TG, et al. Physical activity levels in patients with early knee osteoarthritis measured by accelerometry. Arthritis Rheum. 2008;59:1229–36. doi: 10.1002/art.24007. [DOI] [PMC free article] [PubMed] [Google Scholar]
- 32.Troiano RP, Berrigan D, Dodd KW, Masse LC, Tilert T, McDowell M. Physical activity in the United States measured by accelerometer. Med Sci Sports Exerc. 2008;40:181–8. doi: 10.1249/mss.0b013e31815a51b3. [DOI] [PubMed] [Google Scholar]
- 33.Song J, Semanik P, Sharma L, et al. Assessing physical activity in persons with knee osteoarthritis using accelerometers: Data in the osteoarthritis initiative. Arthritis Care Res (Hoboken) 2010 doi: 10.1002/acr.20305. [DOI] [PMC free article] [PubMed] [Google Scholar]
- 34.Semanik P, Song J, Chang RW, Manheim L, Ainsworth B, Dunlop D. Assessing physical activity in persons with rheumatoid arthritis using accelerometry. Med Sci Sports Exerc. 2010;42:1493–501. doi: 10.1249/MSS.0b013e3181cfc9da. [DOI] [PMC free article] [PubMed] [Google Scholar]
- 35.Pandya R, Metz L, Patten SB. Predictive value of the CES-D in detecting depression among candidates for disease-modifying multiple sclerosis treatment. Psychosomatics. 2005;46:131–4. doi: 10.1176/appi.psy.46.2.131. [DOI] [PubMed] [Google Scholar]
- 36.McGrory BJ, Harris WH. Can the western Ontario and McMaster Universities (WOMAC) osteoarthritis index be used to evaluate different hip joints in the same patient? J Arthroplasty. 1996;11:841–4. doi: 10.1016/s0883-5403(96)80184-7. [DOI] [PubMed] [Google Scholar]
- 37.Roos EM, Roos HP, Lohmander LS, Ekdahl C, Beynnon BD. Knee Injury and Osteoarthritis Outcome Score (KOOS)--development of a self-administered outcome measure. J Orthop Sports Phys Ther. 1998;28:88–96. doi: 10.2519/jospt.1998.28.2.88. [DOI] [PubMed] [Google Scholar]
- 38.Block G, Woods M, Potosky A, Clifford C. Validation of a self-administered diet history questionnaire using multiple diet records. J Clin Epidemiol. 1990;43:1327–35. doi: 10.1016/0895-4356(90)90099-b. [DOI] [PubMed] [Google Scholar]
- 39.Subar AF, Thompson FE, Kipnis V, et al. Comparative validation of the Block, Willett, and National Cancer Institute food frequency questionnaires: the Eating at America’s Table Study. Am J Epidemiol. 2001;154:1089–99. doi: 10.1093/aje/154.12.1089. [DOI] [PubMed] [Google Scholar]
- 40.Dietary Guidelines Advisory Committee on the Dietary Guidelines for Americans. Report of the Dietary Guidelines Advisory Committee on the Dietary Guidelines for Americans, 2010. Washington, DC: U.S. Department of Health and Human Services; 2010. [Google Scholar]
- 41.Institute of Medicine Panel on Macronutrients, Subcommittes on Upper Reference Levels of Nutrients and Interpretation and Uses of Dietary Referece Intakes, Standing Committe on the Scientific Evaluation of Dietary Reference Intakes. Dietary Reference Intakes for Energy, Carbohydrates, Fiber, Fat, Fatty Acids, Cholesterol, Protein, and Amino Acids (Macronutrients) Washington DC: The National Academies Press; 2005. [Google Scholar]
- 42.Katz JN, Chang LC, Sangha O, Fossel AH, Bates DW. Can comorbidity be measured by questionnaire rather than medical record review? Med Care. 1996;34:73–84. doi: 10.1097/00005650-199601000-00006. [DOI] [PubMed] [Google Scholar]
- 43.Levin ML. The occurrence of lung cancer in man Acta Unio Internationalis contra. Cancrum. 1953;19:531–41. [PubMed] [Google Scholar]
- 44.Fleiss JL. Statistical Methods for Rates and Proportions. 2. New York: John Wiley & Sons; 1981. Attributable Risk; pp. 75–7. [Google Scholar]
- 45.Benichou J. A review of adjusted estimators of attributable risk. Stat Methods Med Res. 2001;10:195–216. doi: 10.1177/096228020101000303. [DOI] [PubMed] [Google Scholar]
- 46.Eide GE, Gefeller O. Sequential and average attributable fractions as aids in the selection of preventive strategies. J Clin Epidemiol. 1995;48:645–55. doi: 10.1016/0895-4356(94)00161-i. [DOI] [PubMed] [Google Scholar]
- 47.Spiegelman D, Hertzmark E, Wand HC. Point and interval estimates of partial population attributable risks in cohort studies: examples and software. Cancer Causes Control. 2007;18:571–9. doi: 10.1007/s10552-006-0090-y. [DOI] [PubMed] [Google Scholar]
- 48.Hertzmark E. Software for computing full and partial population attributable risks and their confidence intervals. Boston MA: 2006. [Google Scholar]
- 49.Kellgren JH, Lawrence JS. Radiological assessment of osteo-arthrosis. Ann Rheum Dis. 1957;16:494–502. doi: 10.1136/ard.16.4.494. [DOI] [PMC free article] [PubMed] [Google Scholar]
- 50.Hootman JM, Macera CA, Ham SA, Helmick CG, Sniezek JE. Physical activity levels among the general US adult population and in adults with and without arthritis. Arthritis Rheum. 2003;49:129–35. doi: 10.1002/art.10911. [DOI] [PubMed] [Google Scholar]
- 51.Villanueva EV. The validity of self-reported weight in US adults: a population based cross-sectional study. BMC Public Health. 2001;1:11. doi: 10.1186/1471-2458-1-11. [DOI] [PMC free article] [PubMed] [Google Scholar]
- 52.Irwin ML, Ainsworth BE, Conway JM. Estimation of energy expenditure from physical activity measures: determinants of accuracy. Obes Res. 2001;9:517–25. doi: 10.1038/oby.2001.68. [DOI] [PubMed] [Google Scholar]
- 53.Eaton CB, McPhillips JB, Gans KM, et al. Cross-sectional relationship between diet and physical activity in two southeastern New England communities. Am J Prev Med. 1995;11:238–44. [PubMed] [Google Scholar]
- 54.Spruijt-Metz D, Belcher B, Anderson D, et al. A high-sugar/low-fiber meal compared with a low-sugar/high-fiber meal leads to higher leptin and physical activity levels in overweight Latina females. Journal of the American Dietetic Association. 2009;109:1058–63. doi: 10.1016/j.jada.2009.03.013. [DOI] [PMC free article] [PubMed] [Google Scholar]
- 55.Thayer R. Calm energy: How people regulate mood with food and exercise. New York: Oxford University Press; 2001. [Google Scholar]
- 56.McBeth J, Nicholl BI, Cordingley L, Davies KA, Macfarlane GJ. Chronic widespread pain predicts physical inactivity: results from the prospective EPIFUND study. Eur J Pain. 2010;14:972–9. doi: 10.1016/j.ejpain.2010.03.005. [DOI] [PMC free article] [PubMed] [Google Scholar]
- 57.Marks R. Obesity profiles with knee osteoarthritis: correlation with pain, disability, disease progression. Obesity Silver Spring, MD. 2007;15:1867–74. doi: 10.1038/oby.2007.221. [DOI] [PubMed] [Google Scholar]
- 58.Messier SP, Loeser RF, Miller GD, et al. Exercise and dietary weight loss in overweight and obese older adults with knee osteoarthritis: the Arthritis, Diet, and Activity Promotion Trial. Arthritis Rheum. 2004;50:1501–10. doi: 10.1002/art.20256. [DOI] [PubMed] [Google Scholar]
- 59.Somers TJ, Keefe FJ, Carson JW, Pells JJ, Lacaille L. Pain catastrophizing in borderline morbidly obese and morbidly obese individuals with osteoarthritic knee pain. Pain Res Manag. 2008;13:401–6. doi: 10.1155/2008/652453. [DOI] [PMC free article] [PubMed] [Google Scholar]
- 60.Pierce JP, Natarajan L, Caan BJ, et al. Influence of a diet very high in vegetables, fruit, and fiber and low in fat on prognosis following treatment for breast cancer: the Women’s Healthy Eating and Living (WHEL) randomized trial. JAMA. 2007;298:289–98. doi: 10.1001/jama.298.3.289. [DOI] [PMC free article] [PubMed] [Google Scholar]
- 61.Beresford SA, Johnson KC, Ritenbaugh C, et al. Low-fat dietary pattern and risk of colorectal cancer: the Women’s Health Initiative Randomized Controlled Dietary Modification Trial. JAMA. 2006;295:643–54. doi: 10.1001/jama.295.6.643. [DOI] [PubMed] [Google Scholar]