Abstract
Round window is one of the two openings into cochlea from the middle ear. Mechanical properties of round window membrane (RWM) affect cochlear fluid motion and play an important role in transmission of sound into cochlea. However, no measurement of mechanical properties of RWM has been reported because of the complication of its location and small size. This paper reports the first investigation on dynamic properties of human RWM using acoustic stimulation and laser Doppler vibrometry measurement. The experiments on RWM specimens were subsequently simulated in finite element (FE) model and an inverse-problem solving method was used to determine the complex modulus in frequency-domain and the relaxation modulus in time-domain. The results show that the average storage modulus of human RWM changes from 2.32 to 3.83 MPa and the average loss modulus from 0.085 to 0.925 MPa over frequencies of 200 to 8000 Hz. The effects of specimen geometry and experimental condition on complex modulus measurements were discussed through FE modeling analysis. Dynamic properties of RWM reported in this paper provide important data for study of middle ear and cochlear mechanics.
Keywords: round window membrane, laser Doppler vibrometry, complex modulus, finite element model
INTRODUCTION
Round window is one of the two openings into the cochlea from the middle ear. The round window membrane (RWM) vibrates with an opposite phase to acoustic vibrations entering the cochlea through the stapes at the oval window, another opening of the cochlea to the middle ear. RWM serves as a barrier between the middle ear cavity and cochlea and plays an important role in middle ear and cochlear mechanics [1–3]. Mechanical properties of RWM affect cochlear fluid motion and thus the movement of the basilar membrane.
RWM consists of three layers from the middle ear to cochlear side: the outer epithelium, core of connective tissue layer and inner epithelium [4, 5]. The core of connective tissue contains collagen fibers, fibroblast and other elastic fibers and provides the main structural support for RWM. Adult human RWM is usually thicker at the edge than at the center, and its average thickness is about 70 µm [4, 5].
Middle ear diseases such as otitis media usually induce the changes of RWM in thickness and permeability and induce possible sensorineural hearing loss [6–8]. Recently, it has been reported that the vibration transducer of middle ear implantable hearing device has been attached on the RWM to stimulate cochlear fluid for restoring hearing level [9–11]. Beltrame et al. [12] coupled the floating mass transducer (Soundbridge, MED-EL, Austria) onto the RWM and assessed its function for patients with mixed hearing loss associated with otitis media or otosclerosis. Koka et al. [13] measured the cochlear microphonic and mechanical (stapes velocity) response in chinchillas, which were induced by normal acoustic stimulation and round window stimulation with an active middle ear prosthesis. Arnold et al. [14] tested the effectiveness of different coupling methods with the floating mass transducer on RWM in a human cadaver head and discussed the factor to improve the vibration transfer. The studies on RWM using implantable transducers indicate that the attachment method and RWM mechanical properties directly affect the efficiency of vibration stimulation into the cochlea.
To better understand the role of RWM in normal, diseased, and implanted ears, the finite element (FE) models of the human ear, including the middle ear cavity, RWM, and cochlea, in addition to the ossicles and tympanic membrane, have been reported by Bohke and Arnold [15], Gan et al. [16], and Zhang and Gan [17]. However, the mechanical properties of RWM were assumed in these FE models because there were no mechanical properties of RWM available in the literature. Bohnke and Arnold used 9.8 MPa as Young’s modulus of RWM, Gan et al. used 0.35 MPa, and Zhang and Gan used 0.7 MPa for RWM. Noticeable differences of the RWM elastic modulus were observed among these studies. The accurate measurement on the mechanical properties of RWM is needed to improve the FE modeling analysis of the human ear. As human RWM works under auditory frequency range, the dynamic properties or complex modulus in the frequency domain has more value than the static elastic modulus.
In this paper, we report a novel experimental setup to measure dynamic properties of human RWM using acoustic driving and laser Doppler vibrometer (LDV). LDV is commonly used to measure vibrations of the tympanic membrane (TM) and stapes footplate and determine the transfer function of the middle ear [18, 19]. However, LDV has not been directly used to measure mechanical properties of the ear tissue until the recent study on human TM by Zhang and Gan [20]. They employed the mechanical testing system and LDV to measure vibration of the TM sample in response to acoustic pressure over the frequency range of 200–8000 Hz. Dynamic properties of the TM were finally determined through the FE model with acoustic-structure coupled analysis. Following the similar approach, we investigated the dynamic properties of human RWM and report the results here. The generalized standard linear viscoelastic solid model was used for RWM, and the dynamic properties of RWM were derived by the inverse-problem solving method. The complex modulus over the auditory frequency range provides new knowledge and needed data for the field of middle ear and cochlea mechanics.
METHODS
I. RWM specimen preparation
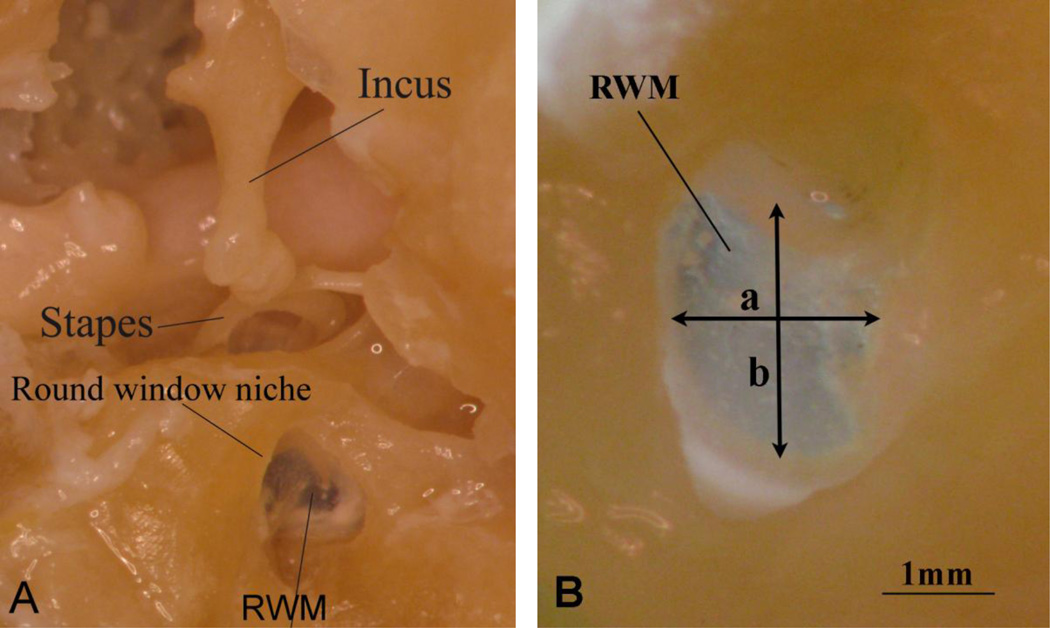
Eight RWM samples from fresh human cadaver temporal bones (three left and five right) obtained through the Willed Body Program at the University of Oklahoma Health Sciences Center were used for this study. All donors had no history of ear diseases associated with the RWM and the average age of the donors was 70 (ranging from 59 to 82, 5 males and 3 females). To maintain soft tissue compliance and hydration within five days before the experiment, the bones were immersed in a 0.9% saline solution mixed with providine (i.e., 15% amount of providine in saline solution) at 5 °C until use. The temporal bone was cut into a block (2×2×2 cm3) containing the middle ear cavity and cochlea. The middle ear cavity was then opened and the TM with malleus attached was carefully removed under microscope (Olympus SZX12). Incus and stapes remained intact in the specimen block, and the round window niche was identified as well as the RWM (Fig. 1A). The cochlea was then removed and RWM was exposed from both the middle ear and cochlear sides. The specimen was examined under microscope to verify that the RWM was not damaged during the preparation. Subsequently, we place microbeads (30 µm in diameter, Mo-Sci Corp, Rolla, MO) onto the center of the cochlear side of RWM as the laser reflecting target. The mass of each bead is about 3.96×10⁻⁵ mg. Such a small mass should not affect the measurement. Figure 1B shows a RWM specimen image obtained by a CCD camera in this study. The RWM was in an elliptical shape with the short axis (a) and long axis (b). Table 1 lists the dimensions of (a) and (b) measured from each specimen using the image analysis tools (Adobe Photoshop 7.0) with the average long axis of 2.08 mm and short axis of 1.81 mm.
Figure 1.
(A) The RWM specimen with the incus and stapes harvested from a human temporal bone. This picture shows the relative location of the RWM to the incus, stapes and round window niche. (B) Enlarged RWM specimen image with 1mm reference bas. (a) is the short axis of RWM, and (b) is the long axis of RWM.
Table 1.
The dimensions, resonance frequency fn and vibration amplification ratio R of RWM specimens.
| RWM Specimen |
RWM-1 | RWM-2 | RWM-3 | RWM-4 | RWM-5 | RWM-6 | RWM-7 | RWM-8 | Mean±S.D |
|---|---|---|---|---|---|---|---|---|---|
| Short axis a (mm) | 1.92 | 1.78 | 1.88 | 1.68 | 1.74 | 1.82 | 1.86 | 1.76 | 1.81±0.08 |
| Long axis b (mm) | 2.18 | 2.06 | 2.08 | 1.88 | 2.00 | 2.06 | 2.12 | 1.98 | 2.05±0.09 |
| fn (Hz) | 1500 | 1665 | 1888 | 2132 | 1892 | 1886 | 1687 | 1896 | 1818±193 |
| R | 4.08 | 2.98 | 3.51 | 5.66 | 3.81 | 2.88 | 3.18 | 3.37 | 3.68±0.89 |
II. Experimental setup
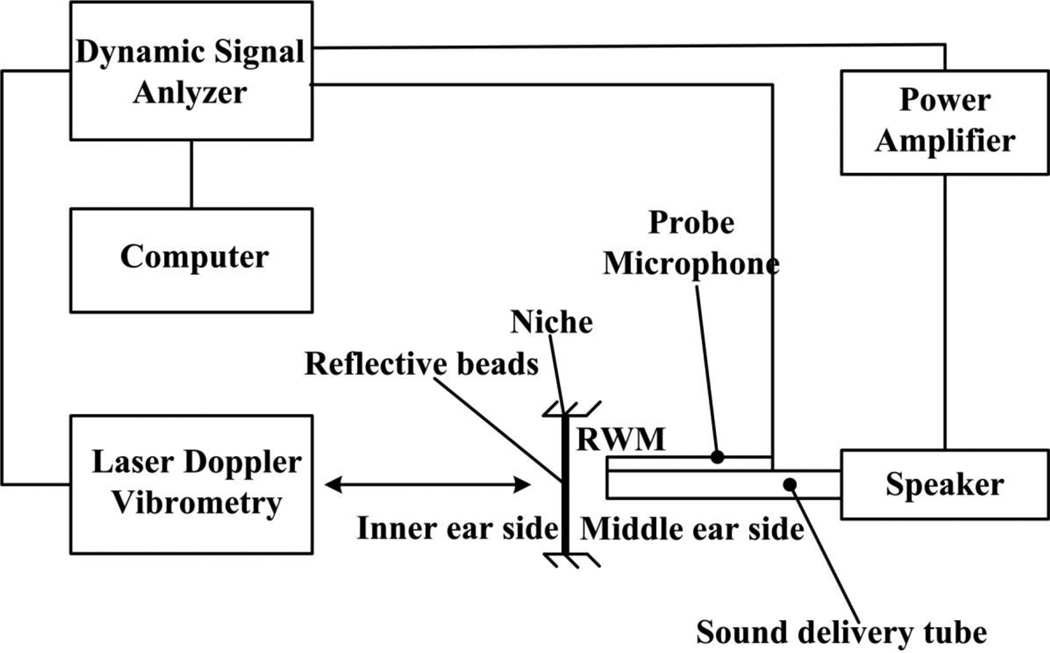
A laser Doppler vibrometer (HLV-1000, Polytech PI, Tustin, CA) was used to measure the vibration of the RWM induced by acoustic driving, a technique recently developed in our lab to determine dynamic properties of the human TM [20]. Figure 2 is the schematic diagram of the experimental setup. Briefly, the RWM specimen with the bony wall was fixed in a micro-manupulator and placed on a vibration isolation table. 80 dB SPL pure tones across the frequency range of 200–8000 Hz were delivered to the middle ear side of the RWM by a sound delivery tube (inner diameter 1 mm) connected to the speaker. The sound signals were generated by the dynamic signal analyzer (DSA, HP 35670A, CA) and amplified by the power amplifier (B & K 2718, Norcross, GA). The distance between the tube end and the surface of RWM was set at 1 mm. A probe microphone (ER-7C, Etymotic Research, IL) attached to the sound delivery tube was used for monitoring the input sound pressure level. Because the round window niche formed a semi-closed chamber for sound approaching to the RWM and the distance between the sound delivery tube end and the RWM was small, the sound pressure was reasonably considered as evenly distributed onto the RWM surface. The laser beam was focused on the microbeads, and the vibration at the center of RWM was acquired by DSA and recorded on a computer for further analysis. The vibration amplitude of the RWM was directly calculated from the voltage output of the laser vibrometer velocity decoder.
Figure 2.
The schematic of the experiment setup for the dynamic test on the RWM specimen. Sound pressure is delivered onto the center of the RWM specimen and monitored by a probe microphone from a speaker which is connected to a power amplifier and a dynamic signal analyzer (DSA). The specimen vibration is measured by laser Doppler Vibrometry (LDV) and recorded in a computer.
It is well known that the stabilized mechanical state of biological soft tissue is only reached after preconditioning in which the loading-unloading process was repeated usually for 3–5 cycles prior to the mechanical test [21]. Because of the extremely small size and fixed bony boundary of the RWM specimen, it was impossible to carry out a standard preconditioning procedure in a mechanical testing system. Harmonic 80 dB SPL sound stimuli were actually applied to the sample during each measurement and could serve as preconditioning. To doubly ensure the preconditioning and stabilization of the mechanical properties of RWM samples, cyclic hydraulic pressure was loaded and unloaded onto the specimen surface by using saline solution in a 1 cc syringe. The peak pressure was estimated around 10 Pa. The movement of RWM was observed under a surgical microscope. This process was repeated for 5 cycles to reach the stabilized state for the specimen. After preconditioning, an 80 dB SPL acoustic load across 200–8000 Hz was applied on the specimen, and the vibration was recorded. Note that the RWM specimen was maintained in moist conditions by spraying saline solution onto the middle ear side surface.
III. Finite element modeling Analysis
Dynamic tests of the RWM specimens were simulated as finite element (FE) models in ANSYS (ANSYS Inc, Canonsburg, PA). The FE model-based inverse-problem solving method was used to determine the dynamic properties of RWM. The FE model analysis was also used to estimate the effects of specimen geometry and experimental conditions on the results of the RWM dynamic property measurement.
III-A Building the FE model of dynamic test
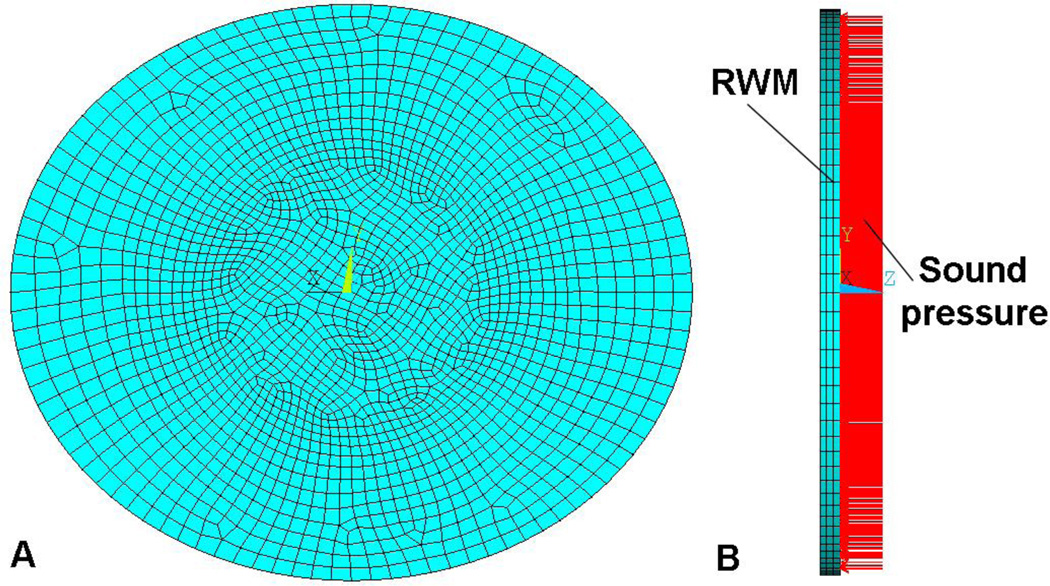
RWM in a normal ear is a thin, semitransparent and nearly circular membrane with a diameter of about 1.8 mm. The average thickness of a normal adult RWM was reported as 70 µm by Goycoolea et al [4] and Sahni et al. [6]. The smallest thickness of 56 µm at the RWM center was reported by Nomura [2]. In this study, each RWM specimen was modeled as an elliptical membrane with uniform thickness of 70 µm. The short axis a and long axis b were based on our real measurements listed in Table 1. Eight FE models of RWM samples were built, and Fig. 3A shows the plane view of one RWM model while Fig. 3B shows the transverse view with sound pressure applied on the middle ear side of the RWM. The reflective microbeads attached on RWM for laser measurement were not simulated in FE model. The beads should not affect the RWM vibration due to the small size and mass (3.96×10⁻⁵ mg per bead, estimated as 0.0163% of the average mass of RWM specimen). The model was meshed by 5892 hexahedral elements (type Solid 185), and convergence analysis showed this element number was adequate to reach accurate results. Density of the RWM was assumed as 1200 kg/m3, the same as that of TM [20]. 80 dB SPL across the frequency range of 200–8000 Hz was applied onto the medial side of the RWM, similar to the experiment. The edge of the RWM was set as fully clamped without free displacement based on the observation on histology sections in the literature [22, 23]. The RWM was considered as an isotropic linear viscoelastic material, and material properties are described in the next section.
Figure 3.
The FE model of the dynamic experiment on the RWM specimen (RWM-1). (A) The plane view of the RWM model from the middle ear side. The edge was fully clamped. (B) The side view of the RWM model with sound pressure applied onto the RWM from cochlear side.
III-B Constitutive model of RWM specimen
Biological soft tissues usually show viscoelastic properties, and their dynamic properties are time or frequency dependant [21]. Standard linear solid model [24] was used to describe the viscoelastic behavior of RWM. The relaxation modulus of RWM can be represented as:
| (1) |
where E0 is the relaxed elastic modulus at time t = ∞, (E0 + E1) is the initial elastic modulus at time t =0, and τ1 is the relaxation time. For harmonic analysis, the complex modulus E* in the frequency domain is
| (2) |
where E'(ω) is the storage modulus, E"(ω) is the loss modulus, ω is the angular frequency, and E'(ω) and E"(ω) can be expressed as:
| (3) |
| (4) |
| (5) |
where δ is the phase angle of the complex modulus, and η(ω) is the loss factor (defined as the ratio of loss modulus to the storage modulus). The frequency-dependent storage modulus E'(ω) and loss factor η (ω) are applied into the FE model as the material properties of the RWM.
III-C. Vibration analysis
Classic vibration theory of the thin membrane was used to analyze the motion of the RWM, similar to that used in our previous study on TM [20]. Forced vibration of the RWM induced by acoustic load or input sound pressure is governed by:
| (6) |
where E* is the complex modulus which can be expressed as a real part and an imaginary part, ∇ is the Laplacian operator, w is the transverse displacement or flexibility, m̄ is the mass per unit area, P is the pressure applied onto the RWM, h is the thickness of RWM, and α is a coefficient related to the RWM dimension. For harmonic vibration, sound pressure P and displacement w can be expressed in a cylindered coordinate system as
| (7) |
where r and φ are the radial and angular coordinates, respectively, W(r) and Φ(φ) must satisfy the fixed boundary condition of the RWM, and δ is the phase angle between the pressure and displacement. Substitute Eqs. (2–4) and (7) into Eq. (6), and the problem can be converted into a Bessel-type differential equation. Using Bessel functions, the first order (1,0) resonance frequency ωn has an expression of
| (8) |
where β is a coefficient related to the RWM dimension and Poisson’s ratio. Eq. (8) shows that the first order resonance frequency of the RWM ωn is proportional to the square root of its storage modulus E'. This provides the theoretical proof that the mechanical properties of the RWM can be determined by measuring the vibration resonance.
Under the first mode, the central (when r=0) displacement amplitude of the RWM, w0 = w (0, φ, t), resolved from Eq. (6) can be expressed as
| (9) |
When ω = 0(static deformation state),
| (10) |
When ω = ωn (resonance),
| (11) |
Displacement amplification ratio R defined as the displacement at resonance frequency over the displacement at static state is then expressed as:
| (12) |
Equations (8), (10), and (12) show that the resonance frequency ωn, displacement amplitude at static state (approximately using the amplitude at 200 Hz) (0) w0, and displacement amplification ratio R are all related to frequency-dependent storage modulus E' and the loss factor η of the RWM, and finally determined by the three parameters, E0, E1, and τ1 (Eqs. 3–5). However, it was still very difficult to derive a theoretical solution. Thus, the FE modeling and inverse-problem solving method were used to determine the parameters (E0, E1, and τ1) and the complex modulus E*.
III-D Inverse-problem solving method
The inverse-problem solving approach was used to determine three parameters, E0, E1, and τ1, and finally to obtain the complex modulus of the RWM. The FE model of each RWM sample was used to verify these parameters as well as the complex modulus by comparing the FE model-derived displacement-frequency curve with the experimental measurement curve. A brief description of the optimization process includes four steps: 1) the initial values of 1.0 MPa, 0.8 MPa and 30 µs were selected for E0, E1, and τ1, respectively; 2) The storage modulus E'(ω) calculated by Eq. (3) and loss factor η(ω) by Eq. (5) were input into the FE model; 3) Harmonic analysis of the FE model was then conducted from 200 to 8000 Hz with an interval of 50 Hz. Vibrations of the central node of the RWM induced by sound pressure of 80 dB SPL were calculated from the FE model; 4) The model-derived displacement-frequency curve was compared with the experimental curve for each sample. The correlation coefficient between the two sets of data was calculated. If the coefficient met the set value, the process was ended and the parameters of E0, E1, and τ1 were determined. If the correlation coefficient did not meet the set value, E0, E1, and τ1 were adjusted based on Eqs. (3–5), (8), (10), and (12), and the iteration process was repeated from step 2). Through this process, the values of E0, E1, and τ1 were optimized and determined. Finally, E0, E1, and τ1 were substituted into Eqs. (3–5) to obtain the complex modulus and loss factor of the RWM as functions of frequency.
RESULTS
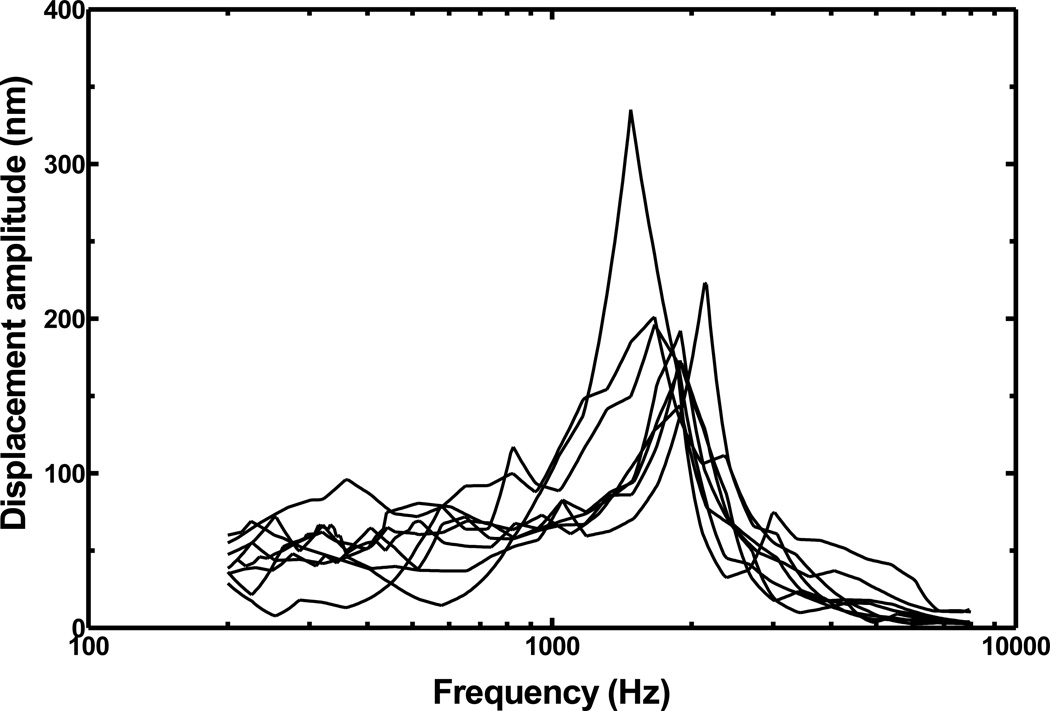
Figure 4 shows the displacement amplitude-frequency curves of eight RWM specimens recorded from experimental measurements. Each specimen has a prominent displacement peak between 1500 and 2100 Hz. The displacement at low frequency (below 500 Hz) has a range between 34 and 68 nm. The resonance frequency fn = ωn / 2π and amplification ratio R of each RWM specimen are listed in Table 1. The mean resonance frequency was 1818 ±193 Hz. The amplification ratio R was ranged between 2.88 and 5.66 with a mean value of 3.68±0.89.
Figure 4.
The vibration amplitude-frequency curves measured from the dynamic experiments on eight RWM specimens over the frequency range of 200–8000 Hz under 80 dB SPL.
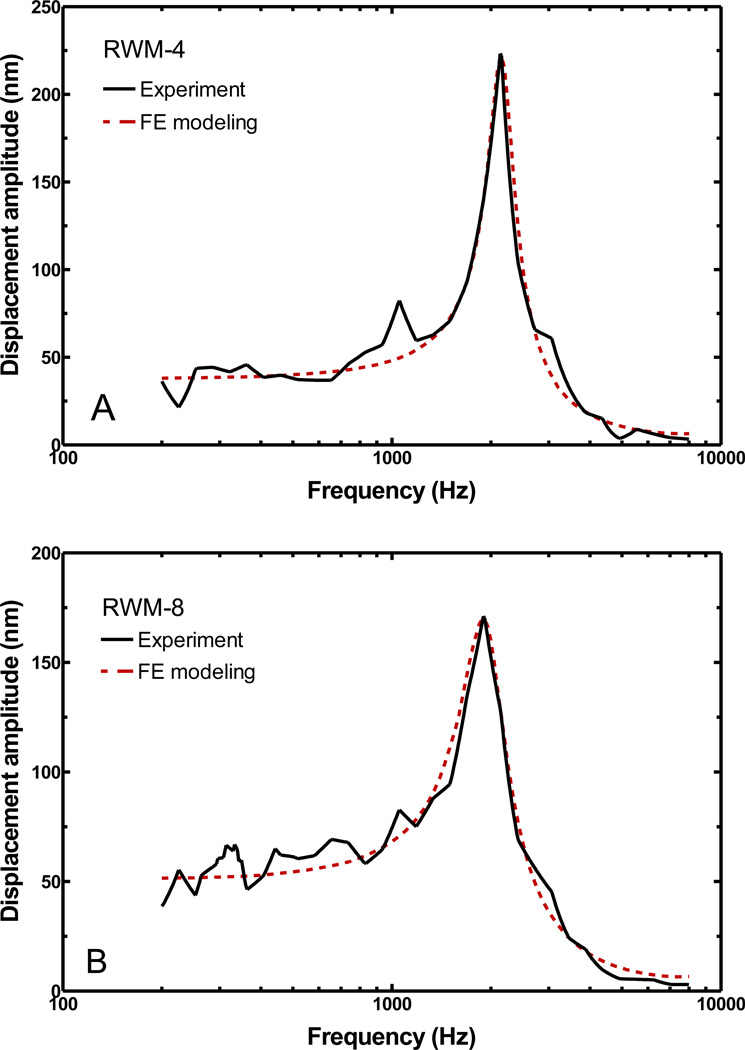
FE models were created to simulate the dynamic experiments of RWM specimens. As an example, Fig. 5 shows the results from two specimens: the vibration amplitude-frequency curves derived from the FE modeling (dash lines) and the experimental measurements (solid lines). Figure 5A was obtained from specimen RWM-4 with a resonance frequency of 2132 Hz from experiment and 2150 Hz from FE model. Figure 5B was obtained from specimen RWM-8 with a resonance frequency of 1896 Hz from experiment and 1900 Hz from FE model. In general, the FE modeling results agreed well with the experimental data over the entire frequency range, particularly near the resonance frequency. Some very small peaks at a lower frequency (for example, at 1 kHz of RWM-4) were not considered as the primary resonance peak. The curves from the FE model were obtained under ideal conditions and had no such artificial peaks. The potential resources of these peaks may come from the sound distortion or the experimental setup.
Figure 5.
The FE modeling results (dash line) obtained from two RWM models in comparison with the corresponding experimental curves (solid line). (A) Specimen RWM-4; (B) Specimen RWM-8. The sound pressure was set at 80 dB SPL.
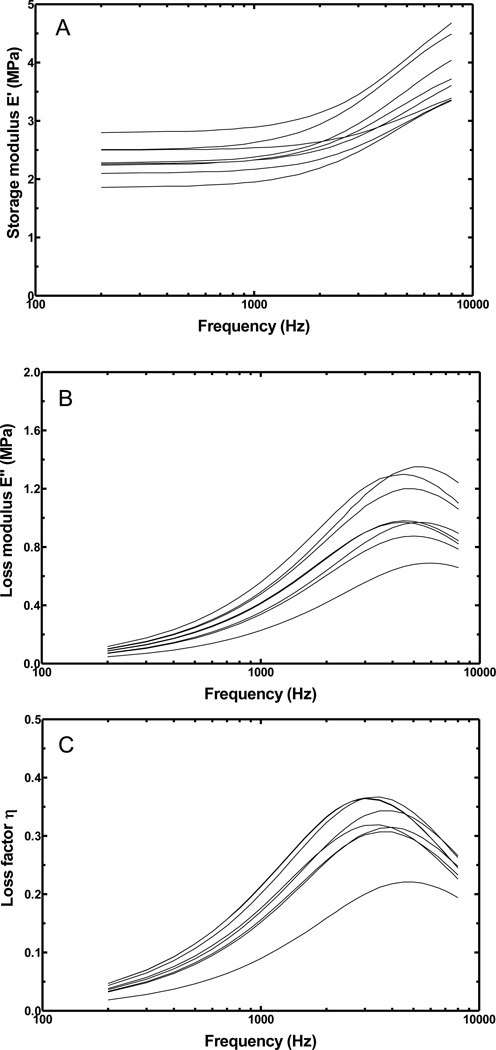
Three parameters E0, E1, and τ1 for each RWM specimen obtained through the inverse-problem solving with the FE model are listed in Table 2. The value of E0 ranged from 1.86 to 2.80 MPa, E1 ranged from 1.38 to 2.70 MPa, while τ1 ranged from 27 to 36 µs. There are some differences between the specimens for each parameter, which may be caused by individual variations between RWM specimens (physiological conditions, geometric dimensions) and the variations between experimental setups. Based on these parameters, the storage modulus E', loss modulus E", and loss factor η of all eight specimens were calculated and displayed in Fig. 6 across the frequency range of 200 to 8000 Hz. Figure 6A shows that the storage modulus increased with frequency for all specimens. The largest storage modulus values were 2.80 MPa at 200 Hz, and 4.68 MPa at 8000 Hz (RWM-3), and the smallest storage modulus values were 1.86 MPa at 200 Hz, and 3.35 MPa at 8000 Hz (RWM-2). As shown in Fig. 6B, the loss modulus increased with the increase of frequency and reached its maximum values around 4500–6000 Hz before decreasing. The largest loss modulus was 0.117 MPa at 200 Hz (RWM-6), and 1.24 MPa at 8000 Hz (RWM-3). The smallest loss modulus was 0.047 MPa at 200 Hz and 0.659 MPa at 8000 Hz (RWM-4). Figure 6C shows the loss factor obtained from the eight specimens. The change of the loss factor with frequency was similar to that of the loss modulus: increasing rapidly at frequencies below 4000 Hz, and then reaching the maximum values at around 4500–6000 Hz.
Table 2.
The viscoelastic parameters of RWM specimens determined from FE modeling analysis using inverse-problem solving method.
| RWM Specimen |
E0 (MPa) |
E1 (MPa) |
τ1 (µs) |
|---|---|---|---|
| RWM-1 | 2.11 | 1.75 | 32 |
| RWM-2 | 1.86 | 1.94 | 36 |
| RWM -3 | 2.80 | 2.72 | 30 |
| RWM -4 | 2.50 | 1.38 | 27 |
| RWM -5 | 2.26 | 1.94 | 30 |
| RWM -6 | 2.51 | 2.63 | 36 |
| RWM -7 | 2.28 | 2.40 | 33 |
| RWM -8 | 2.24 | 1.96 | 35 |
Figure 6.
The complex modulus determined from the FE modeling analysis for eight RWM specimens over the frequency range of 200–8000 Hz. (A) Storage modulus E'; (B) Loss modulus E"; (C) Loss factor η.
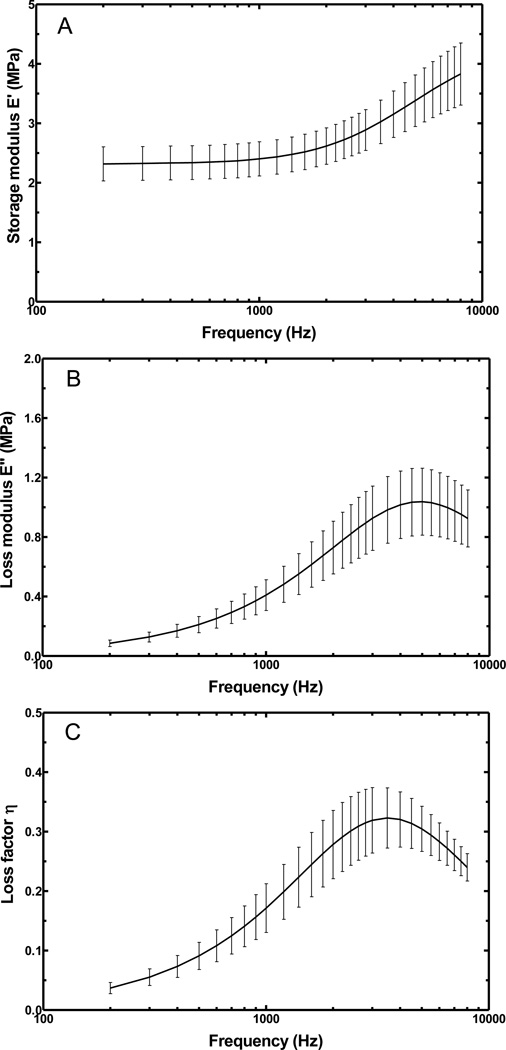
Mean values of the complex modulus and the loss factor with S.D. obtained from the eight specimens are shown in Fig. 7. Figure 7A shows the mean storage modulus was 2.32 ±0.29 MPa at 200 Hz and 3.83±0.52 MPa at 8000 Hz. The storage modulus increased slowly below 1000 Hz and increased rapidly over 1000 Hz. Figure 7B shows that the mean loss modulus was 0.085 ±0.022 MPa at 200 Hz and 0.925±0.192 MPa at 8000 Hz. The maximum loss modulus was 1.038±0.225 MPa at 5000 Hz. The loss modulus is much smaller than the storage modulus. As shown in Fig. 7C, the mean loss factor was 0.037 ±0.009 at 200 Hz and 0.240±0.023 at 8000 Hz. The maximum loss factor was 0.323±0.051 at 3500 Hz.
Figure 7.
The mean complex modulus of the eight RWM specimens with standard deviations (S.D.). (A) Storage modulus E'; (B) Loss modulus E"; (C) Loss factor η.
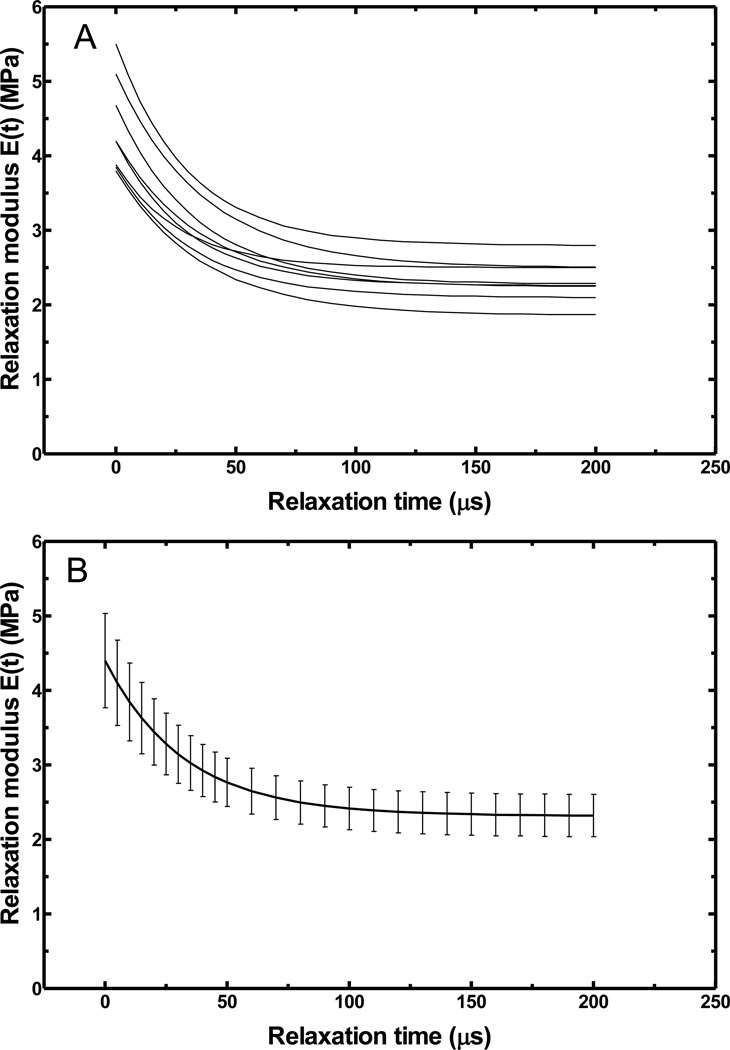
In addition to complex modulus in frequency domain, we used the parameters listed in Table 2 to calculate the relaxation modulus in time domain for RWM specimens using Eq. (1). Figure 8A shows the relaxation modulus of eight specimens. The initial modulus (at time t=0) ranged from 3.80 to 5.50 MPa, and the static modulus (at time t=∞) ranged from 1.86 to 2.80 MPa. As shown in this figure, RWM specimens reached the relaxation state at 200 µs. Figure 8B shows the mean relaxation modulus changing with time. The mean initial modulus was 4.40±0.63 MPa, and the mean static modulus was 2.32±0.29 MPa.
Figure 8.
The relaxation modulus in the time domain obtained from the complex modulus in frequency domain. (A) Individual relaxation modulus-relaxation time curves for the eight RWM specimens. (B) Mean relaxation modulus-relaxation time curve with S.D. for the eight RWM specimens.
DISCUSSION
I. Effect of specimen shape and thickness variation on the complex modulus
In this study, the RWM was simulated as a flat membrane structure in the FE model as the first step. However, the real human RWM has a slight convexity towards the cochlea [4, 5]. To estimate the effect of that assumption on results, a FE model with a curved surface was created based on specimen RWM-6. The dimensions of sample RWM-6 were close to the mean values of all specimens. A curvature was chosen as 0.1 mm−1 based on published image observations [22, 23]. The viscoelastic parameters E0, E1 and τ1 derived from the model with a curved surface were 2.31 MPa, 2.40 MPa, and 36 µs, respectively. These values are slightly smaller than that derived from the model with a flat surface (See Table 2). The assumption of a flat RWM did not affect the results significantly.
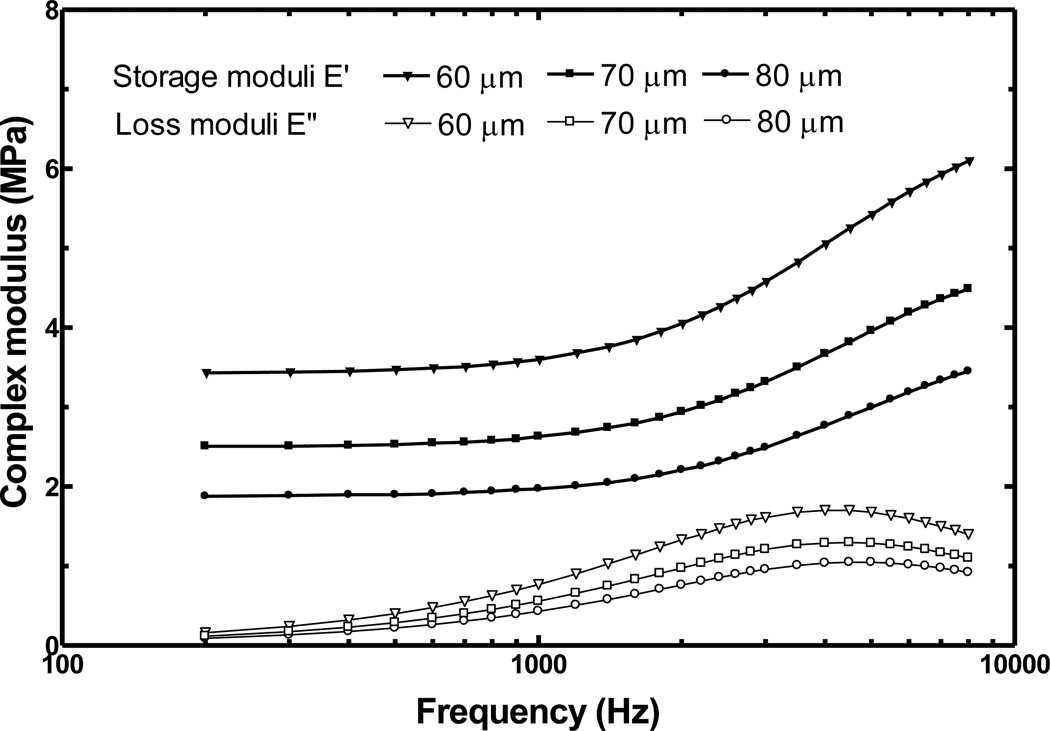
FE model of the RWM was created using the actual long axis and short axis measured from each specimen (Table 1). However, the thickness of 70 µm was used for all RWM specimens based on published data [4]. The real thickness of RWM specimen varies with the samples, which may affect the complex modulus derived from the FE model. To assess the effect of thickness variation on complex modulus of RWM, the FE models with different thicknesses were created based on specimen RWM-6. The thickness was changed from 70 µm (named as control) to 60 and 80 µm, and the other parameters were maintained as the same as the control (specimen RWM-6). The parameters E0, E1 and τ1 derived from the models with different thicknesses are listed in the first three rows of Table 3. The storage modulus and loss modulus from these models are shown in Fig. 9. These results show that the complex modulus values obtained from the model may change up to 38% compared with control results when RWM thickness changed 14% from the control value.
Table 3.
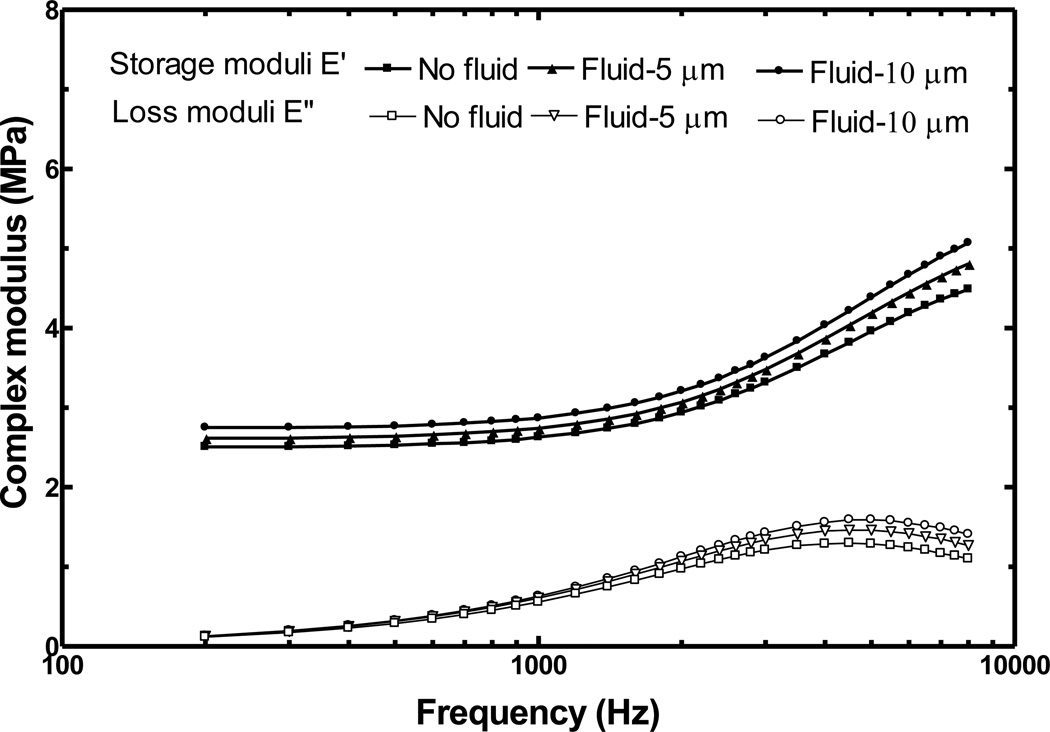
List of the viscoelastic parameters of a RWM specimen (RWM-6) determined from FE modeling analysis under various changes in specimen geometry, sound pressure distribution and moisture (fluid) level.
| RWM model |
E0 (MPa) |
E1 (MPa) |
τ1 (µs) |
|---|---|---|---|
| Control (RWM-6) | 2.51 | 2.63 | 36 |
| Thickness-60 | 3.42 | 3.41 | 38 |
| Thickness-80 | 1.88 | 2.11 | 34 |
| Uneven acoustic load | 2.46 | 2.70 | 35 |
| Fluid-5 | 2.61 | 2.93 | 34.5 |
| Fluid-10 | 2.74 | 3.18 | 33 |
Figure 9.
The effect of the specimen thickness variations on the complex modulus determined from the FE modeling analysis for the specimen RWM-6.
Human RWM is thicker at the edge and thinner toward the center [4, 22, and 23]. The uneven thickness distribution may also affect the resonance frequency and vibration mode of the RWM. To estimate this effect on the complex modulus, a FE model with thickness of 80 µm at the edge and 60 µm at the center was created based on specimen RWM-6. The parameters, E0, E1 and τ1 were determined as 2.25 MPa, 2.34 MPa, and 35 µs, respectively. The storage modulus was about 10% smaller than that derived from the FE model with uniform thickness of 70 µm.
II. Effect of experimental conditions on the complex modulus
In all experiments, the sound pressure (80 dB SPL) was delivered at 1 mm away from the RWM through the tube with inner diameter of 1 mm. In modeling analysis, we assumed that the sound pressure was uniformly applied on the RWM surface because of the round window niche making a semi-closed chamber around the RWM. To estimate the effect of uneven sound pressure applied on the specimen for calculation results of the complex modulus, we modified the distribution of sound pressure on RWM with pressure at the edge lower than that at the center. The sound pressure distribution at 1 mm away from the sound source was calculated following the procedure reported by Zhang and Gan [20].
Briefly, an open air field with diameter of 0.2 m was built surrounding a circular plate with a diameter of 2 mm (simulating the RWM) and the sound delivery tube had diameter of 1 mm. The acoustic-structure interface was defined on the boundary between the air and the plate. The pressure distribution on the plate was first obtained through the acoustic-structure coupled analysis and then applied into the FE model of the RWM. The sound pressure at the center of a circular area (1 mm diameter) was 80 dB SPL and gradually reduced to 75 dB at the edge. The calculated complex modulus parameters E0, E1 and τ1 of specimen RWM-6 from the FE model were 2.46 MPa, 2.70 MPa and 35 µs, respectively, as listed in Table 3 (fourth row). These values are very close to those determined from the control model listed in the first row of Table 3. Thus, the acoustic load variation caused by the sound delivering tube may not have a noticeable effect on the results.
Another variation of the experiment conditions is the moisture content of the specimen during the experiment. It was reported that the moisture or hydration level may affect mechanical properties of the soft tissues and fibrous composites [25–27]. The low moisture content or dehydration makes the tissue stiffer. The human RWM is a soft tissue with collagen fibers as the main supporting structure. The mechanical properties of the RWM specimen are naturally affected by moisture content. To maintain the specimen in an ideal physiological condition, a saline solution was sprayed onto the specimen during the experiment. The amounts of saline and measurement time were controlled to ensure the results being consistent. In this study, the dynamic measurement was started 30 seconds after the saline was added onto the specimen. Each run of the measurement was finished within 6 seconds for frequency sweeping between 200 to 8000 Hz. The moisture content of the RWM specimen is not anticipated to have noticeable changes in such a short period of time.
Another potential effect of the moisture content on the measurement is the additional mass probably added to the specimen since the resonance frequency is sensitive to mass. To assess the effect of fluid mass on measurement, a water layer with thickness of 5 µm or 10 µm was added to the FE model in the middle ear side of the RWM. The complex modulus parameters E0, E1 and τ1 of specimen RWM-6 were determined and listed in the last two rows of Table 3. Figure 10 shows the storage modulus and loss modulus variations in response to water layer thickness or moisture content. These results show that additional water layer thickness affected the storage modulus up to 13% and the loss modulus up to 28%. The water layer affected the loss modulus more than the storage modulus and affected the storage modulus at higher frequencies more than that at lower frequencies. The results suggest that, if there was additional fluid on the RWM surface and it was not taken into account in FE model, the complex modulus obtained by the inverse-problem solving method should be smaller than the real values. In this study, the moisture content of the RWM specimens were maintained by spraying of saline solution on the specimen, and the specimen was checked under the microscope before measurement to verify there was not much additional fluid on specimen surface. Although the fluid layer thickness could not be measured precisely, we estimated that the fluid layer in this study was less than 10 µm and that this thickness would not affect the RWM storage modulus measurement more than 13%.
Figure 10.
The complex modulus E' and E" determined from the FE modeling analysis for specimen RWM-6 with different fluid layers added.
In this study, the displacement was obtained from the center point of the RWM sample in the experimental measurement. The information from the displacement at the center of the membrane is enough to obtain the mechanical properties of the RWM with the help of the FE model. However, the complex vibration modes do exist in the RWM sample as well as in the FE model. We are unable to measure the modes of the RWM in this study, but the FE model can be used to analyze the complex patterns of the RWM. In this study, the primary displacement peak presented at (0, 0) mode (at the lowest resonance frequency) of the RWM. The displacement curves were not used to characterize these complex mode patterns, which is far beyond the scope of this study.
III. Contribution of this study and future work
Dynamic properties of the human RWM over the auditory frequency range were measured for the first time in this study. The results reported here added new knowledge to the biomechanics of human ear and can be applied into the FE modeling of middle ear transfer function as well as cochlea mechanics. In published FE models, a relatively large range of static elastic moduli from 0.35 to 9.8 MPa were assigned to RWM [15–17]. In this study, the mean static modulus was measured as 2.32 MPa, which was in the range chosen by these published FE models. Moreover, the stapes footplate displacement at high frequency (above 5000 Hz) derived from Gan et al.’s model [16] is lower than the experimental value measured in the human temporal bones. Application of the frequency-dependent modulus obtained in this study into the FE model of human ear may enhance the model accuracy for prediction of middle ear function.
Future studies on the mechanical properties of RWM and their applications may be expanded in three directions:
Dynamic properties of the RWM in pathological ears, such as otitis media. Otitis media may significantly change the thickness [6] and permeability [7] of the RWM. The morphological variations may also change the mechanical properties of the RWM. To understand the relationship between the morphology of the RWM and its physical and mechanical properties in diseased ears will assist clinical diagnosis and drug treatment of otitis media induced mixed hearing loss.
Application of dynamic properties of the RWM into FE model of the human ear. As one of two windows connecting the middle ear and cochlea, RWM plays an important role in the interaction between the cochlea and middle ear, particularly when fluid is filled in the middle ear cavity (i.e., otitis media).
Coupling between RWM and the implantable transducer for design and function evaluation of implantable hearing devices. The FE model of the human ear will be used to optimize the coupling location and method based on mechanical properties of the RWM.
CONCLUSION
In this study, an experimental setup to measure the dynamic properties of the human RWM specimens was developed. Vibrations of the RWM in response to acoustic driving were measured by laser Doppler vibrometry over the auditory frequency range of 200–8000 Hz. The dynamic experiments on RWM specimens were simulated in FE models, and generally good agreements between the experimental measurements and FE modeling were observed in all RWM specimens. Dynamic properties of the RWM were derived by the inverse-problem solving method and presented as the complex modulus in frequency-domain and relaxation modulus in time-domain. The mean value of the storage modulus of eight RWM specimens was 2.32 ±0.29 MPa at 200 Hz and 3.83±0.52 MPa at 8000 Hz, while the mean loss modulus was 0.085 ±0.022 MPa at 200 Hz and 0.925±0.192 MPa at 8000 Hz. The effects of the specimen thickness variation and experimental conditions, including the sound pressure distribution and the moisture of the specimen, on the complex modulus measurements were discussed using the FE modeling analysis. The dynamic properties of the RWM reported in this study provide new knowledge on the RWM and middle ear and cochlea mechanics.
ACKNOWLEDGEMENTS
The authors would like to thank the technical assistance on dynamic experiments from Don Nakmali at Hough Ear Institute, Oklahoma City. This work was supported by NIH R01DC006632 and R01DC011585 grants.
Footnotes
Publisher's Disclaimer: This is a PDF file of an unedited manuscript that has been accepted for publication. As a service to our customers we are providing this early version of the manuscript. The manuscript will undergo copyediting, typesetting, and review of the resulting proof before it is published in its final citable form. Please note that during the production process errors may be discovered which could affect the content, and all legal disclaimers that apply to the journal pertain.
Conflict of Interest
We declare no conflict interest with institutes, organizations, or companies relevant to the manuscript.
REFERENCES
- 1.Paparella MM, Schachern PA, Choo YB. The round window membrane: otological observations. Ann Otol Rhinol Laryngol. 1983;92(6 Pt 1):629–634. doi: 10.1177/000348948309200619. [DOI] [PubMed] [Google Scholar]
- 2.Nomura Y. Otological significance of round window membrane. Adv Otorhinolaryngol. 1984;33:1–162. [PubMed] [Google Scholar]
- 3.Hellstrom S, Eriksson PO, Yoon YJ, Johansson U. Interactions between the middle ear and the inner ear: Bacterial products. Ann N Y Acad Sci. 1997;830:110–119. doi: 10.1111/j.1749-6632.1997.tb51883.x. [DOI] [PubMed] [Google Scholar]
- 4.Goycoolea MV, Lundman L. Round window membrane. Structure function and permeability: a review. Microsc Res Tech. 1997;36(3):201–211. doi: 10.1002/(SICI)1097-0029(19970201)36:3<201::AID-JEMT8>3.0.CO;2-R. [DOI] [PubMed] [Google Scholar]
- 5.Carpenter AM, Muchow D, Goycoolea MV. Ultrastructural studies of the human round window membrane. Arch. Otolaryngol. Head Neck Surg. 1989;115:585–590. doi: 10.1001/archotol.1989.01860290043012. [DOI] [PubMed] [Google Scholar]
- 6.Sahni RS, Paparella MM, Schachern PA, Goycoolea MV, Le CT. Thickness of the human round window membrane in different forms of otitis media. Arch Otolaryngol Head Neck Surg. 1987;113(6):630–634. doi: 10.1001/archotol.1987.01860060056015. [DOI] [PubMed] [Google Scholar]
- 7.Ikeda K, Morizono T. Changes of the permeability of round window membrane in otitis media. Archives of Otolaryngology - Head & Neck Surgery. 1988;114(8):895–897. doi: 10.1001/archotol.1988.01860200079023. [DOI] [PubMed] [Google Scholar]
- 8.Schachern P, Tsuprun V, Cureoglu S, Ferrieri P, Briles D, Paparella M, Juhn S. The round window membrane in otitis media: effect of pneumococcal proteins. Arch Otolaryngol Head Neck Surg. 2008;134(6):658–662. doi: 10.1001/archotol.134.6.658. [DOI] [PubMed] [Google Scholar]
- 9.Colletti V, Carner M, Colletti L. Round window stimulation with the floating mass transducer: A new approach for surgical failures of mixed hearing losses. Proceedings of the XVIII IFOS World Congress Rome. 2005 [Google Scholar]
- 10.Colletti V, Soli SD, Carner M. Treatment of mixed hearing losses via implantation of a vibratory transducer on the round window. Int J Audiol. 2006;45(10):600–608. doi: 10.1080/14992020600840903. [DOI] [PubMed] [Google Scholar]
- 11.Tringali S, Pergola N, Berger P, Dubreuil C. Fully implantable hearing device with transducer on the round window as a treatment of mixed hearing loss. Auris Nasus Larynx. 2009;36(3):353–358. doi: 10.1016/j.anl.2008.09.003. [DOI] [PubMed] [Google Scholar]
- 12.Beltrame AM, Martini A, Prosser S, Giarbini N, Streitberger C. Coupling the Vibrant Soundbridge to cochlea round window: auditory results in patients with mixed hearing loss. Otol Neurotol. 2009;30:194–201. doi: 10.1097/mao.0b013e318180a495. [DOI] [PubMed] [Google Scholar]
- 13.Koka K, Holland NJ, Lupo JE, Jenkins HA, Tollin DJ. Electrocochleographic and mechanical assessment of round window stimulation with an active middle ear prosthesis. Hear Res. 2010;263(1–2):128–137. doi: 10.1016/j.heares.2009.08.009. [DOI] [PubMed] [Google Scholar]
- 14.Arnold A, Stieger C, Candreia C, Pfiffner F, Kompis M. Factors improving the vibration transfer of the floating mass transducer at the round window. Otol Neurotol. 2010;31(1):122–128. doi: 10.1097/MAO.0b013e3181c34ee0. [DOI] [PubMed] [Google Scholar]
- 15.Bohnke F, Arnold W. 3D-finite element model of the human cochlea including fluid-structure couplings. ORL. 1999;61:305–310. doi: 10.1159/000027688. [DOI] [PubMed] [Google Scholar]
- 16.Gan RZ, Peeves BP, Wang X. Modeling of sound transmission from ear canal to cochlea. Ann. Biomed. Eng. 2007;35:2180–2195. doi: 10.1007/s10439-007-9366-y. [DOI] [PubMed] [Google Scholar]
- 17.Zhang X, Gan RZ. A Comprehensive Model of Human Ear for Analysis of Implantable Hearing Devices. IEEE Trans Biomed Eng. 2011 Jun 23; doi: 10.1109/TBME.2011.2159714. [Epub ahead of print]. [DOI] [PubMed] [Google Scholar]
- 18.Gan RZ, Dai C, Wood MW. Laser interferometry measurements of middle ear fluid and pressure effects on sound transmission. J. Acoust. Soc. Am. 2006;120:3799–3810. doi: 10.1121/1.2372454. [DOI] [PubMed] [Google Scholar]
- 19.Dai C, Wood MW, Gan RZ. Tympanometry and laser Doppler interferometry measurements on otitis media with effusion model in human temporal bones. Otol. Neurotol. 2007;28:551–558. doi: 10.1097/mao.0b013e318033f008. [DOI] [PubMed] [Google Scholar]
- 20.Zhang X, Gan RZ. Dynamic Properties of Human Tympanic Membrane - Experimental Measurement and Modeling Analysis. International Journal of Experimental and Computational Biomechanics. 2010;1(3):252–270. [Google Scholar]
- 21.Fung YC. Biomechanics: Mechanical Properties of living Tissue. New York: Springer; 1993. [Google Scholar]
- 22.To´th M, Alpa´r A, Patonay L, Ola´h I. Development and surgical anatomy of the round window niche. Ann. Anat. 2006;188:93–101. doi: 10.1016/j.aanat.2005.09.006. [DOI] [PubMed] [Google Scholar]
- 23.Li PM, Wang H, Northrop C, Merchant SN, Nadol JB. Anatomy of the Round Window and Hook Region of the Cochlea With Implications for Cochlear Implantation and Other Endocochlear Surgical Procedures. Otology & Neurotology. 2007;28:641–648. doi: 10.1097/mao.0b013e3180577949. [DOI] [PMC free article] [PubMed] [Google Scholar]
- 24.Machiraju C, Phan AV, Pearsall AW, Madanagopal S. Viscoelastic studies of human subscapularis tendon: relaxation test and a Wiechert model. Comput. Methods Programs Biomed. 2006;83:29–33. doi: 10.1016/j.cmpb.2006.05.004. [DOI] [PubMed] [Google Scholar]
- 25.Fraga AN, Alvarez VA, Vazquez A, de la Osa O. Relationship between Dynamic Mechanical Properties and Water Absorption of Unsaturated Polyester and Vinyl Ester Glass Fiber Composites. Journal of Composite Materials. 2003;37(17):1553–1574. [Google Scholar]
- 26.Nicolle S, Palierne JF. Dehydration effect on the mechanical behaviour of biological soft tissues: Observations on kidney tissues. Journal of the Mechanical Behavior of Biomedical Materials. 2010;3(8):630–635. doi: 10.1016/j.jmbbm.2010.07.010. [DOI] [PubMed] [Google Scholar]
- 27.Johnson M, Walter SL, Flinn BD, Mayer G. Influence of moisture on the mechanical behavior of a natural composite. Acta Biomater. 2010;6(6):2181–2188. doi: 10.1016/j.actbio.2009.12.006. [DOI] [PubMed] [Google Scholar]


