

SUMMARY
Firefly luciferase (FLuc) is frequently used as a reporter in high-throughput screening assays owing to the exceptional sensitivity, dynamic range, and rapid measurement that bioluminescence affords. However, interaction of small molecules with FLuc has, to some extent, confounded its use in chemical biology and drug discovery. To identify and characterize chemotypes interacting with FLuc, we determined potency values for 360,864 compounds, found in the NIH Molecular Libraries Small Molecule Repository, available in PubChem. FLuc inhibitory activity was observed for 12% of this library with discernible SAR. Characterization of 151 inhibitors demonstrated a variety of inhibition modes including FLuc-catalyzed formation of multisubstrate-adduct enzyme inhibitor complexes. As in some cell-based FLuc reporter assays compounds acting as FLuc inhibitors yield paradoxical luminescence increases, data on compounds acquired from FLuc-dependent assays requires careful analysis as described in this report.
Keywords: profiling, PubChem, luciferase, quantitative high-throughput screening, qHTS, firefly luciferase, reporter-gene assays, adenylate forming enzymes
INTRODUCTION
The reporter firefly luciferase from Photinus pyralis (FLuc) is widely used in molecular biology and small molecule high-throughput screening (HTS) assays (Fan and Wood, 2007). In fact, 20% of assays found in PubChem - the publically available small molecule screening database - utilize bioluminescence (Thorne et al., 2010). The FLuc enzyme catalyzes the oxidation of luciferin (D-LH2) to produce oxyluciferin and light through the intermediate formation of a LH2-adenylated adduct from ATP. Previous work has shown several classes of compounds found in chemical libraries act as inhibitors of this enzymatic reaction (Auld et al., 2008a; Auld et al., 2009b; Thorne et al., 2010). We have found that many inhibitors, such as the 3,5-diaryl oxadiazole class of inhibitors, although lacking obvious structural similarity to the D-LH2 substrate, still bind to the D-LH2-binding pocket within the FLuc active site, greatly complicating the interpretation of assay results (Auld et al., 2010; Auld et al., 2008a; Keiser et al., 2007). Further, in FLuc reporter gene assays (RGAs) these inhibitors can function within the cell to increase the half-life of ectopically expressed FLuc enzyme, leading to an increase in luciferase activity that can appear indistinguishable from reporter gene transcriptional activation (Auld et al., 2009a; Auld et al., 2008b; Thompson et al., 1991). This has prompted a reevaluation of compounds reported to mediate biological processes when the origins of compound activity are derived from luciferase-based cellular assays (Herbst et al., 2009; Lyssiotis et al., 2009; Sotoca et al., 2010). An accurate interpretation of PubChem data, or any data from luciferase assays used in small molecule screening, benefits from an understanding of the FLuc inhibition profile of the compound library.
The prevalence of luciferase inhibitors among active compounds identified from FLuc RGAs underscores the need for unambiguous strategies to detect compounds that directly affect the FLuc reporter. We determined IC50 values for the entire publically available MLSMR of >300K compounds using a FLuc assay that is sensitive to multiple modes of inhibition (MOI). Here we describe the chemotypes associated with FLuc inhibition, and, for a representative set of compounds, analyze and describe their MOI, as well as the activity, in prototypical FLuc RGAs. We also define general principles applicable to the behavior of FLuc inhibitors in cell-based assays and identify specific strategies to stringently discriminate compound activity resulting from reporter interferences from that of targeted biological effects.
RESULTS
Profiling statistics and library activity
To create a bioactivity profile of luciferase inhibitors, we screened approximately 360K compounds listed in the PubChem database at six concentrations using qHTS (Fig. S1a; PubChem AID:588342). A global view of library activity is gained by categorizing the CRCs obtained from qHTS into classes, such that class 1a CRCs exhibit full inhibition of enzyme activity, class 1b are partially inhibitory at the highest concentration tested, and classes 2a, 2b, and 3 have incomplete CRCs (Inglese et al., 2006; Shukla et al., 2009). In addition, the generation of IC50s for each compound allows us to enumerate and resolve SAR for active chemotypes. For our profiling effort we utilized a biochemical assay with purified FLuc in the presence of KM concentrations of substrates. This assay condition is sensitive to identifying competitive inhibitors that form an intracellular E•I complex in the absence of excess D-LH2 in FLuc cell-based assays. The biochemical assay thus differs from that used in our previous FLuc effort which employed [D-LH2] ≫ KM, a condition commonly used in cell-free assays (Auld et al., 2008a; Auld et al., 2009b).
We found that a total of 43,885 compounds (~12% of the library) inhibited FLuc, with a significant fraction of this activity (~30%) associated with potent and efficacious CRCs (e.g. class 1a, 1b, and 2a CRCs; Fig. S1b, c and Table 1). These high quality CRCs were used to identify scaffolds and SAR was further developed by considering related inactive or weakly active structures. Greater than 5,300 compounds had class 1a CRCs, 168 of which exhibited potencies <100 nM, with some having single-digit nM potencies. An additional 30,000 compounds showed weak inhibitory activity (CRC classes 2b and 3; Table 1). Retrospective analysis of the data at a single concentration yielded hit rates of 5 and 1.8% at 11 and 2.3 μM, respectively. While it is possible that some of the compounds that appear to inhibit FLuc could simply quench light, we believe this to be a relatively rare occurrence. Direct activation of the FLuc enzyme was observed for <20 compounds however this was not pursued in follow-up studies, as in each case the CRC was either low quality or low efficacy.
Table 1.
Distribution of Inhibition Activity
| Activity | Distribution | CRC Classification | ||||||
|---|---|---|---|---|---|---|---|---|
| 1a | 1b | unqualified | 2a | 2b | unqualified | 3 | ||
| Activation | #Samples Screened | 0 | 1 | 0 | 2 | 12 | 0 | 0 |
| Inhibition | #Samples Screened | 5,306 | 2,191 | 123 | 5,772 | 19,938 | 493 | 10,062 |
| Library (%) | 1.46 | 0.60 | 0.03 | 1.58 | 5.48 | 0.14 | 2.76 | |
Activators composed <0.004% of the activity. Unqualified, CRCs of lower quality in each of the class 1 or 2 CRC datasets using a <50% efficacy cut-off. The total # of inactive compounds was 320,205 (87.94%). Supported by Figure S1 and Table S2.
Chemotype analysis of actives
Compounds were clustered based on structural similarity to identify common chemotypes. Prominent clusters previously observed (Auld et al., 2008a) included benzothiazoles, benzoxazoles, benzimidazoles, and oxadiazoles were again identified here, however novel chemotypes which included hydrazines and benzoic acids, among others, were also found (Fig. 1, Fig. S2a). A hierarchal scaffold-tree based method was used to visualize activity among root chemical structures containing simple rings (Schuffenhauer et al., 2007). A representation of the potency distribution for compounds found among 132 root structures is shown in Figure 1a (see also Supplemental Information Table S2). The MCS analysis supported that thiazoles, imidazoles, and oxadiazoles are among the prevalent ring structures found in FLuc inhibitors (Fig. 1b i, iii, and xiii, respectively). The ring system analysis also scored pyridine (Fig. 1b, ii) - found in quinoline-containing compounds previously identified as FLuc inhibitors (Auld et al., 2008a) - with nearly the same frequency as thiazole, thus broadening this initial finding to simpler nitrogen-containing rings. The five member rings furan, thiophene, pyrazole, and pyrrole (Fig. 1b v, vii, iv, and vi) were nearly equally represented, with frequencies greater than either oxazoles, oxadiazoles, or thiadiazole rings (Fig. 1b, xi-xiv). Interestingly, many oxazole- or oxadiazole-containing compounds were limited to compounds in which these ring systems were flanked with at least one aryl substituent, most typically two aryl substituents, with the most potent compounds often containing simple aryl substitutions (e.g. methyl, methoxy, carboxy, and halogens). The ring structures pyrimidine, dihydro-dioxine and dioxole (Fig. 1b, viii, ix, x), integral to quinazoline, benzodioxine and piperonyl scaffolds, respectively, were also notable among inhibitors. A closer examination of some of these scaffold clusters is shown in Figure 1c, depicting highly potent compounds (compounds 1,3,5,7,9) alongside their weaker analogs (compounds 2,4,6,8,10). Readily apparent is that small, planar, linear structures are a feature of many potent compounds while angular (e.g., 6 and 10) and/or larger branched-type configurations (e.g., 2 and 8) show weaker activity. Notably, the ring-system analysis, when applied to a biochemical assay that used fluorescence detection, identified an entirely unique set of scaffolds demonstrating ring structure SAR consistent with fluorescent interference (Pubchem AID: 540253; Supplemental Fig. S2b) and suggesting that the SAR derived from the FLuc profiling effort is unique to this enzyme.
Figure 1. Scaffold analysis of FLuc inhibitors.
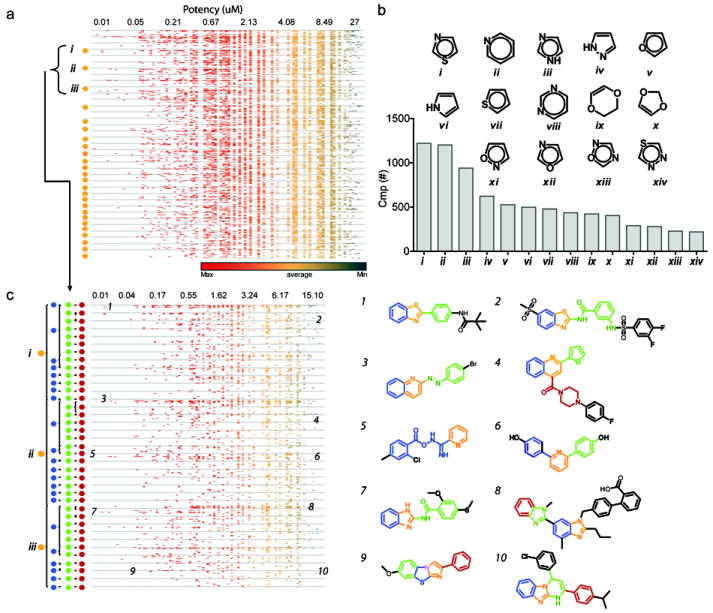
a) Primary root scaffold analysis and associated potency distribution for compounds associated with these scaffolds. The clustering was based on the high quality CRCs (classes 1a, 1b or 2a) with maximum inhibition values of >50%. Scaffolds at the bottom of the graph contain as little as five members while scaffolds at the top of the graph contain >1,000 members. b) Root scaffolds composed of heterocycles associated with >200 compounds. Representative scaffolds are shown, the most prominent of which were the thiazole (i), pyridine (ii, found in quinolines), and imidazole (iii) ring structures. A series of oxadiazoles (xiii) were also prevalent. Also shown here are (iv) pyrazole, (v) furan, (vi) pyrrole, (vii) thiophene, (viii) pyrimidine, (ix) dihydro-dioxine, (x) dioxole, (xi) isooxazole, (xii) oxazole, (xiv) thiadiazole. c) Potency distribution for the scaffolds i – iii, which were highly populated in the dataset. Scaffold levels are shown to the left of the potency heat map and are depicted as colored dots, with increasing structural complexity proceeding from left to right (i.e., orange indicating the least complex scaffold level and red the highest complexity shown here). Potency values are in μM and the compounds are colored based on the scaffold level which includes the substructure. Of note, not every compound in the potency distribution analysis achieved the highest level of structural complexity, as seen with compounds (5) and (6). An example of both a potent and a weakly active compound is shown for benzothiazoles (1, 2), quinolines (3, 4), pyridines (5, 6), benzimidazoles (7, 8), as well as benzimidazoles fused to other ring systems (9, 10). It was found that generally flat, planar structures were more potent FLuc inhibitors compared to more complex, branched or highly angular structures. Alternate analysis and support for this data is shown in Figure S2.
Multisubstrate adduct inhibitor (MAI) formation from aryl carboxylates
Certain benzoic acids appended to a 3,5 diaryl-oxadiazole scaffold are potent FLuc inhibitors with the capacity to form a FLuc-catalyzed MAI (Auld et al., 2008a; Auld et al., 2009b). The library used for this qHTS contained 928 ortho-, 722 meta-, and 1,394 para-substituted benzoic acids (regardless of the linker group). Of the 168 compounds showing IC50s <100 nM, 26 contained a benzoic acid group (Fig. 2), many of which contained acyclic linkers bridging two aryl rings, and one compound contained a thiophene-2-carboxylate (Fig. 2, compound 22). The majority of the carboxylates were meta substituted, with six having para substitutions. Ortho substitution was absent among potent benzoic-acid containing inhibitors. The regioisomer SAR of the substituted benzoic acid correlates with observations made previously for the 3,5 diaryl-oxadiazole scaffold, consistent with a potency rank order of meta > para ≫ ortho for the benzoic acid substituent (Auld et al., 2010; Auld et al., 2009a). The regioisomer selectivity of 3,5 diaryl-oxadiazoles can be explained by near-attack conformer (NAC) positioning of the carboxylate to promote nucleophilic displacement of pyrophosphate from ATP with subsequent formation of a potent multi-substrate adduct inhibitor (MAI, (Auld et al., 2010)).
Figure 2. Potent benzoic acid-containing compounds.

a) Potency of compounds, indicated in parenthesis, with a benzoic acid core. Those found to form a MAI are noted. For compounds categorized as “inconclusive”, one or more LC-MS traces could not confirm the adenylate product or only a weak peak for the adenylated product was observed. n.d., not determined. b) Compounds from the 151 selected for follow-up analysis that were also subjected to LC/MS analysis. Compounds were all found to form the MAI unless otherwise noted. Data supporting these findings are provided in Table S3 and Figure S3.
To confirm that these carboxylate-containing inhibitors form MAIs, compounds were incubated with equimolar equivalents of FLuc and excess ATP (2 mM) and the mixture was then analyzed for the predicted M+1 ion associated with the mass of the adenylated product. As predicted from the regioisomer SAR, the majority of the compounds with meta carboxylates were conclusively found to form an adduct (14/16). The only compounds of this potent class that did not show any evidence of adduct formation were para-substituted carboxylates (compounds 2 and 18, Fig. 2a; Table S3), indicating the high affinity must be achieved by a different mechanism of inhibition, perhaps by interactions acquired by spanning both D-LH2 and ATP pockets. By comparison, para carboxylate compounds 19 and 21 formed the adenylate adduct. Overlaying 19 and 21 with meta and para oxadiazole analogs suggests that for a para carboxylate to engage in nucleophilic displacement of PPi, energetically unfavorable rotation of the distal phenyl group within the D-LH2 pocket is required. However, the acyclic linkers of 19 and 21 can achieve a suitable overlay without phenyl group rotation, explaining MAI formation by these specific para substituted compounds (Supplemental Fig. S3). Overall, these benzoic acids illustrate the range of chemotypes capable of MAI formation.
Characterization of representative inhibitors
To gain mechanistic insights into how these compounds inhibit FLuc and manifest this inhibition in cell-based assays, we selected 151 compounds representing prominent chemotypes for additional studies. To determine if any of the selected compounds were promiscuous bioluminescent inhibitors, 147 were tested in the RLuc assay, with ~80% (122 compounds) found to be inactive (highest concentration tested = 57.5 μM). The few that did appear active had IC50s ≥20 μM in the RLuc assay and were among the least potent inhibitors of FLuc (IC50s of ~20 μM). Two RLuc-active compounds were benzenesulfonamides (PubChem CIDs: 1105141 and 1087370) that bore structural similarity to the positive control inhibitor used in the RLuc assay (BTS, IC50 = 12 μM; (Auld et al., 2009a)). In addition, a compound with a unique methylimino-thiazole core (Pubchem CID: 16195963) had a potency of ~30 μM against RLuc (40±10 nM against FLuc). The specificity of FLuc inhibition demonstrated by these compounds is in general agreement with the observation that FLuc inhibitors are selectively enriched as active compounds in FLuc-based assays and not in assays employing other reporters or detection technologies (Auld et al., 2008b).
FLuc inhibitors that form MAIs have a reduced potency in the presence of free coenzyme A (CoASH), presumably due to FLuc-catalyzed thiolytic cleavage of the mixed anhydride of the MAI (Auld et al., 2010). Addition of a high concentration (500 μM) of CoASH into the detection buffer significantly weakened the potency of 13 of the 151 compounds tested, all of which were found to be competitive with D-LH2 (Fig. 3a, cpd. 4). Notably, these compounds contained a diaryl structure with a m-COOH group and LC-MS confirmed MAI formation (Fig. 2b). Interestingly, for a carboxylate-containing benzothiazole resembling D-LH2 (Fig. 2b, cpd. 24), CoASH caused a 65-fold potency reduction, though the LC-MS analysis showed only a weak peak for the adenylated adduct.
Figure 3. Substrate competition analysis of FLuc inhibitors in enzyme assay.
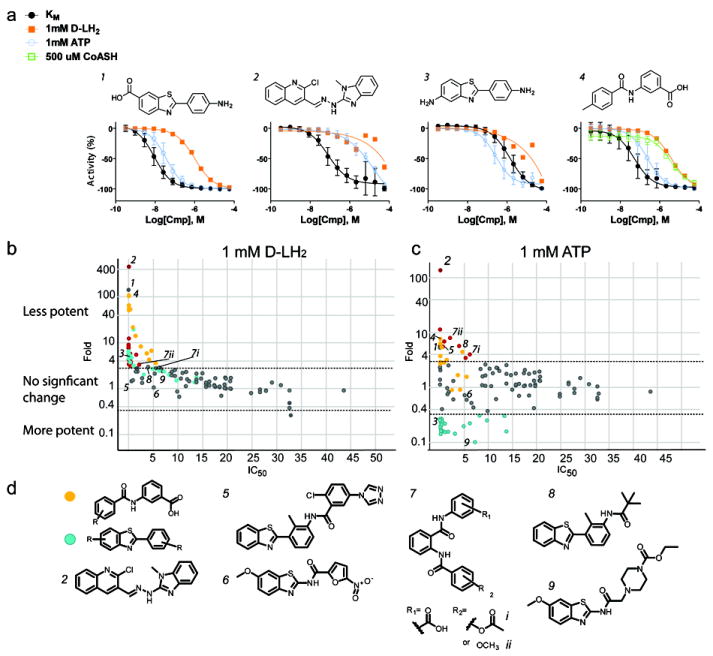
a) Example data for compounds competitive with D-LH2 (1), competitive with both D-LH2 and ATP (2, CID:4216593), competitive with D-LH2 and uncompetitive with ATP (3), and a compound showing weaker potency with CoASH due to MAI formation (4). b, c) Potency (IC50) shifts for each of the 151 follow-up compounds. The X-axis shows the IC50 of each compound under conditions in which both substrates are held near their KM concentrations. The Y-axis indicates the fold-shift in potency obtained when either D-LH2 is present at high concentration (b, 1 mM; Fold = IC50 at high D-LH2/IC50 at KM D-LH2) or when ATP is present at high concentration (c, 1 mM; Fold = IC50 at high ATP/IC50 at KM ATP). Red dots represent compounds that became >3-fold less potent in the presence of either high D-LH2 (b) or ATP (c) (i.e., IC50 increased by >3-fold with high concentration of substrate). Orange dots indicate compounds whose potency not only decreased in the presence of high concentrations of D-LH2 or ATP, but also decreased by >3-fold in the presence of high CoASH (1 mM; i.e., IC50 increased by >3-fold in presence of 1mM CoASH and KM concentrations of D-LH2 and ATP). Blue dots are those compounds that became >3-fold more potent in the presence of high ATP (i.e. IC50 decreased by > 3-fold). The horizontal lines represent a 3-fold shift in potency in either direction. d) Compounds associated with the orange dots (and whose potency decreased in the presence of high concentrations of CoASH and D-luciferin) were found to have an aryl carboxylate. Compounds associated with blue dots (and became more potent in the presence of high concentrations of ATP) largely contained a benzothiazole scaffold. A single compound (2, CID:4216593) was found to have the highest shift in potency in both high D-luciferin and high ATP conditions. 5 and 6, example compounds showing either mixed or non-competitive behavior, respectively. 7i, 7ii, and 8, examples of compounds demonstrating competitive behavior with ATP. Compound 9, an example compound that is more potent with high ATP concentration. Supported by Figure S5.
Many compounds competitive with D-LH2 are simple substituted benzothiazole scaffolds (Fig. 3a, b, d), the majority of which (23/25) become more potent in the presence of saturating ATP (Fig. 3a cpd 3, Fig. 3c and d). The X-ray co-crystal structure for a representative benzothiazole (PDB: 4E5D) confirms binding of this chemotype to the D-LH2 pocket (Fig. S4) which mainly consists of π–π interactions with F247 (Fig. 4). The ligand does not form direct hydrogen bonds with the protein but is tethered by water-mediated contacts between the benzothiazole nitrogen and the carbonyl oxygen of G246 and hydroxyl of S347. As such, there are no hydrogen bonds to stabilize and the loop between S314 to L319 is disordered as we have also observed with an MAI (Auld et al., 2010). Therefore, the conformation of this loop is similar to the apo form of luciferase that we previously reported (PDB: 3IEF). Taken together with MOI analysis, this data points to an uncompetitive inhibition mode for these benzothiazoles, with respect to ATP. Additionally, for 73 compounds (of 151 total tested) that showed non-competitive inhibition with respect to D-LH2, nearly one-third (27 compounds) were also observed to contain a benzothiazole. Structurally, these benzothiazoles are characterized by a polar or more structurally complex substitution pattern (Fig. 3d, compounds 5 and 6) compared to those of the D-LH2-competitive class.
Figure 4. X-ray structure of a benzothiazole-FLuc co-crystal.
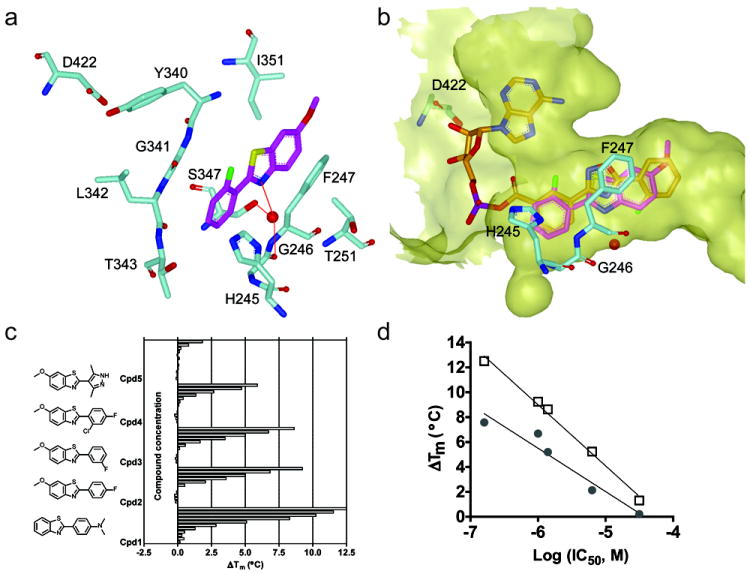
a) Interactions of a benzothiazole (magenta) within the D-LH2 pocket of FLuc. Aromatic stacking interactions between the benzothiazole core and F247 are observed. A water-mediated H-bond was formed between benzothiazole nitrogen and G246 backbone carbonyl oxygen and S347 hydroxyl, as shown by the red dotted line. Protein residues are shown in cyan; supported by Table S1 and Figure S4. b) Overlay with of the benzothiazole (magenta) with the FLuc-bound structure of PTC124-AMP (PDB: 3IES; orange) showing occupation of the D-LH2 pocket by the benzothiazole with no overlap into the AMP binding region of FLuc. The binding pocket was depicted as semi-transparent yellow surface. These figures were prepared with the program VIDA (OpenEye Scientific Software). c) Representative simple benzothiazoles and example thermal shift data assayed in the presence of 2 mM ATP. d) The ΔTm obtained at 100μM compound in the presence (open squares) or absence (solid circles) of 2 mM ATP plotted against the potency of each benzothiazole (shown in c).
Consistent with inhibitor-based enzyme stabilization we observed increases in FLuc Tm values for representative benzothiazoles (Fig. 4c,d). The ΔTm values ranged from ~1° to as high as 7.6°C and correlated with the IC50s of these inhibitors (r2 >0.94, Fig. 4d). The presence of saturating (2 mM) ATP led to generally higher ΔTm values (these were between 1°C and 5°C higher in the presence of ATP). This is consistent with high ATP improving the binding interactions of benzothiazole inhibitors to FLuc. The data in the presence of high ATP is probably more representative of the stabilization occurring intracellularly upon FLuc inhibitor binding.
Of the follow-up compounds tested, ATP-competitive inhibitors were fewer in number (16) than D-LH2-competitive inhibitors (42). Most interesting, however, was a quinolinyl benzimidazole (IC50 = 70±10 nM), the potency of which was significantly reduced by either ATP or D-LH2 (Fig. 3a, cpd. 2 CID:4216593). This compound contains both a benzimidazole, a moiety competitive with D-LH2 (Auld et al., 2008a), as well as a quinoline, which is competitive with ATP (Auld et al., 2008a; Fry et al., 1994) and is structurally consistent with the compound occupying both substrate pockets. Interestingly, CID:4216593 is listed as active in 27 assays in PubChem (as of Dec. 2011), 70% of which are based on FLuc (PubChem3, 2011).
Consequences of FLuc inhibition in RGAs
Our previous work addressed how FLuc inhibitors caused an increase in FLuc signal in RGAs by FLuc inhibitor-based stabilization (Auld et al., 2010; Auld et al., 2009a). To see how the 151 FLuc inhibitors with known MOI behaved in FLuc RGAs, we tested these in two assays, the pFLucUGA190UGA assay (Auld et al., 2009a) and the miR-21 assay (PubChem AID 2288), which were designed to identify compounds that increase FLuc expression, presumably by targeted pathway modulation. In both of these assays, FLuc inhibitors could also generate an increase in FLuc signal by FLuc inhibitor-based stabilization. We found that a significant percentage of the compounds caused luminescence to increase: ~65% in the miR21 assay (Gumireddy et al., 2008) and ~25% in the FLuc190UGA read-through assay (Auld et al., 2009a) using either a 48 or 72 hour compound incubation time. Approximately two-thirds of the compounds that were active in the miR-21 assay were also active in the FLuc190UGA read-through assay. Only one compound in the read-through assay was classified as inactive in the miR-21 assay.
To observe FLuc enzymatic activity in the cell-based assays, the composition of the detection reagents (e.g. [D-LH2 or ATP] and or [CoASH]) has to be sufficient to overcome the FLuc inhibitor binding. The detection reagents used in this study increased the IC50 of the inhibitors (reduced the potency) by >5-fold for 30-40% of the inhibitors in a purified FLuc assay (Fig. S5). Compounds which remained potent in detection reagent were found to be either highly potent against the enzyme, with only slight effects on IC50 when a single substrate was present in excess, or those that showed an uncompetitive inhibition mode (Fig. S5).
Inhibitors leading to activation in the cell-based assays covered a range of MOIs as determined with purified FLuc in biochemical assays, with competitive, non-competitive and uncompetitive inhibitors all resulting in varying degrees of activation in the cell-based assays (Fig. 5a). Although the CRC varied depending on the cell-based assay, compounds which are competitive with one of the FLuc substrates often gave rise to strong activation in the cell-based miR-21 assay and were highly potent FLuc inhibitors (e.g. CID: 16015828, AC50 = 10nM and CID 5456435, AC50 = 4nM, Fig. S5) which remained active in the presence of detection reagents. Several inhibitors did not demonstrate activation in the cell-based assays, possibly due to cell impermeability, failure to sufficiently stabilize FLuc from intracellular degradation, or because they destabilized FLuc in a cellular context (Nishiya et al., 2009). Significantly, although many of the same FLuc inhibitory compounds were active in the two cell-based assays, the types of CRCs generated by these compounds could differ between the assays (examples are shown in Fig. 5b), likely due to protocol differences, as discussed below.
Figure 5. Apparent activation of FLuc signal associated with FLuc inhibitors.

a) Heatmap colored by activity in the indicated cell-based assay. Two-thirds of the follow-up compounds tested were active in at least one of the cell-based assays tested. Except for two compounds (out of 151), compounds active in the read-through assays (UGA) at 48/72 hours were also active in the miR-21 assay. For the read-through assay, regardless of the MOI, FLuc inhibitors generally produced an activation-type curve. Of note, very few FLuc inhibitors produced an inhibitory CRC in these assays, as they were developed and optimized to identify compounds that caused activation of FLuc signal. b) CRCs for select FLuc inhibitors comparing their activity in the cell-based assays and biochemical assay. FLuc inhibitors with different MOIs (see Figure 2) commonly exhibit inhibition of FLuc in the biochemical assay with KM concentrations of substrates and produce activation or bell-shaped curves in cell-based assays. Supported by Figure S6.
DISCUSSION
In this study we provide a complete profile of FLuc inhibitory activity for each of the 360,864 compounds in the MLSMR. Approximately 4% of the FLuc inhibitors displayed high quality CRCs with potencies generally <10 μM. By comparison, our previous FLuc profiling campaign used higher D-LH2 concentrations in the assay (Auld et al., 2008a). Out of the 8,233 compounds identified as FLuc inhibitors in this study which were also screened in our previous effort, only 1,971 (~24%) were active in the previous, high concentration D-LH2 assay. These results, available in PubChem, underscore the pervasiveness of compounds that inhibit FLuc in compound libraries used for screening and indicate that many of these compounds are competitive with D-LH2.
The enrichment of potent FLuc inhibitors in FLuc-based assays carries important consequences for RGAs as these can easily confound and overwhelm marginally active, target-directed compounds. For example, examination of assays listed in PubChem indicated that FLuc inhibitors can comprise more than half the hits derived from FLuc-based assays (Auld et al., 2008b) and reports have noted higher enrichments, approaching 98% (Lyssiotis et al., 2009; Younis et al., 2010). Nonetheless, such chemotypes have been considered as lead series, in part based on suggestive secondary assay data, although the target underlying the activity has yet to be identified (Manuvakhova et al., 2011; Xiao et al., 2011). Potent FLuc inhibitors have also been characterized from natural product extracts (Cruz et al., 2011) and have confused the interpretation of virtual screening results (Pang et al., 2011). The data and findings provided by our work can be used to triage or annotate FLuc inhibitors from candidate hits, thereby aiding in the prioritization of compounds chosen for follow-up investigation, and importantly reiterates the value of redundancy in reporter outputs (Auld et al., 2009a).
FLuc Inhibitors Defined
Compounds inhibiting FLuc have a defined SAR and do not demonstrate inhibition of unrelated luciferases, such as Renilla luciferase. Inhibitors of FLuc tend to be small (for the high quality inhibitor CRC classes the MWavg = 325.8±63.3, maximum = 898.8, minimum 122.17; additional physicochemical parameters are given in Table S2), linear, planar structures and, from scaffold analysis, commonly contain a thiazole, imidazole, oxadiazole, or pyridine ring. Scaffold analysis indicates the fusion of these 5-membered rings are often observed in benzothiazoles, benzoxazoles, benzimidazoles, and oxadiazoles, while hydrazines can be found to bridge aromatic substituents such as benzoic acids.
FLuc inhibitors act through a number of MOIs, some resembling and acting as competitive inhibitors of D-LH2, such as benzothiazoles, while others, including a significant number belonging to this chemotype, are non-competitive with D-LH2. Other chemotypes are competitive with both D-LH2 and ATP (e.g., CID: 4216593), or only ATP, such as the hydrazine-containing compound CID: 16193026. For a subset of benzothiazole-containing compounds (e.g. CID: 976322), ATP was found to enhance inhibitor binding.
Enzymatic adenylation of a compound with an appropriately positioned carboxylate represents a unique mechanism of FLuc inhibition through MAI formation. Although typically a rare event, difficult to achieve by design of synthetic inhibitors (Inglese and Benkovic, 1991), MAIs occur relatively frequently in our study and, not surprisingly, are among the most potent FLuc inhibitors. FLuc catalyzed formation of an MAI requires some degree of substrate specificity, as seen for oxadiazoles meta-substituted to benzoic acids (Auld et al., 2010). However in the large-scale profiling data shown here, we observed that acyclic linkers can substitute for 5-membered ring systems, bridging benzoic acids to other aromatic rings. Further, the more flexible acyclic linkers allow some para-substituted benzoic acids to engage in MAI formation. A diagnostic test for MAI formation is the approximately 100-fold potency decrease shown by an FLuc inhibitor in the presence of high concentrations of CoASH, likely attributable to the thiolytic reaction similar to that between CoASH and L-AMP (Fraga et al., 2004; Fraga et al., 2005). Due to the high potency of FLuc MAIs, one must be careful to consider the purity of the compound sample, as even trace contaminates which form an MAI could lead to misleading results.
Behavior of FLuc inhibitory compounds in cell-based FLuc RGAs
FLuc enzyme inhibitors can be detected in FLuc RGAs as either inhibitors or activators of FLuc signal/expression, producing inhibition, activation, or bell-shaped CRCs. The shape and direction of the CRC generated by an FLuc inhibitor in a FLuc RGA depends on a number of properties: the IC50, the compound’s MOI, the assay format, and the detection reagent used in the assay (Auld et al., 2008b). Previously, we found that prolonged compound incubation times (48 or 72 hours) increases the level of apparent activation of FLuc and thus the number of apparent activator compounds (Auld et al., 2009a; Auld et al., 2008b). At shorter incubation times (<10 hrs) in cell-based assays it is unlikely that significant apparent activation will be observed with wild-type FLuc as a reporter. In addition, the type of detection reagent used to quantify FLuc signal can influence the level of activation detected due to FLuc-inhibitor-based stabilization (Peltz et al., 2009). Detection reagents that contain high concentrations of CoASH (BrightGlo - Promega, BriteLite - Perkin Elmer) are commonly used in HTS because addition of CoASH enhances FLuc signal. Under such conditions MAIs would be converted to low potency CoA adducts (Auld et al., 2010) easily competed off the enzyme by excess concentrations of D-LH2 and ATP also found in these detection reagents.
In this study, we found that some cell-based FLuc assays were more susceptible than others in identifying FLuc inhibitors. For example, in two assays designed to respond to perturbation of a biological interaction with an increase in FLuc reporter activity (miR-21 assay), approximately twice as many FLuc inhibitors were found to be active compared to a read-through assay. In addition, FLuc inhibitors in the miR-21 assay generated bell-shaped or activation-type CRCs, whereas the majority of these generated activation-type CRCs in the read-through assay. Specifically, of the 36 compounds that generated activation CRCs in the read-through assay at the 72hr time point, 19 generated bell-shaped curves in the miR-21 assay (Fig. S6). One main difference in the protocols between the two assays is that our read-through assay involves wash steps prior to addition of detection reagent, which effectively removes excess compound (equilibrated between cells and culture medium). This effectively enhances the level of uninhibited FLuc upon cell lysis and addition detection reagent, thereby leading to greater FLuc signal and activation-type sigmoidal CRCs. Bell-shaped CRCs are composite responses generated by the stabilization of FLuc in the cell by the inhibitory compound at low concentrations, which gives a rise to apparent activation in FLuc signal, followed at inhibition and a decrease in reporter activity at higher concentrations of inhibitor resulting an inhibition-type CRC (Fig. 5a cmp. 1 and 5, blue curve). Another difference between the two assays is that the miR-21 assay expressed wild-type FLuc, whereas functional FLuc expressed in the read-through assay is produced by mis-incorporation of an amino acid at codon 190 (which is a nonsense codon in the assay). It is thus possible that the potency of certain inhibitors against this mutant FLuc could be different than for the wild-type enzyme. The effect that such assay format differences have on whether a given compound is identified as a FLuc inhibitor limits the utility of cell-based FLuc assays as counter-screens.
We have found that FLuc RGAs in which there is a low-level of basal FLuc expression seem especially susceptible to FLuc inhibitory compounds that appear as “activators” in the assay. This is characteristic of the two cell-based assays described in this paper – the miR-21 and read-through assays – both optimized to identify activators of FLuc expression/activity. The large number of FLuc inhibitors identified when using these assays to screen a compound library is likely due to FLuc inhibitor-based stabilization, a phenomenon which we and others have previously described (Auld et al., 2009a; Auld et al., 2008b; Thompson et al., 1991) and confirmed here with benzothiazoles. A stronger than expected activation relative to control compounds, so-called “super activation”, can be an indication that inhibitor-based stabilization is operating (Sotoca et al., 2010). If the activation effect parallels the concentration range observed for the inhibition of purified FLuc enzyme, and if the SAR for the cell-based activation activity tracks with the inhibition of FLuc, then inhibitor-based stabilization is the likely mechanism for cellular activity (Thorne et al., 2010). We have observed that assays in which the basal pool of FLuc is very low, FLuc inhibitors are readily identified, as activity from FLuc inhibitor-based stabilization can represent a significant component of the assay signal. By comparison, in assays with significantly higher levels of basal FLuc expression, FLuc inhibitor-based stabilization may not be as apparent. In general, the susceptibility of a given FLuc RGA to modulation by FLuc inhibitors can be evaluated using compounds described in this study, many of which are commercially available.
In our profiling effort we also encountered compounds that were inactive against purified FLuc, but could potentially be converted to FLuc inhibitors in cells, through cellular metabolic processes. The simplest case is an appropriately positioned ester where hydrolysis by intracellular esterases would yield the free acid, in turn leading to formation of an MAI through adenylation of the compound by FLuc and stabilization of FLuc by the hydrolyzed ester metabolite of this compound. This brings up an important point: while our profiling campaign and MOI analysis of FLuc inhibitors is the most comprehensive to date, complete reliance on this database for identification of all potential FLuc inhibitors is not currently possible, as exemplified by compounds that are intracellularly metabolized into FLuc inhibitors.
FLuc inhibitors uncompetitive with ATP, which, in this study, were commonly simple benzothiazoles that likely bind to the FLuc luciferin pocket, may also behave differently in cell-based assays compared to a FLuc enzyme assay. These compounds are likely to show more potent binding to FLuc in cells where ATP levels are high and D-LH2 is absent, and thus appear more potent in cell-based FLuc RGAs than in a FLuc enzyme assay with KM concentrations of substrates.
Assessing the impact of FLuc inhibition in cell-based assays
Alternative strategies can be used to identify FLuc inhibitors and these differ depending on whether one is searching for agonists or antagonists of the luciferase signal (Fig. 6, tier 1). The first step to determining if compounds active in a cell-based FLuc RGA are FLuc inhibitors is to evaluate their activity in the biochemical assay used in this study - a purified FLuc assay using KM concentrations of substrates (Fig. 6, tier 2). To identify compounds that are uncompetitive inhibitors with respect to ATP, it is necessary to run the FLuc assay in the presence of low D-LH2 (e.g. 1 μM D-LH2, ~10-fold below the KM) and high ATP (e.g. 1 mM). Pre-incubation of the compound with FLuc in the presence of high ATP is another test for FLuc inhibitors. Commercial detection cocktails should not be used to determine FLuc inhibitor potency as these contain excess concentrations of substrates of a proprietary composition which can influence the apparent potency of tested compounds.
Figure 6. Strategies for identifying luciferase inhibitor interference.
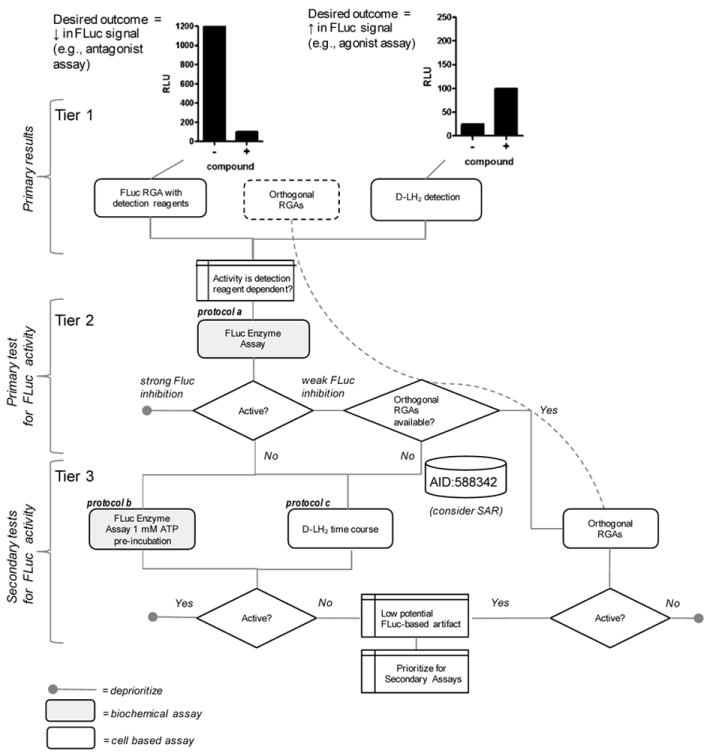
Actives identified in agonist (tier 1, right) or antagonist (tier 1, left) cell-based assays should be tested in the FLuc enzyme assay using KM levels of substrates, as a preliminary filter for luciferase inhibitors (tier 2, protocol a) and removes detection reagent dependent-activity. One can then directly test compounds in a suitable orthogonal reporter system if it is available (right path), or, if no such assay is readily available, compound activity can be analyzed in a series of tests (central path, tier 3) to determine if FLuc interference exists. In tier 3, protocol b is the FLuc enzyme performed at low D-LH2 (e.g. 10 μM) and saturating ATP which will help identify FLuc inhibitors uncompetitive with ATP. If D-LH2 was not already used in the RGA (see tier 1), then protocol c, the RGA assay performed with D-LH2 detection as a time course study, can be used to identify detection reagent-dependent compound activity. Results from our profiling work (PubChem AID 588342) can also be used as a resource to identify related chemotypes that may act as FLuc inhibitors. If counter-screen assays are used, they should be calibrated with a few FLuc inhibitors described in this report to determine the relative sensitivity of the assay to FLuc inhibitors.
The choice of detection reagent depends on the desired mode of action in the cell-based assay. For agonist assays (Fig. 6, tier 1, right) an option is to instead add D-LH2 alone and rely on intracellular ATP levels to measure unbound intracellular FLuc. For example, if the signal allows for this format, 10 to 30 μM D-LH2 is added shortly after cell seeding and luciferase activity is detected in a non-lytic mode from live cells at multiple time points (Didiot et al., 2011). In this mode cell-permeable FLuc inhibitors will be apparent at early time points. The signal will be lower when substituting D-LH2 for detection reagent, but given the extremely low background of luminescence, the signal-to-background of the assay is often acceptable. Possible caveats to adding D-LH2 to live cells include adverse effects on cell viability and that the assay may identify compounds which modulate ATP levels. For antagonist assays (Fig. 6 tier 1, left), it is necessary to use detection reagents to reduce the number of competitive inhibitors identified as actives in the assay. In either case, if changing the detection reagent (e.g. from BrightGlo to D-LH2) shows a marked effect on the pharmacology of compounds (activation level, inhibition level, or AC50), then luciferase interference is likely present.
The ideal experiment to exclude FLuc inhibitors is to develop an orthogonal reporter system (e.g. the same assay but with an alternate reporter; (Jang et al., 2012)), preferably in an isogenic cell line, to confirm the nature of actives identified in a FLuc RGA before any conclusions on compound activity are made. This should greatly simplify the characterization of actives arising from FLuc-cell based assays, and can be placed at the initial screening stage, if practical, or used at a subsequent step (Fig. 6, tier 1 and 2). Alternative reporters include RLuc (Roda et al., 2009), β-lactamase (Zlokarnik et al., 1998), and Gaussia luciferase (Maguire et al., 2009). Due to the complications in identifying FLuc inhibitors as described here and elsewhere (Auld et al., 2010; Auld et al., 2009a; Auld et al., 2008b), it is especially important not to develop structure-activity relationships (SAR) solely derived from compound activity in a cell-based FLuc RGA, as this significantly increases the likelihood of optimizing compounds for FLuc inhibitory activity instead of activity for the intended target. In cases where compounds appear to be FLuc enzyme inhibitors but also remain active in the orthogonal RGA, the orthogonal assay should be used to guide chemical optimization of the series. Finally, the use of non-enzymatic reporters such as fluorescent proteins will eliminate the complications of enzyme inhibitors but it is important to note that such assays also require suitable orthogonal reporter assays to identify fluorescent interferences (e.g. quenching or compound fluorescence).
SIGNIFICANCE
The hypothesis that FLuc signal modulation is due to a compound interacting with a particular target/pathway demands rigorous confirmation before secondary or tertiary assays are investigated to avoid deceptive leads. The profiling database developed in this study should be used in combination with experiments that specifically test for reporter interference, in addition to confirmation of activity using orthogonal assays, before performing secondary assays or in vivo models which try to build on assumed target activity. With this study, we aim (1) to provide a more highly resolved understanding of the various mechanisms of FLuc inhibition by compounds commonly found in screening libraries, and (2) to provide researchers with a methodology for successfully identifying compounds that genuinely affect the biology of interest in FLuc cell-based assays. With this study as a guide, discerning utilization of FLuc as an assay reporter can facilitate the identification of viable leads.
EXPERIMENTAL PROCEDURES
Reagents
See SI Methods for source of reagents.
Preparation of compound libraries and control plates
364,105 total compounds (360,864 unique compounds) from the NIH Molecular Libraries Small Molecule Repository were titrated at seven concentrations as previously described (Yasgar et al., 2008) and further elaborated on in SI Methods.
Luciferase assay and qHTS Data Analysis
The luciferase assay used 10 μM ATP and D-LH2 and was performed in Greiner MB white 1536-well plates as described (Auld et al., 2010). Also refer to SI Methods.
Scaffold analysis
Structure-based relationships were examined by a scaffold tree clustering method (Schuffenhauer et al., 2007). For in-depth MOI analysis, only compounds associated with high quality CRCs (class 1a, 1b, and 2a) were used. See SI Methods for further details.
LC-MS of compounds
Evidence for multi-substrate adduct inhibitor (MAI) formation was obtained with liquid-chromatography/mass spectrometry (LC/MS) using assay conditions previously described (Auld et al., 2010). A detailed LC/MS protocol is described in SI Methods.
Mode of inhibition (MOI) assays with purified firefly luciferase
To probe the MOI for 151 selected FLuc inhibitors, a 12-point titration of each compound (final concentrations ranged from 57.5μM to 0.3nM) was tested in luciferase assays as described above. For MOI assays, one of the substrates was present at a KM concentration while the other was at saturating concentrations (1mM ATP or 1mM D-luciferin). In addition, the activity of each compound was tested in the presence of 500μM free coenzyme A (CoASH). Each MOI assay was performed in three separate tests and each compound was assayed in duplicate in each test.
Renilla luciferase biochemical assay
The RLuc assay was performed as described previously (Auld et al., 2009a). Briefly, a 12-point titration of each follow-up compound was tested in an assay of 1nM purified RLuc and 5μM (KM concentration) of coelenterazine, its substrate, in a Tris acetate buffer pH 7.6. BTS (cat #1870, Tocris) – a compound we previously identified as a RLuc inhibitor - was used as a positive control.
Cell-based FLuc RGAs
The following cell-based FLuc RGAs were used to study the activity of FLuc inhibitors in a cellular context: the pFLucUGA190UGA assay (Auld et al., 2009a) and a miR-21 FLuc assay (48-hour incubation with compound; PubChem AID 2288).
Crystallization, data collection and refinement
The determination of FLuc-ligand co-crystal structures has been described previously (Auld et al., 2010), with details for the FLuc benzothiazole structure in SI Methods. Crystallographic data are provided in Table S1. Coordinates and structure factors have been deposited in the Protein Databank (accession code 4E5D).
Thermal shift assay
FLuc was obtained from Sigma (catalog no. L1792). SYPRO Orange (5000X stock, provided by Life Technologies) was used as the environmentally sensitive dye to monitor FLuc unfolding induced by temperature increase performed on an iQ5 Real Time PCR Detection system (Bio-Rad). Further details are in the SI Methods.
Supplementary Material
HIGHLIGHTS.
12% of a representative small molecule library inhibits firefly luciferase (FLuc)
Competitive, non-competitive, uncompetitive, and MAI inhibitors were identified
65% of Fluc inhibitors with known MOIs increased luminescence signal in Fluc-RGAs
Methods to identify FLuc inhibitors that interfere with assay results are described
Acknowledgments
We thank W. Leister and J. Bougie for their expert assistance with LC/MS analysis and D-T. Nguyen for MCS analysis, R. MacArthur for help in data mining, P. Shinn and D. van Leer for compound management support, K. P. Battaile for X-ray data collection, and S. Michael for his HTS expertise. This work was supported by the Molecular Libraries Initiative of the National Institutes of Health Roadmap for Medical Research and the Intramural Research Program of the National Human Genome Research Institute, National Institutes of Health. Use of the IMCA-CAT beamline 17-ID at the Advanced Photon Source was supported by the companies of the Industrial Macromolecular Crystallography Association through a contract with Hauptman-Woodward Medical Research Institute. Use of the Advanced Photon Source was supported by the U.S. Department of Energy, Office of Science, Office of Basic Energy Sciences, under Contract No. DE-AC02-06CH11357. Use of the KU COBRE Protein Structure Laboratory was supported by grants from the National Center for Research Resources (5P20RR017708-10) and the National Institute of General Medical Sciences (8 P20 GM103420-10) from the National Institutes of Health.
Abbreviations
- CoASH
free coenzyme A
- CRC
concentration response curve
- FLuc
Photinus pyralis firefly luciferase
- RLuc
Renilla reniformis luciferase
- NCGC
NIH Chemical Genomics Center
- AID
Assay Identifier number for PubChem
- CID
Compound Identifier number for PubChem
- LH2
D-luciferin
- L-AMP
dehydro-luciferyl-AMP
- MCS
maximum common structure
- MLSMR
Molecular Libraries Small Molecule Repository
- MOI
mode of inhibition
- BTS
4-Methyl-N-(phenylmethyl)benzenesulfonamide
- MAI
Multi-substrate adduct inhibitor
- RGA
reporter gene assay
- SAR
structure activity relationships
Footnotes
The authors have no conflict of interest.
Publisher's Disclaimer: This is a PDF file of an unedited manuscript that has been accepted for publication. As a service to our customers we are providing this early version of the manuscript. The manuscript will undergo copyediting, typesetting, and review of the resulting proof before it is published in its final citable form. Please note that during the production process errors may be discovered which could affect the content, and all legal disclaimers that apply to the journal pertain.
References
- Auld DS, Lovell S, Thorne N, Lea WA, Maloney DJ, Shen M, Rai G, Battaile KP, Thomas CJ, Simeonov A, et al. Molecular basis for the high-affinity binding and stabilization of firefly luciferase by PTC124. Proc Natl Acad Sci U S A. 2010;107:4878–4883. doi: 10.1073/pnas.0909141107. [DOI] [PMC free article] [PubMed] [Google Scholar]
- Auld DS, Southall NT, Jadhav A, Johnson RL, Diller DJ, Simeonov A, Austin CP, Inglese J. Characterization of chemical libraries for luciferase inhibitory activity. J Med Chem. 2008a;51:2372–2386. doi: 10.1021/jm701302v. [DOI] [PubMed] [Google Scholar]
- Auld DS, Thorne N, Maguire WF, Inglese J. Mechanism of PTC124 activity in cell-based luciferase assays of nonsense codon suppression. Proc Natl Acad Sci U S A. 2009a;106:3585–3590. doi: 10.1073/pnas.0813345106. [DOI] [PMC free article] [PubMed] [Google Scholar]
- Auld DS, Thorne N, Nguyen DT, Inglese J. A specific mechanism for nonspecific activation in reporter-gene assays. ACS Chem Biol. 2008b;3:463–470. doi: 10.1021/cb8000793. [DOI] [PMC free article] [PubMed] [Google Scholar]
- Auld DS, Zhang YQ, Southall NT, Rai G, Landsman M, Maclure J, Langevin D, Thomas CJ, Austin CP, Inglese J. A Basis for Reduced Chemical Library Inhibition of Firefly Luciferase Obtained from Directed Evolution. J Med Chem. 2009b;52:1450–1458. doi: 10.1021/jm8014525. [DOI] [PMC free article] [PubMed] [Google Scholar]
- Cruz PG, Auld DS, Schultz PJ, Lovell S, Battaile KP, MacArthur R, Shen M, Tamayo-Castillo G, Inglese J, Sherman DH. Titration-based screening for evaluation of natural product extracts: identification of an aspulvinone family of luciferase inhibitors. Chem Biol. 2011;18:1442–1452. doi: 10.1016/j.chembiol.2011.08.011. [DOI] [PMC free article] [PubMed] [Google Scholar]
- Didiot MC, Serafini S, Pfeifer MJ, King FJ, Parker CN. Multiplexed reporter gene assays: monitoring the cell viability and the compound kinetics on luciferase activity. J Biomol Screen. 2011;16:786–793. doi: 10.1177/1087057111407768. [DOI] [PubMed] [Google Scholar]
- Fan F, Wood KV. Bioluminescent assays for high-throughput screening. Assay Drug Dev Technol. 2007;5:127–136. doi: 10.1089/adt.2006.053. [DOI] [PubMed] [Google Scholar]
- Fraga H, Esteves da Silva JC, Fontes R. Identification of luciferyl adenylate and luciferyl coenzyme a synthesized by firefly luciferase. Chembiochem. 2004;5:110–115. doi: 10.1002/cbic.200300735. [DOI] [PubMed] [Google Scholar]
- Fraga H, Fernandes D, Fontes R, Esteves da Silva JC. Coenzyme A affects firefly luciferase luminescence because it acts as a substrate and not as an allosteric effector. FEBS J. 2005;272:5206–5216. doi: 10.1111/j.1742-4658.2005.04895.x. [DOI] [PubMed] [Google Scholar]
- Fry DW, Kraker AJ, McMichael A, Ambroso LA, Nelson JM, Leopold WR, Connors RW, Bridges AJ. A specific inhibitor of the epidermal growth factor receptor tyrosine kinase. Science. 1994;265:1093–1095. doi: 10.1126/science.8066447. [DOI] [PubMed] [Google Scholar]
- Gumireddy K, Young DD, Xiong X, Hogenesch JB, Huang Q, Deiters A. Small-molecule inhibitors of microrna miR-21 function. Angew Chem Int Ed Engl. 2008;47:7482–7484. doi: 10.1002/anie.200801555. [DOI] [PMC free article] [PubMed] [Google Scholar]
- Herbst KJ, Allen MD, Zhang J. The cAMP-dependent protein kinase inhibitor H-89 attenuates the bioluminescence signal produced by Renilla Luciferase. PLoS One. 2009;4:e5642. doi: 10.1371/journal.pone.0005642. [DOI] [PMC free article] [PubMed] [Google Scholar]
- Inglese J, Auld DS, Jadhav A, Johnson RL, Simeonov A, Yasgar A, Zheng W, Austin CP. Quantitative high-throughput screening: A titration-based approach that efficiently identifies biological activities in large chemical libraries. Proc Natl Acad Sci U S A. 2006;103:11473–11478. doi: 10.1073/pnas.0604348103. [DOI] [PMC free article] [PubMed] [Google Scholar]
- Inglese J, Benkovic SJ. Multisubstrate Adduct Inhibitors of Glycinamide Ribonucleotide Transformylase: Synthesis and Enzyme-Assembled. Tetrahedron. 1991;47:2351–2364. [Google Scholar]
- Jang SW, Lopez-Anido C, Macarthur R, Svaren J, Inglese J. Identification of Drug Modulators Targeting Gene-Dosage Disease CMT1A. ACS Chem Biol. 2012;7(7):1205–1213. doi: 10.1021/cb300048d. [DOI] [PMC free article] [PubMed] [Google Scholar]
- Keiser MJ, Roth BL, Armbruster BN, Ernsberger P, Irwin JJ, Shoichet BK. Relating protein pharmacology by ligand chemistry. Nat Biotechnol. 2007;25:197–206. doi: 10.1038/nbt1284. [DOI] [PubMed] [Google Scholar]
- Lyssiotis CA, Foreman RK, Staerk J, Garcia M, Mathur D, Markoulaki S, Hanna J, Lairson LL, Charette BD, Bouchez LC, et al. Reprogramming of murine fibroblasts to induced pluripotent stem cells with chemical complementation of Klf4. Proc Natl Acad Sci U S A. 2009;106:8912–8917. doi: 10.1073/pnas.0903860106. [DOI] [PMC free article] [PubMed] [Google Scholar]
- Maguire CA, Deliolanis NC, Pike L, Niers JM, Tjon-Kon-Fat LA, Sena-Esteves M, Tannous BA. Gaussia Luciferase Variant for High-Throughput Functional Screening Applications. Anal Chem. 2009;81:7102–7106. doi: 10.1021/ac901234r. [DOI] [PMC free article] [PubMed] [Google Scholar]
- Manuvakhova MS, Johnson GG, White MC, Ananthan S, Sosa M, Maddox C, McKellip S, Rasmussen L, Wennerberg K, Hobrath JV, et al. Identification of Novel Small Molecule Activators of Nuclear Factor-kappa B With Neuroprotective Action Via High-Throughput Screening. J Neurosci Res. 2011;89:58–72. doi: 10.1002/jnr.22526. [DOI] [PMC free article] [PubMed] [Google Scholar]
- Nishiya Y, Shibata K, Saito S, Yano K, Oneyama C, Nakano H, Sharma SV. Drug-target identification from total cellular lysate by drug-induced conformational changes. Anal Biochem. 2009;385:314–320. doi: 10.1016/j.ab.2008.11.034. [DOI] [PubMed] [Google Scholar]
- Pang YP, Park JG, Wang S, Vummenthala A, Mishra RK, McLaughlin JE, Di R, Kahn JN, Tumer NE, Janosi L, et al. Small-molecule inhibitor leads of ribosome-inactivating proteins developed using the doorstop approach. PLoS One. 2011;6:e17883. doi: 10.1371/journal.pone.0017883. [DOI] [PMC free article] [PubMed] [Google Scholar]
- Peltz SW, Welch EM, Jacobson A, Trotta CR, Naryshkin N, Sweeney HL, Bedwel DM. Nonsense suppression activity of PTC124 (ataluren) Proc Natl Acad Sci U S A. 2009;106:E64. doi: 10.1073/pnas.0901936106. [DOI] [PMC free article] [PubMed] [Google Scholar]
- [April 2012];PubChem database. http://pubchem.ncbi.nlm.nih.gov.
- Roda A, Guardigli M, Michelini E, Mirasoli M. Bioluminescence in analytical chemistry and in vivo imaging. Trends in Analytical Chemistry. 2009;28:307–322. [Google Scholar]
- Schuffenhauer A, Ertl P, Roggo S, Wetzel S, Koch MA, Waldmann H. The scaffold tree--visualization of the scaffold universe by hierarchical scaffold classification. J Chem Inf Model. 2007;47:47–58. doi: 10.1021/ci600338x. [DOI] [PubMed] [Google Scholar]
- Shukla SJ, Nguyen DT, Macarthur R, Simeonov A, Frazee WJ, Hallis TM, Marks BD, Singh U, Eliason HC, Printen J, et al. Identification of pregnane X receptor ligands using time-resolved fluorescence resonance energy transfer and quantitative high-throughput screening. Assay Drug Dev Technol. 2009;7:143–169. doi: 10.1089/adt.2009.193. [DOI] [PMC free article] [PubMed] [Google Scholar]
- Sotoca AM, Bovee TF, Brand W, Velikova N, Boeren S, Murk AJ, Vervoort J, Rietjens IM. Superinduction of estrogen receptor mediated gene expression in luciferase based reporter gene assays is mediated by a post-transcriptional mechanism. J Steroid Biochem Mol Biol. 2010;122:204–211. doi: 10.1016/j.jsbmb.2010.06.010. [DOI] [PubMed] [Google Scholar]
- Thompson JF, Hayes LS, Lloyd DB. Modulation of firefly luciferase stability and impact on studies of gene regulation. Gene. 1991;103:171–177. doi: 10.1016/0378-1119(91)90270-l. [DOI] [PubMed] [Google Scholar]
- Thorne N, Inglese J, Auld DS. Illuminating insights into firefly luciferase and other bioluminescent reporters used in chemical biology. Chem Biol. 2010;17:646–657. doi: 10.1016/j.chembiol.2010.05.012. [DOI] [PMC free article] [PubMed] [Google Scholar]
- Xiao J, Marugan JJ, Zheng W, Titus S, Southall N, Cherry JJ, Evans M, Androphy EJ, Austin CP. Discovery, Synthesis, and Biological Evaluation of Novel SMN Protein Modulators. J Med Chem. 2011;54:6215–6233. doi: 10.1021/jm200497t. [DOI] [PMC free article] [PubMed] [Google Scholar]
- Yasgar A, Shinn P, Jadhav A, Auld D, Michael S, Zheng W, Austin CP, Inglese J, Simeonov A. Compound Management for Quantitative High-Throughput Screening. JALA (Charlottesville, Va. 2008;13:79–89. doi: 10.1016/j.jala.2007.12.004. [DOI] [PMC free article] [PubMed] [Google Scholar]
- Younis I, Berg M, Kaida D, Dittmar K, Wang CL, Dreyfuss G. Rapid-Response Splicing Reporter Screens Identify Differential Regulators of Constitutive and Alternative Splicing. Molecular and Cellular Biology. 2010;30:1718–1728. doi: 10.1128/MCB.01301-09. [DOI] [PMC free article] [PubMed] [Google Scholar]
- Zlokarnik G, Negulescu PA, Knapp TE, Mere L, Burres N, Feng L, Whitney M, Roemer K, Tsien RY. Quantitation of transcription and clonal selection of single living cells with beta-lactamase as reporter. Science. 1998;279:84–88. doi: 10.1126/science.279.5347.84. [DOI] [PubMed] [Google Scholar]
Associated Data
This section collects any data citations, data availability statements, or supplementary materials included in this article.