Abstract
Non-invasive, easy-to-use and accurate measurements of wall shear stress (WSS) in human blood vessels have always been challenging in clinical applications. Echo particle image velocimetry (Echo PIV) has shown promise for clinical measurements of local hemodynamics and wall shear rate. So far, however, the method has only been validated under simple flow conditions.
In this study, we validated Echo PIV under in-vitro and in-vivo conditions. For in-vitro validation, we used an anatomically-correct, compliant carotid bifurcation flow phantom with pulsatile flow conditions, using optical particle image velocimetry (optical PIV) as the reference standard. For in-vivo validation, we compared Echo PIV-derived two dimensional velocity fields obtained at the carotid bifurcation in 5 normal subjects against phase-contrast MRI-derived velocity measurements obtained at the same locations. For both studies, time-dependent, two-dimensional two-component velocity vectors, peak/centerline velocity, flow rate and wall shear rate (WSR) waveforms at the common carotid artery (CCA), carotid bifurcation and distal internal carotid artery (ICA) were examined. Linear regression, correlation analysis and Bland-Altman analysis were used to quantify the agreement of different waveforms measured by the two techniques.
In-vitro results showed that Echo PIV produced good images of time-dependent velocity vector maps over the cardiac cycle with excellent temporal (up to 0.7 msec) and spatial (~0.5 mm) resolutions and quality, on par with optical PIV results. Further, good agreement was found between Echo PIV and optical PIV results for velocity and WSR measurements. In-vivo results also showed good agreement between Echo PIV velocities and PC-MRI velocities.
We conclude that Echo PIV provides accurate velocity vector and WSR measurements in the carotid bifurcation and has significant potential as a clinical tool for cardiovascular hemodynamics evaluation.
Keywords: Echo PIV, Human Carotid Artery, Blood Velocity Vector, Wall Shear Rate, Wall Shear Stress, Atherosclerosis, Ultrasound Contrast Agents, Validation
INTRODUCTION
Atherosclerosis, a systemic disease process in which fatty deposits, inflammation, cells, and scar tissue build up within the walls of arteries, is the underlying cause of the majority of clinical cardiovascular events (Cunningham and Gotlieb 2005; Lloyd-Jones et al. 2009; Ohira et al. 2006). Locations of focal atherosclerotic lesions have been shown to correlate with locations of local blood flow disturbance, and more specifically to locations of low or oscillatory fluid shear stress at the arterial wall (Carallo et al. 1999; Giddens et al. 1993; Gnasso et al. 1997; Ku and Giddens 1983; Ku et al. 1985; Shaaban and Duerinckx 2000; Stokholm et al. 2000; Zarins et al. 1983; Zarins et al. 2001). However, accurately and easily measuring wall shear stress (WSS) in vivo remains problematic.
Wall shear stress is typically obtained in-vivo by measuring axial velocities close to the vessel lumen and computing the wall shear rate (WSR), after which WSS is obtained by assuming high shear conditions for blood flow and using the Newtonian value for blood viscosity. Although the assumption of Newtonian rheology can be problematic for a shear-thinning fluid such as blood, it has been commonly used for flow in large- and medium-size blood vessels (pre arteriolar) and is generally well-accepted. Certainly, this approach is vastly superior to the current Doppler-based approach of simply measuring centerline velocity and assuming a parabolic velocity profile to calculate WSS (Gelfand et al. 2006; Gnasso et al. 1996; Nowak 2002; Oshinski et al. 2006). In this regard, phase-contrast magnetic resonance imaging (PC-MRI) has shown promise since it provides WSR accurately (Cheng et al. 2002; Oyre et al. 1998; Taylor et al. 2002). However, PC-MRI is limited for routine WSR or WSS measurements due to relatively long data-collecting times (2~5 minutes for each slice), poor temporal resolution (15~30 msec), inherent cumbersomeness, and high cost.
In recent years, many novel ultrasound-based techniques have emerged to overcome some of the typical Doppler limitations such as angle dependence. Vennemann et al. (Vennemann et al. 2007) and Hoskins (Hoskins 2010) reviewed many of these methods. Since the time period covered by these reviews, there has been a few additional methods proposed. Hansen et al. and Udesen et al. (Hansen et al. 2009; Udesen et al. 2008) proposed a method called plane wave excitation (PWE), which applies speckle tracking algorithms (Crapper et al. 2000) to detect 2D speckle displacements from two ultrasound images. The PWE method has been evaluated against phase-contrast MRI in measuring volumetric flow rate in a human carotid artery showing a mean underestimation of the PWE about 9% for flow measurement. One of the big limitations of the PWE method is its degraded contrast of B mode images compared to conventional B mode imaging, which makes it difficult to get reliable velocity measurements. Thus, temporal averaging of 40 images was necessary to improve the quality of velocity mapping, which decreased the temporal resolution to approximately 10 ms. Beulen et al. (Beulen et al. 2010; Beulen et al. 2010) proposed a technique termed ultrasonic perpendicular velocimetry (UPV), which applies cross-correlation on raw RF data to detect velocity components perpendicular to the ultrasound beam. The in-vitro validation on UPV against theoretical solutions and computational fluid dynamics (CFD) simulations in straight tube and curved vessels showed good accuracy of this technique. However, UPV uses a relatively large interrogation window size (about 4.4 mm) perpendicular to the beam direction, which limits its spatial resolution. Another limitation of UPV may be the low signal to noise ratio of speckles from red blood cells. The clinical feasibility of UPV remains unclear.
We have been working on the development and improvement of Echo particle image velocimetry (Echo PIV) over the last five years. Echo PIV enables the measurement of multi-dimensional and multi-component velocity vectors in opaque flows (Edmond et al. 1995; Kim et al. 2004; Liu et al. 2008; Zhang et al. 2008; Zheng et al. 2006). Advantages of this technique include ease of use, simple implementation using commercially available ultrasound imaging systems and probes, low cost, high temporal resolution (up to 0.7 msec in the current system), and good spatial resolution (up to 0.5 mm in the current system). Echo PIV has shown its capability in quantifying flow patterns in human left ventricles (Hong et al. 2007; Hong et al. 2007; Kheradvar et al. 2010; Sengupta et al. 2007), however there is no or little validation on those measurements.
Certainly validation of Echo PIV is essential before it is applied clinically. In validation studies using simple in-vitro flow models, Echo PIV was shown to be accurate for velocity and WSR/WSS measurements (Kim et al. 2004; Liu et al. 2008; Zheng et al. 2006). Although the flow models used in these studies were non-physiologic, results from these early validation studies provided confidence to begin considering Echo PIV for clinical measurements, specifically for measuring velocity vectors and WSR in blood vessels. The next step was assessing if Echo PIV could in fact provide accurate results using more anatomically-correct models and flow conditions. This paper presents the results of a study to further validate Echo PIV against the gold-standard of optical PIV using an anatomically-correct, elastic model of carotid bifurcation under pulsatile flow conditions. Before this study some changes were performed to the Echo PIV technique, which are summarized here. First, the Echo PIV algorithm was improved to enhance its accuracy and reliability. A customed RF filtering technique was employed to reduce the noise level of echo particle images, and advanced PIV algorithms, including adaptive window offset, sub-pixel interpolation and vector field filtering were introduced. The details were discussed in another manuscript (Zhang et al. 2010). Second, this study uses an anatomically-correct carotid compliant model instead of the simplified and non-compliant flow models used in previous studies. The geometrical complexity of the model and its compliance lead to the generation of complicated flow fields in the carotid model, particularly in the bifurcation area. Third, our previous studies on Echo PIV mainly focused on validations of this technique in either temporal or 2D spatial domain. This study, for the first time, validated Echo PIV against Optical PIV in both temporal and 2D spatial domains simultaneously. Fourth, the compliant model in this study provided the opportunity to develop and validate segmentation techniques for tracking artery wall motion (Zhang et al. 2009). Fifth, the Echo PIV system used in this study was different from those in previous studies. Specifically, the system was improved to provide better control of data acquisition parameters and enhanced temporal resolution (up to 0.7 msec).
With the confidence from in-vitro validation study on carotid artery model, we further explored the feasibility of Echo PIV in human subjects. We used Echo PIV to obtain detailed velocity vectors and flow rates from carotid artery in 5 normal human subjects, and compared these results to phase-contrast MRI (PC-MRI) measurements in the same subjects. Good agreement was found between Echo PIV and PC-MRI measurements.
METHODS
In-Vitro Validation
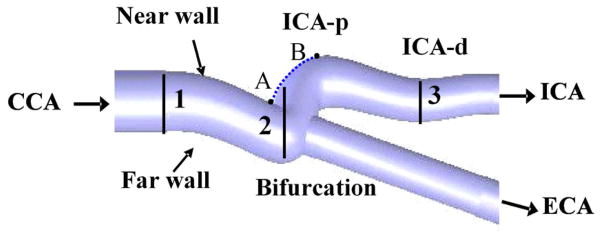
An anatomically-correct carotid bifurcation model was used for the in-vitro validation study. The dimensions of the carotid bifurcation model used in this study were obtained from one human adult male by bi-plane angiography. The carotid model geometry was collected through an institutionally approved human subject research study at the University of Colorado. Information from this scan was used to reconstruct a 3D carotid model using CAD software. A 1.5X silicone model was constructed using rapid prototyping (Stratasys, Inc®, Eden Prairie, MN, USA), as shown in Figure 1. The selection of silicone rubber as the material provides the compliance of the carotid model, and its close-to-water refraction index (1.44 vs. 1.33 at 20 °C at λ = 589.3 nm) reduces the optical reflection at the water-model boundaries. The length of the model was approximately 120 mm, and the distance from the entrance of the common artery to the bifurcation point was approximately 50 mm. The mean inner diameters of common carotid artery (CCA), internal carotid artery (ICA) and external carotid artery (ECA) were 11.1 mm, 8.9 mm and 8.5 mm respectively.
Figure 1.
Schematic of the human carotid artery model showing the nomenclature used in the text and measurement positions. (1) CCA- common carotid artery; (2) carotid bifurcation; (3) ICA-p – proximal internal carotid artery; ICA-d – distal internal carotid artery.
Flow Conditions
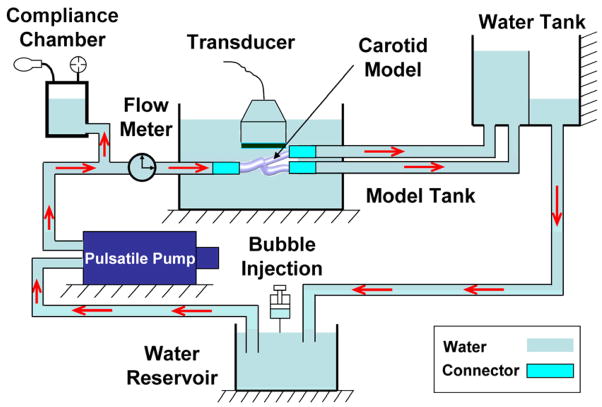
In this study, the working fluid was deionized water (at 20 °C). As shown in Figure 2, fluid from an upstream reservoir was delivered by a pulsatile pump (Model 55-3305, Harvard Apparatus, Holliston, MA, USA) into a compliant chamber, and the carotid artery. A constant head-pressure tank located distal to the test section maintained constant downstream pressure. The model tank was filled with water to enhance acoustic coupling between the ultrasound transducer and the artery model.
Figure 2.
Schematic of the experimental setup. Red arrows represent the flow direction.
Flow conditions in the model were adjusted to obtain a systolic peak velocity (70 cm/s) similar to physiological values seen in the common carotid artery (CCA) of healthy people (Azhim et al. 2008; Meyer et al. 1997) at a heart rate of 75 beats/min. The mean Reynolds number (averaged over cardiac cycle) was approximately 1700, estimated from the averaged CCA diameter D of 11.1 mm, a mean volumetric flow rate of 930 mL/min, and the kinematic viscosity of 1.0×10⁻⁶ m2/s for water at 20 °C (Serway 1996). The Womersley number was calculated as 15.6 in this study using where ω is the angular frequency in rad/s and R is the radius of common carotid artery. Although both the Reynolds and Womersley numbers here are larger than those typically found in the human carotid (due to the low viscosity of water in comparison to blood), this did not produce a material impact on our study since our primary evaluation was whether Echo PIV could accurately measure velocities in a pulsatile, compliant system with physiologic branching; therefore, performing accurate kinematic scaling in this situation was less important. A bulk flow meter (Model T109, Transonics Inc., Ithaca, NY, USA) mounted upstream of the carotid artery was used for real-time monitoring of flow rate.
Particle Seeding
A commercially available ultrasound contrast agent (Optison™, GE Healthcare, Princeton, NJ, USA) was injected into the reservoir upstream of the carotid model, as shown in Figure 2. Microbubble seeding was performed as previously described (Liu et al. 2008). Cornstarch was used as the scattering particles for optical PIV. Neither the optical particles nor ultrasound contrast agents were present in sufficient quantity to change the flow properties.
Optical PIV Measurements
Optical PIV is a mature fluid-dynamics measuring tool, typically considered the gold-standard for non-intrusive measurements of velocity fields (Foeth et al. 2006; Legrand et al. 2010; Stokes et al. 2001). It was used to obtain reference results for validating the Echo PIV measurements. A TSI PIVCAM® 13-8 CCD (1280×1024 pixel resolution) camera synchronized to a dual-head Nd:YAG pulse laser (TSI Incorporated, Shoreview, MN, USA) was used to obtain optical particle images. The TTL pulse from the pulsatile pump was used to trigger the firing of laser and image acquisition in each cardiac cycle. Each cardiac cycle was divided into a total of 17 time points, and 50 pairs of images were acquired at each time point. Optical PIV analysis methods utilized were standard techniques; further details can be found elsewhere (Keane and Adrian 1992; Quenot et al. 1998; Westerweel 1997). In this study, a final 36×24 (pixel) interrogation window with 60% overlapping was used in PIV analysis, which yields a spatial vector grid of 0.75×0.50 (lateral by axial) mm2. The selection of the interrogation window size in Optical PIV was made to match that in Echo PIV analysis. At each time point, a total of 50 instantaneous velocity vector fields were extracted and ensemble-averaged to obtain the final velocity vector map at each time point. Vector filtering techniques were employed to reduce the variance of velocity estimation (Zhang et al. 2010).
Echo PIV Measurements
Echo PIV measurements were obtained at the CCA, bifurcation and ICA separately using custom-built hardware (Illumasonix LLC, Boulder, CO, USA). In this study, the following frame rates were used: 680, 621 and 594 frames per second (FPS) for CCA, bifurcation and ICA measurements respectively (contrast-enhanced flow can be seen in Movie 1).
The carotid artery model was made from flexible, transparent silicone to allow physiological dilation and contraction over the cardiac cycle while also allowing optical access for optical PIV studies. In this study, a total of 10 cycles were ensemble-averaged to produce local mean velocity vectors. A final interrogation window of 26×14 (pixel) was used with an overlap ratio of 0.6 for the Echo PIV analysis, corresponding to a spatial vector grid of 0.87×0.47 mm2, comparable to that of optical PIV.
The post-processing PIV data (for both echo and optical methods) involves vector field filtering (customed global, local and signal to noise ratio filter). The same post-analysis was used in both echo and optical PIV analysis. The details of those filters are described in another manuscript being prepared for publication (Zhang et al. 2010).
Calculation and Comparison of Hemodynamics Profiles
The vessel lumens in both echo and optical particle images were automatically segmented using custom algorithms developed by our group (Zhang et al. 2009). The two-dimensional velocity vector fields were obtained by applying custom PIV algorithms (Illumasonix LLC, Boulder, CO, USA) on segmented echo and optical particle images, separately. The peak/centerline velocity waveforms were extracted from the 2D velocity vector fields. The flow rate waveforms were calculated by integrating the radial velocity profiles over the diameter of the artery, and were spatially averaged over 5 mm along the longitudinal direction, for both echo and optical PIV. The wall shear rate (WSR) waveforms were obtained using 3 point (including the zero-velocity point at wall) polynomial fitting of near wall velocities (Kim et al. 2004), and were also spatially averaged over 5 mm along the longitudinal direction assuming steady WSS in common carotid artery.
Velocity waveforms from Echo PIV data (about 500 time points per cardiac cycle) were phase-averaged over 10 cardiac cycles, and expressed as mean ± SD. The waveforms of optical PIV were sampled at 17 time points in one cardiac cycle, and phase-averaged over 50 cardiac cycles. Linear regression, correlation, and Bland-Altman analyses (Bland and Altman 1986) were used to evaluate agreement between the two techniques.
Clinical feasibility study in healthy human volunteers
Clinical pilot study was done by comparing Echo PIV measurements of human carotid arteries against PC-MRI measurements of the same vessels. The clinical study was performed at the University of Exeter, Devon, UK, after approval by the United Kingdom National Health Service Research Ethics Committee and the Royal Devon and Exeter NHS Foundation Trust. Participants were screened for contraindications to the ultrasound contrast agent (Sonovue, Bracco Diagnostics, Italy) and the presence of a patent foramen ovale. Five volunteers (three males, two females) were enrolled in this pilot study. Echo PIV data were collected using customized hardware (Illumasonix LLC, Boulder, CO) at 500–700 frames per second for at least 8 cardiac cycles. Following the infusion of contrast agents participants were monitored for 30 minutes before being discharged.
Phase-contrast MRI was employed to provide reference results. PC-MRI was performed using a 1.5 Tesla contrast-enhanced fast field echo (T1-FFE) gradient echo sequence (Intera, Philips Medical Systems) to obtain retrospectively-gated tissue intensity and phase velocity maps. Participants underwent the MRI study on a separate visit within four weeks of the Echo PIV visit, around the same time of the day, and after an overnight fast. The voxel size of MRI scanning was ~1.0×1.0 mm2 in the cross-sectional plane of carotid artery. Slice thickness was 6.0 mm and slices were spaced at 6.0 mm. Temporal interpolation was used to obtain approximately 60 frames per cardiac cycle.
Echo PIV and MRI data were recorded with volunteers in supine positions, after resting, and were carried out by two experienced radiologists.
RESULTS
In vitro validation of Echo PIV against optical PIV
Comparisons between Echo and optical PIV were carried out at three different locations: CCA, carotid bifurcation and ICA, at planes 1, 2 and 3, respectively, as shown in Figure 1.
A. Temporally-resolved spatial-peak velocity waveforms
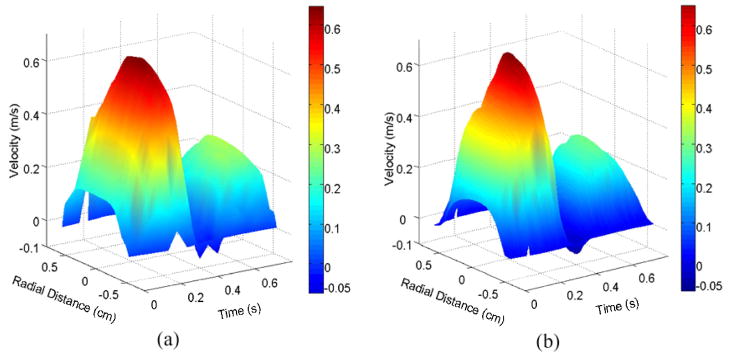
Figure 3 shows a spatio-temporal velocity profile versus radial position and cardiac time in the common carotid artery at plane 1, as measured by optical PIV (left panel) and Echo PIV (right panel). Velocity increases positively on the vertical scale, time increases from left to right horizontally, and radial position varies from near wall (negative) to far wall (positive). Significant similarity is seen between both plots. A systolic peak velocity was found around 70 cm/s, and a diastolic peak velocity of 30 cm/s was seen (See Movie 2).
Figure 3.
Three-dimensional plot of axial flow velocity in the CCA vs. radius and time: (a) optical PIV measurement and (b) Echo PIV measurement.
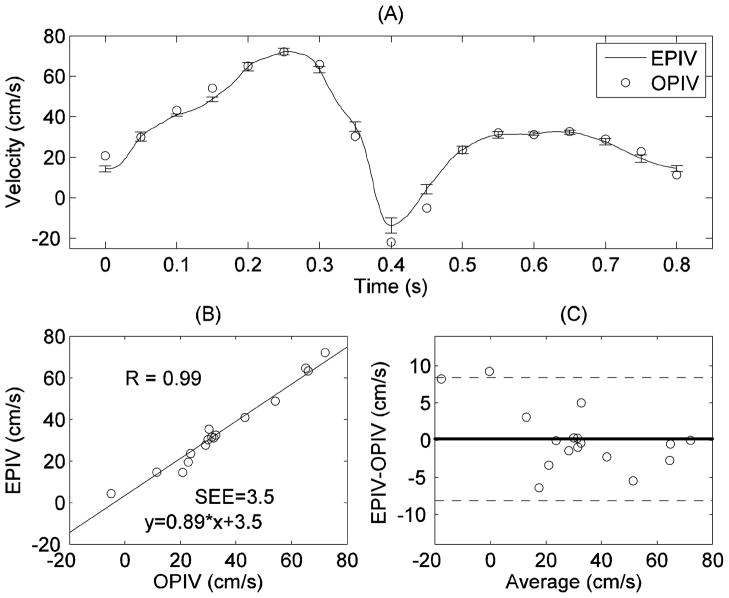
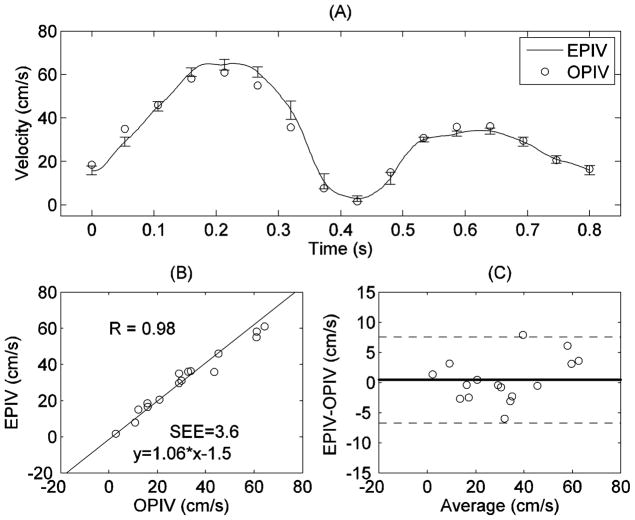
Figures 4~6 show the comparison of temporal-resolved spatial-peak velocity waveforms obtained from Echo and optical PIV at planes 1~3, respectively. The relatively small standard deviations (error bar as shown in Figure 4(A)) indicate low cycle-to-cycle variability in Echo PIV measurements over multiple cardiac cycles. Linear regression and correlation analysis showed high correlation between Echo PIV and optical PIV data (EPIV = 0.89*OPIV+3.5, r=0.98; (Figure 4(B))); the standard error of estimate (SEE) is approximately 3.5 cm/s. Further, Bland-Altman agreement analysis (Figure 4(C) showed good agreement between the two measurements, albeit with a slight bias for Echo PIV.
Figure 4.
Comparison of peak velocity measurements in the CCA by Echo and optical PIV: (A) peak velocity vs. time; (B) correlation analysis; (C) Bland-Altman analysis. The error bars in (A) represent the standard deviations of Echo PIV measurement from multiple cardiac cycles. This is the same for all subsequent plots.
Good quantitative agreement was also found between Echo and optical PIV measurements at the carotid bifurcation. Figure 5 shows comparison of centerline velocities within the bifurcation measured by Echo and optical PIV. Both linear regression (EPIV = 1.06*OPIV-1.5, r=0.98) and Bland-Altman analysis showed good agreement between the two techniques at this location. Similar results were seen for velocities in other regions of the bifurcation.
Figure 5.
Comparison of centerline velocity measurements at the bifurcation (at plane 2 in Figure 1) by Echo and optical PIV: (A) centerline velocity vs. time; (B) correlation analysis; (C) Bland-Altman analysis.
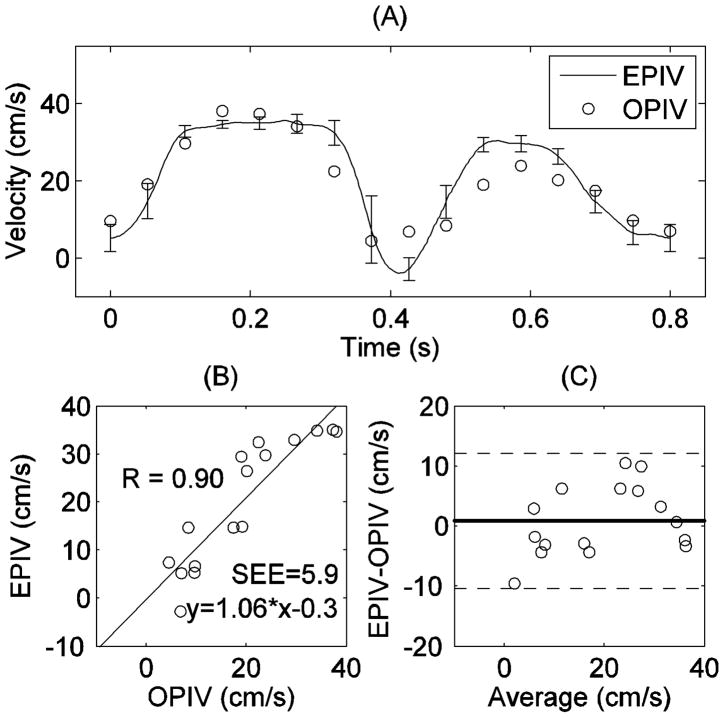
Figure 6 shows a comparison of peak velocity within the distal ICA measured by both Echo and optical PIV. As in the proximal and bifurcation areas, Echo PIV showed good agreement to optical PIV for the distal ICA as well, although the discrepancy appears to be a little bit higher. This might be explained by the fact that helical flow exists in the internal carotid artery (Picot et al. 1993). Both regression (EPIV = 1.06*OPIV-0.3, r=0.90) and agreement (Bland-Altman) analyses show reasonable agreement.
Figure 6.
Comparison of peak velocity measurements in ICA by Echo and optical PIV: (A) peak velocity vs. time; (B) correlation analysis; (C) Bland-Altman analysis.
B. Radial velocity profiles and flow waveforms
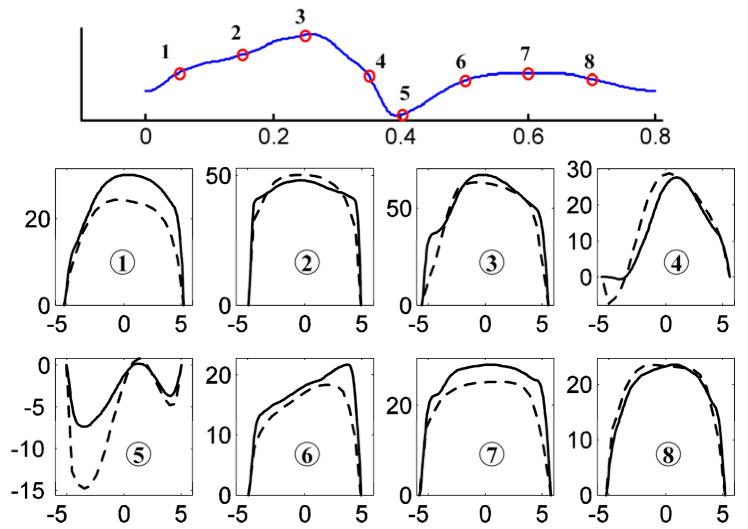
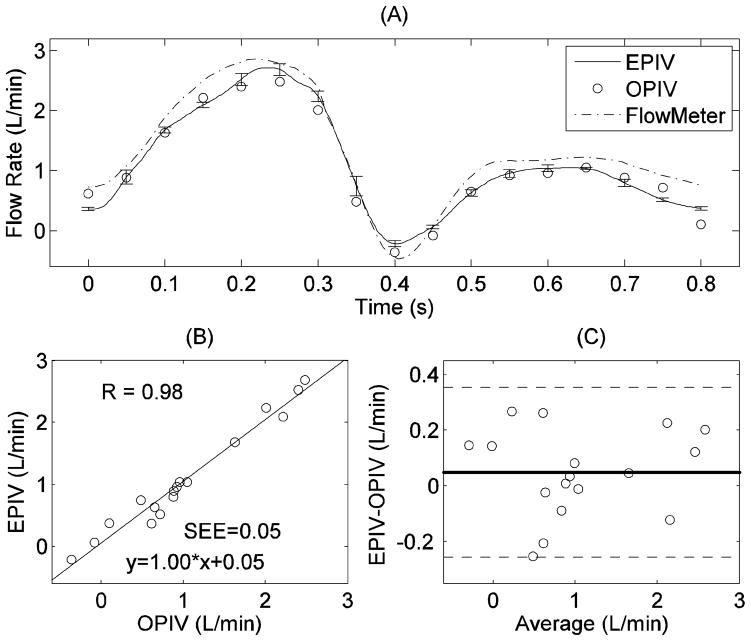
Figure 7 shows a comparison of radial velocity profiles measured by the two techniques (at plane 1 in Figure 1) at different time points during cardiac cycle. Overall, the Echo PIV measurements show good agreement with optical PIV. It is clear from Figure 7 that the close-to-wall velocity shows better agreement at far wall than at near wall, mainly because the near wall region suffered from acoustic reflection artifacts. Figure 8 shows flow rates obtained from Echo PIV, optical PIV and flow meter measurements, again indicating reasonable agreement (EPIV = 1.00*OPIV+0.05, r=0.98).
Figure 7.
Radial velocity profiles at plane 1 (Fig. 1) at eight time points during one cardiac cycle, measured by both Echo (solid line) and optical PIV (dash line). The x axis represents radial position (in mm), with negative values representing radial locations toward the near wall and positive toward the far wall; the y axis represents velocity (in cm/s).
Figure 8.
Comparison of flow rate measurement in the CCA by Echo PIV and optical PIV: (A) flow rate versus time; (B) correlation analysis; (C) Bland-Altman analysis.
C. Two-dimensional two-component velocity vector field at carotid bifurcation
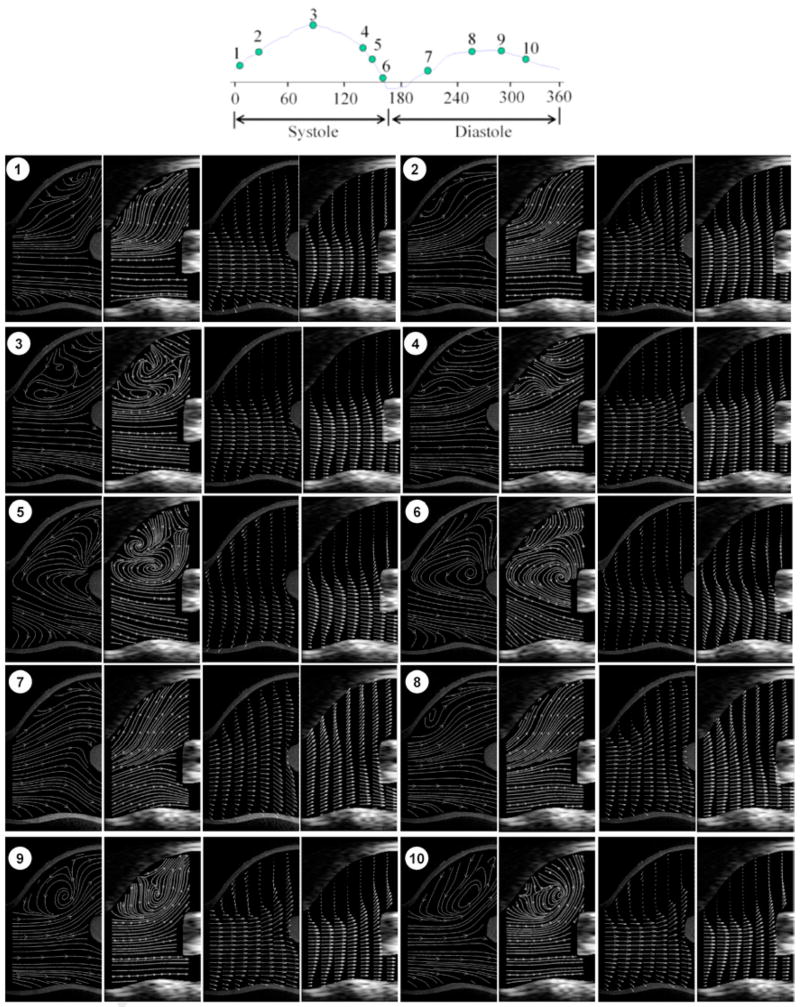
Figure 9 shows velocity vector fields and streamline plots within the carotid bifurcation at 10 phase (what about using time instead of phase?) points during one cycle, measured using both Echo and optical PIV. As can be appreciated, the flow fields are complex, involving large velocity gradients, recirculatory flow, and non-uniform velocity vectors; further, the flow field changes significantly through the cardiac cycle. During early systole (phase 1~3), the flow remains laminated. Shortly after peak systole, a reverse flow region develops at the near wall of carotid sinus and grows during the late systolic (phase 4~6). The shift from forward, laminated flow to reverse, recirculating flow occurs abruptly, in less than 44 msec. Such changes continue to occur through diastole. Such phenomena are similar to those reported by Ku et al in 1985 (Ku et al. 1985), using laser Doppler anemometry. Overall, Echo and optical PIV were comparable in their ability to capture the complex velocity field characteristics seen the carotid bifurcation area.
Figure 9.
Velocity vector and streamline plots in the carotid bifurcation region at different time points during one cardiac cycle: the plots in each part are optical streamline, echo streamline, optical velocity vector and echo velocity vector. Note that a phase of 360 degrees corresponds here to a cardiac cycle of 0.8 s. For visualization purposes, the density of velocity vectors in longitudinal direction was reduced by 2.
D. Wall shear rate measurement
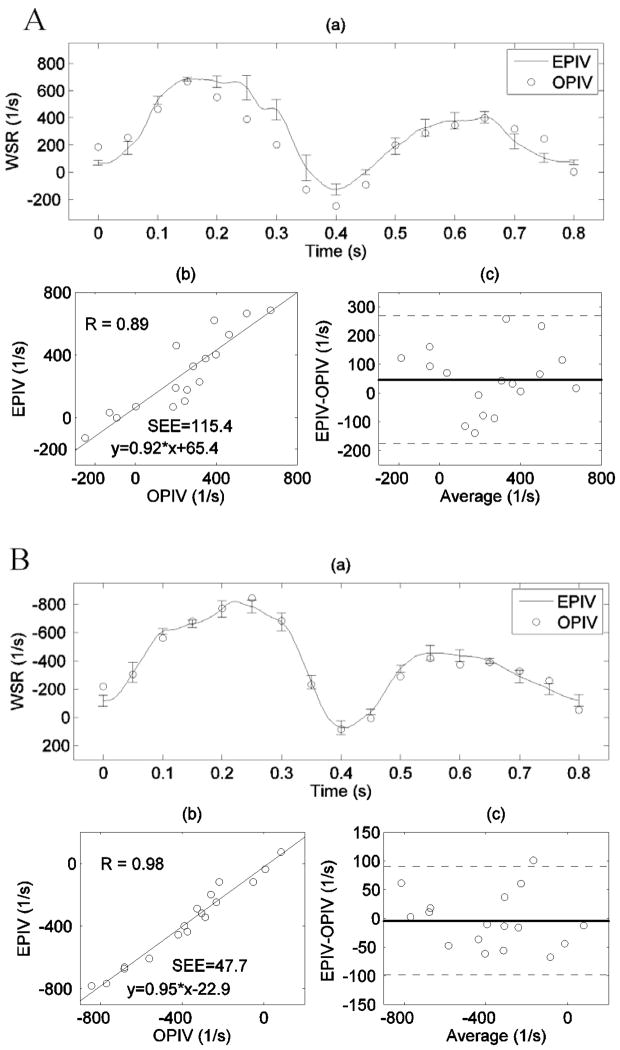
WSR measurements by Echo and optical PIV showed good agreement at both near and far walls of the CCA, as shown in Figure 10. The comparison on the WSR yields slightly better agreement at the far wall (r=0.98, SEE = 47.7 1/s, Figure 7A(b)) than at the near wall (r=0.89, SEE = 115.4 1/s, Figure 7B(b)). This difference was previously observed on the radial velocity profiles as well (Figure 7). Near wall artifacts (see Movie 1) were more common in the Echo PIV backscatter data, which may explain this discrepancy.
Figure 10.
Wall shear rate measurements by both Echo and optical PIV in the CCA: (A) at the near wall; (B) at the far wall. (a) Time-dependent WSR waveforms measured by Echo and optical PIV, error bars denote standard deviations; (b) Linear regression between measurements from the two techniques; (c) Bland-Altman analysis, with dashed lines representing ±2SD deviation from the mean difference. SEE denotes the standard error of the estimate.
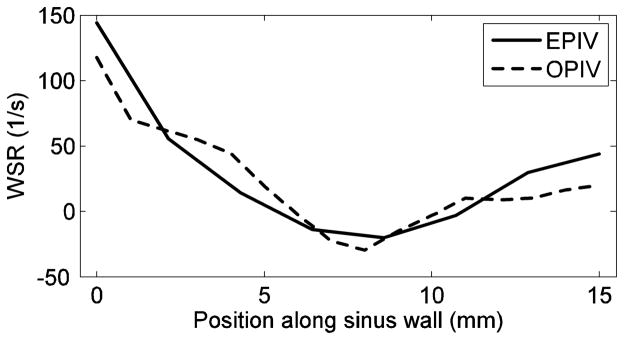
It was also found that the temporal-mean (over cardiac cycle) WSR along the carotid bulb (from A to B in Figure 1) gradually decreases and then increases slowly, with a minimal value approximately at the middle point of the sinus wall, as shown in Figure 11. Both Echo and optical PIV show similar patterns; further, quantitative agreement is also good.
Figure 11.
Temporal-mean wall shear rate along the carotid sinus wall (from A to B in Figure 1) measured by both Echo and optical PIV.
Clinical feasibility study in healthy human volunteers
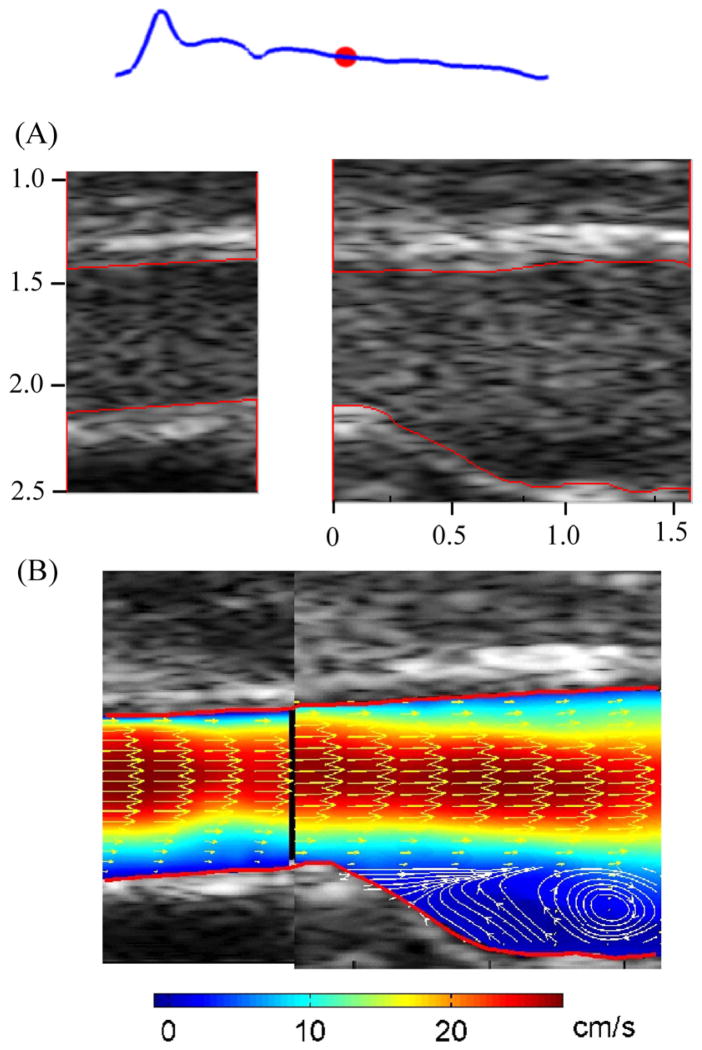
Figure 12(A) shows the B mode images with microbubbles flowing through CCA and carotid bulb of one volunteer during diastole; the red dot on the waveform represents the relative phase. The lumen, as outlined in red, was detected using a semi-automated algorithm (Zhang et al. 2009). The velocity vectors are shown in Figure 12(B), with colors denoting velocity magnitudes. Velocity vectors were down-sampled by 2 in the longitudinal directions for display purposes. The vortex flow at the carotid bulb is clearly indicated by the superimposed streamlines; the vortex was seen throughout most of diastole, and rarely in systole.
Figure 12.
Microbubble images (A) and velocity vector map (B) from right carotid artery of one subject. The red lines indicate the auto-detected vessel boundaries; colors in velocity vector map denote the velocity magnitude; the streamlines were superimposed on velocity vector map at carotid bulb region.
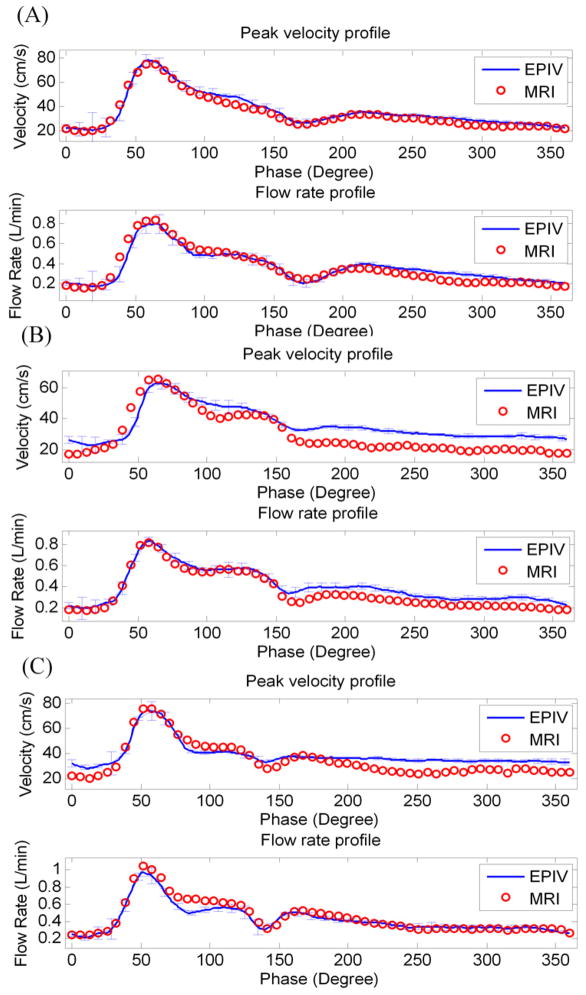
In order to evaluate the accuracy of Echo PIV measurements, the peak velocity and flow rate integrated from radial velocity profiles in CCA were compared against PC-MRI measurements. The mean absolute error (Mean±SD) in percentage, calculated as the absolute difference divided by the average of measurements by the two techniques, was found to be 9.6%±4.5% for velocity measurement, and 4.1±1.2% for volumetric flow measurement. Representative results for 3 of the subjects are shown in Figure 13. The error bars in each subfigure represent standard deviations of Echo PIV measurements from multiple cardiac cycles. Overall, Echo PIV measurements agreed well with PC-MRI.
Figure 13.
Three representative comparisons of velocity and flow rate waveforms obtained in human carotid vessels by Echo PIV and PC-MRI.
DISCUSSION
Simple non-invasive and accurate measurements of local hemodynamics within the human cardiovascular system may be valuable as a means of quantitatively evaluating local hemodynamics and specifically local wall shear rate (WSR) and wall shear stress (WSS). Changes in WSS are increasingly considered one of the causative factors in the development and possibly the rupture of focal atherosclerotic lesions (Caro and Fitz-Gerald 1969; Friedman et al. 1981; Taxon 1995). Current methods of measuring WSS including ultrasound Doppler and phase-contrast MRI have several inherent problems that limit their use (Zhang et al. 2009).
Results from our previous experiments showed that Echo PIV can generate accurate velocity vector fields in simple opaque flow conditions (Kim et al. 2004; Liu et al. 2008; Zheng et al. 2006). For this study, we chose to extend our prior work to evaluate the capability of Echo PIV for quantifying velocity vector fields and WSR in an in-vitro experimental setting using a compliant carotid artery model under pulsatile flow settings, and then in clinical settings on human carotid artery. Our in-vitro and in-vivo results established Echo PIV as a valid tool for WSS/WSR measurement, especially since the traditional method to calculate WSS (Oshinski et al. 2006; Reneman et al. 2006; Tangelder et al. 1988) may not produce accurate results given its assumption of a parabolic velocity profile, which is not present in vivo. Both non-parabolic profiles and asymmetry in cross-sectional velocity were observed in our clinical Echo PIV measurements.
In recent years, a few blood velocimetry techniques have emerged, each of which, compared to Echo PIV, has advantages and disadvantages. As mentioned in the Introduction section, the PWE method utilizes the cross-correlation to estimate 2D vector velocity of the blood from ultrasound images obtained by plane wave (non-focusing) ultrasound imaging. The plane wave imaging technique provides acquisition of blood speckle images with very high frame rate, however the SNR is lower than the conventional ultrasound images. Thus, temporal averaging of 20~40 frames was necessary to obtain reliable velocity vector estimation (Hansen et al. 2009; Udesen et al. 2008). The preliminary clinical study showed that the PWE method has better performance than traditional speckle tracking method, mainly because the decorrelation of speckle patterns decreases by virtue of the high frame rate of PWE. The PWE has an advantage of no need of contrast agents when compared to Echo PIV, however, its temporal resolution is much lower (10 ms vs. 1 ms) due to its necessity of temporal averaging. The UPV method proposed by Beulen et al. showed its feasibility of estimating velocity component perpendicular to ultrasound beam direction through in vitro validation studies (Beulen et al. 2010; Beulen et al. 2010). Like the PWE, the UPV technique detects the speckles from RBC, thus no contrast agents are necessary. However, the clinical efficacy of the UPV remains unclear since the backscatters from RBCs are very weak in clinical environment, roughly about 60 dB lower than that from vessel wall (Beulen et al. 2010). In contrast, we found that the echo signals from contrast agents are only about 15~25 dB lower than the vessel wall signals, suggesting a much higher SNR of microbubbles than RBCs. This mainly explains the good results of the preliminary human study on Echo PIV. In addition, red blood cell may experience aggregation and non-uniform echogenicity problem (Paeng et al. 2004; Paeng et al. 2004), which may have adverse effects on velocity accuracy. The contrast agents, in contrast, appear to show more uniform backscatters, assuming the microbubbles are well prepared, as observed in our echo particle images in human carotid artery.
Increasing temporal and spatial resolution provides the most reliable means of ensuring accurate and high quality Echo PIV data. In this regard, there is a large difference between using customized hardware and controlling software and using commercially available ultrasound systems to perform Echo PIV, since optimal Echo PIV measurements require substantial control of acoustic aperture, beam overlap, transducer firing patterns, and other front-end elements although these are all easily implemented on existing ultrasound platforms. Further, tight coupling between the combination of front-end parameters and backscatter analysis is needed since Echo PIV imposes very different criteria for optimal backscatter and images than those for typical clinical contrast imaging. High frame rate not only provides a superior temporal resolution of Echo PIV but also enables resolution of the velocity vector field with high spatial resolution.
Although Echo PIV initially shows its feasibility in human clinical study, it is necessary to mention that there are some limitations and/or difficulties associated with Echo PIV that have to be considered before the next running of clinical study. First, from this preliminary clinical study, it was observed that the preparation of contrast agent thus a uniform of microbubble stream flowing through carotid artery is crucial to get high quality echo particle images, which determines the accuracy and reliability of velocity measurements. Shaking of the vial has to be thorough and vigorous in order to have lyophilisate completely dissolved, but not to be too intense to burst microbubbles. The concentration of microbubble is also essential to have good quality of echo particle images. Over- or under-concentrated microbubbles may both cause the deterioration of image quality from our in-vitro experiences (Zhang et al. 2007; Zheng et al. 2006), although this issue hasn’t been carefully studied in the preliminary clinical studies. A 2.4 mL bolus injection followed by a 10 mL saline flush worked well at least in this study. Second, the applicability of Echo PIV in patients with atherosclerotic plaques remains unclear, since the dynamic range of velocity in carotid artery of those patients expects to be very high. In order to obtain a higher dynamic range for Echo PIV measurement, the field of view has to be compensated. The effects of plaques on the echogenicity of microbubbles are unknown yet. In addition, the segmentation of carotid plaque is challenging for ultrasound images, which affects the accuracy of WSS measurement. Third, obesity may be another challenging issue for Echo PIV application. It is expected that the excess of fatty tissue deteriorates the SNR of the echo particle images, thus it is not surprising that the efficacy of Echo PIV in obesity patients may be affected. Quantitative studies on this issue are expected.
CONCLUSIONS
We have shown that our newly developed ultrasound velocimetry technique (Echo PIV) provides accurate measurements of instantaneous and time-dependent blood velocity vector fields in a carotid artery model. Early-stage results from a clinical study on human carotid arteries form five subjects also showed good agreement against PC-MRI measurements. Given that ultrasound contrast agents are now increasingly used in clinical imaging labs worldwide, Echo PIV may become useful as a simple, inexpensive tool for performing functional vascular measurements and establishing vascular profiles.
Acknowledgments
This work was made possible by grants from the National Science Foundation (NSF) (CTS-0421461) and NIH (HL 67393& 072738). The authors would like to thank Dr. Jean R. Hertzberg, Dr. Kendall Hunter and Dr. Adel Younoszai for valuable discussions and technical assistance on experiments.
Footnotes
Publisher's Disclaimer: This is a PDF file of an unedited manuscript that has been accepted for publication. As a service to our customers we are providing this early version of the manuscript. The manuscript will undergo copyediting, typesetting, and review of the resulting proof before it is published in its final citable form. Please note that during the production process errors may be discovered which could affect the content, and all legal disclaimers that apply to the journal pertain.
References
- Azhim A, Utsunomiya Y, Akioka K, Akutagawa M, Yoshizaki K, Obara S, Nomura M, Tanaka H, Kinouchi Y. Influence of aging and gender on blood velocity in the human common carotid artery, accounted for by body size. Journal of Aging and Physical Activity. 2008;16:S30–S31. [Google Scholar]
- Beulen B, Bijnens N, Rutten M, Brands P, van de Vosse F. Perpendicular ultrasound velocity measurement by 2D cross correlation of RF data. Part A: validation in a straight tube Experiments in Fluids. 2010 [Google Scholar]
- Beulen B, Bijnens N, Rutten M, Brands P, van de Vosse F. Perpendicular ultrasound velocity measurement by 2D cross correlation of RF data. Part B: volume flow estimation in curved vessels Experiments in Fluids. 2010 [Google Scholar]
- Bland JM, Altman DG. Statistical-Methods for Assessing Agreement between 2 Methods of Clinical Measurement. Lancet. 1986;1:307–10. [PubMed] [Google Scholar]
- Carallo C, Irace C, Pujia A, De Franceschi MS, Crescenzo A, Motti C, Cortese C, Mattioli PL, Gnasso A. Evaluation of common carotid hemodynamic forces - Relations with wall thickening. Hypertension. 1999;34:217–21. doi: 10.1161/01.hyp.34.2.217. [DOI] [PubMed] [Google Scholar]
- Cheng CP, Parker D, Taylor CA. Quantification of wall shear stress in large blood vessels using lagrangian interpolation functions with cine phase-contrast magnetic resonance imaging. Ann Biomed Eng. 2002;30:1020–32. doi: 10.1114/1.1511239. [DOI] [PubMed] [Google Scholar]
- Crapper M, Bruce T, Gouble C. Flow field visualization of sediment-laden flow using ultrasonic imaging. Dynamics of Atmospheres and Oceans. 2000;31:233–45. [Google Scholar]
- Cunningham KS, Gotlieb AI. The role of shear stress in the pathogenesis of atherosclerosis. Laboratory Investigation. 2005;85:9–23. doi: 10.1038/labinvest.3700215. [DOI] [PubMed] [Google Scholar]
- Edmond R, Denis JL, Takahiro S, David JS, Morteza G. Imaging of flow structure within the left ventricle using non-Doppler and Doppler ultrasonography: A semiquantitative In-vitro study. Journal of the American Society of Echocardiography : official publication of the American Society of Echocardiography. 1995;8:386. [Google Scholar]
- Foeth EJ, van Doorne CWH, van Terwisga T, Wieneke B. Time resolved PIV and flow visualization of 3D sheet cavitation. Experiments in Fluids. 2006;40:503–13. [Google Scholar]
- Gelfand BD, Epstein FH, Blackman BR. Spatial and spectral heterogeneity of time-varying shear stress profiles in the carotid bifurcation by phase-contrast. Journal of Magnetic Resonance Imaging. 2006;24:1386–92. doi: 10.1002/jmri.20765. [DOI] [PubMed] [Google Scholar]
- Giddens DP, Zarins CK, Glagov S. The Role of Fluid-Mechanics in the Localization and Detection of Atherosclerosis. J Biomech Eng-T Asme. 1993;115:588–94. doi: 10.1115/1.2895545. [DOI] [PubMed] [Google Scholar]
- Gnasso A, Carallo C, Irace C, Spagnuolo V, DeNovara G, Mattioli PL, Pujia A. Association between intima-media thickness and wall shear stress in common carotid arteries in healthy male subjects. Circulation. 1996;94:3257–62. doi: 10.1161/01.cir.94.12.3257. [DOI] [PubMed] [Google Scholar]
- Gnasso A, Irace C, Carallo C, DeFranceschi MS, Motti C, Mattioli PL, Pujia A. In vivo association between low wall shear stress and plaque in subjects with asymmetrical carotid atherosclerosis. Stroke. 1997;28:993–98. doi: 10.1161/01.str.28.5.993. [DOI] [PubMed] [Google Scholar]
- Hansen KL, Udesen J, Gran F, Jensen JA, Nielsen MB. In-vivo Examples of Flow Patterns With The Fast Vector Velocity Ultrasound Method. Ultraschall in Der Medizin. 2009;30:471–77. doi: 10.1055/s-0028-1109572. [DOI] [PubMed] [Google Scholar]
- Hansen KL, Udesen J, Thomsen C, Jensen JA, Nielsen MB. In Vivo Validation of a Blood Vector Velocity Estimator with MR Angiography. Ieee Transactions on Ultrasonics Ferroelectrics and Frequency Control. 2009;56:91–100. doi: 10.1109/TUFFC.2009.1008. [DOI] [PubMed] [Google Scholar]
- Hong GR, Li P, Nguyen H, Zhao W, Liu S, Jin S, Pedrizzetti G, Tonti G, Houle H, Vannan MA, Narula J. Quantitative left ventricular flow vortex analysis is superior to conventional echo-Doppler to predict hemodynamics and symptoms in patients with systolic heart failure: A novel quantitative vorticity imaging study using contrast echocardiography and Particle Image Velocitimetry. Circulation. 2007;116:645–46. [Google Scholar]
- Hong GR, Li P, Pedrizzetti G, Sengupta P, Domenichini F, Zhao W, Houle H, Jin S, Belohlavek M, Tajk J, Chung N, Khandheria B, Narula J, Vannan M. Characterization of intraventricular blood flow vorticity in health and disease by contrast echocardiography using vector particle image velocitimetry. Journal of the American College of Cardiology. 2007;49:105a–05a. [Google Scholar]
- Hoskins PR. Haemodynamics and blood flow measured using ultrasound imaging. Proceedings of the Institution of Mechanical Engineers Part H-Journal of Engineering in Medicine. 2010;224:255–71. doi: 10.1243/09544119JEIM572. [DOI] [PubMed] [Google Scholar]
- Keane RD, Adrian RJ. Theory of Cross-Correlation Analysis of Piv Images. Applied Scientific Research. 1992;49:191–215. [Google Scholar]
- Kheradvar A, Houle H, Pedrizzetti G, Tonti G, Belcik T, Ashraf M, Lindner JR, Gharib M, Sahn D. Echocardiographic Particle Image Velocimetry: A Novel Technique for Quantification of Left Ventricular Blood Vorticity Pattern. Journal of the American Society of Echocardiography. 2010;23:86–94. doi: 10.1016/j.echo.2009.09.007. [DOI] [PubMed] [Google Scholar]
- Kim HB, Hertzberg J, Lanning C, Shandas R. Noninvasive measurement of steady and pulsating velocity profiles and shear rates in arteries using echo PIV: In vitro validation studies. Ann Biomed Eng. 2004;32:1067–76. doi: 10.1114/b:abme.0000036643.45452.6d. [DOI] [PubMed] [Google Scholar]
- Kim HB, Hertzberg J, Lanning C, Shandas R. Noninvasive measurement of steady and pulsating velocity profiles and shear rates in arteries using echo PIV: in vitro validation studies. Ann Biomed Eng. 2004;32:1067–76. doi: 10.1114/b:abme.0000036643.45452.6d. [DOI] [PubMed] [Google Scholar]
- Kim HB, Hertzberg JR, Shandas R. Development and validation of echo PIV. Exp Fluids. 2004;36:455–62. [Google Scholar]
- Ku DN, Giddens DP. Pulsatile Flow in a Model Carotid Bifurcation. Arteriosclerosis. 1983;3:31–39. doi: 10.1161/01.atv.3.1.31. [DOI] [PubMed] [Google Scholar]
- Ku DN, Giddens DP, Zarins CK, Glagov S. Pulsatile Flow and Atherosclerosis in the Human Carotid Bifurcation - Positive Correlation between Plaque Location and Low and Oscillating Shear-Stress. Arteriosclerosis. 1985;5:293–302. doi: 10.1161/01.atv.5.3.293. [DOI] [PubMed] [Google Scholar]
- Legrand M, Nogueira J, Lecuona A, Nauri S, Rodriguez PA. Atmospheric low swirl burner flow characterization with stereo PIV. Experiments in Fluids. 2010;48:901–13. [Google Scholar]
- Liu L, Zheng H, Williams L, Zhang F, Wang R, Hertzberg J, Shandas R. Development of a custom-designed echo particle image velocimetry system for multi-component hemodynamic measurements: system characterization and initial experimental results. Phys Med Biol. 2008;53:1397–412. doi: 10.1088/0031-9155/53/5/015. [DOI] [PubMed] [Google Scholar]
- Liu L, Zheng H, Williams L, Zhang F, Wang R, Hertzberg J, Shandas R. Development of a custom-designed echo particle image velocimetry system for multi-component hemodynamic measurements: system characterization and initial experimental results. PHYSICS IN MEDICINE AND BIOLOGY. 2008;53:1397. doi: 10.1088/0031-9155/53/5/015. [DOI] [PubMed] [Google Scholar]
- Lloyd-Jones D, Adams R, Carnethon M, De Simone G, Ferguson TB, Flegal K, Ford E, Furie K, Go A, Greenlund K, Haase N, Hailpern S, Ho M, Howard V, Kissela B, Kittner S, Lackland D, Lisabeth L, Marelli A, McDermott M, Meigs J, Mozaffarian D, Nichol G, O’Donnell C, Roger V, Rosamond W, Sacco R, Sorlie P, Stafford R, Steinberger J, Thom T, Wasserthiel-Smoller S, Wong N, Wylie-Rosett J, Hong Y for the American Heart Association Statistics C. Stroke Statistics S. Heart Disease and Stroke Statistics--2009 Update: A Report From the American Heart Association Statistics Committee and Stroke Statistics Subcommittee. Circulation. 2009;119:e21–181. doi: 10.1161/CIRCULATIONAHA.108.191261. [DOI] [PubMed] [Google Scholar]
- Meyer JI, Khalil RM, Obuchowski NA, Baus LK. Common carotid artery: Variability of Doppler US velocity measurements. Radiology. 1997;204:339–41. doi: 10.1148/radiology.204.2.9240517. [DOI] [PubMed] [Google Scholar]
- Nowak M. Wall shear stress measurement in a turbulent pipe flow using ultrasound Doppler velocimetry. Exp Fluids. 2002;33:249–55. [Google Scholar]
- Ohira T, Shahar E, Chambless LE, Rosamond WD, Mosley TH, Folsom AR. Risk factors for ischemic stroke subtypes - The atherosclerosis risk in communities study. Stroke. 2006;37:2493–98. doi: 10.1161/01.STR.0000239694.19359.88. [DOI] [PubMed] [Google Scholar]
- Oshinski JN, Curtin JL, Loth F. Mean-average wall shear stress measurements in the common carotid artery. Journal of Cardiovascular Magnetic Resonance. 2006;8:717–22. doi: 10.1080/10976640600723839. [DOI] [PubMed] [Google Scholar]
- Oyre S, Ringgaard S, Kozerke S, Paaske WP, Erlandsen M, Boesiger P, Pedersen EM. Accurate noninvasive quantitation of blood flow, cross-sectional lumen vessel area and wall shear stress by three-dimensional paraboloid modeling of magnetic resonance imaging velocity data. J Am Coll Cardiol. 1998;32:128–34. doi: 10.1016/s0735-1097(98)00207-1. [DOI] [PubMed] [Google Scholar]
- Paeng DG, Chiao RY, Shung KK. Echogenicity variations from porcine blood I: The “bright collapsing ring” under pulsatile flow. Ultrasound in Medicine and Biology. 2004;30:45–55. doi: 10.1016/j.ultrasmedbio.2003.08.015. [DOI] [PubMed] [Google Scholar]
- Paeng DG, Chiao RY, Shung KK. Echogenicity variations from porcine blood II: The “Bright Ring” under oscillatory flow. Ultrasound in Medicine and Biology. 2004;30:815–25. doi: 10.1016/j.ultrasmedbio.2004.03.001. [DOI] [PubMed] [Google Scholar]
- Picot PA, Rickey DW, Mitchell R, Rankin RN, Fenster A. 3-Dimensional Color Doppler Imaging. Ultrasound in Medicine and Biology. 1993;19:95–104. doi: 10.1016/0301-5629(93)90001-5. [DOI] [PubMed] [Google Scholar]
- Quenot GM, Pakleza J, Kowalewski TA. Particle image velocimetry with optical flow. Experiments in Fluids. 1998;25:177–89. [Google Scholar]
- Sengupta PP, Khandheria BK, Korinek J, Jahangir A, Yoshifuku S, Milosevic I, Belohlavek M. Left ventricular isovolumic flow sequence during sinus and paced rhythms - New insights from use of high-resolution Doppler and ultrasonic digital particle imaging velocimetry. Journal of the American College of Cardiology. 2007;49:899–908. doi: 10.1016/j.jacc.2006.07.075. [DOI] [PubMed] [Google Scholar]
- Serway RA. Physics for Scientists & Engineers. Saunders College Publishing; 1996. [Google Scholar]
- Shaaban AM, Duerinckx AJ. Wall shear stress and early atherosclerosis: A review. Am J Roentgenol. 2000;174:1657–65. doi: 10.2214/ajr.174.6.1741657. [DOI] [PubMed] [Google Scholar]
- Stokes JR, Graham LJW, Lawson NJ, Boger DV. Swirling flow of viscoelastic fluids. Part 1. Interaction between inertia and elasticity. Journal of Fluid Mechanics. 2001;429:67–115. [Google Scholar]
- Stokholm R, Oyre S, Ringgaard S, Flaagoy H, Paaske WP, Pedersen EM. Determination of wall shear rate in the human carotid artery by magnetic resonance techniques. Eur J Vasc Endovasc. 2000;20:427–33. doi: 10.1053/ejvs.2000.1221. [DOI] [PubMed] [Google Scholar]
- Taylor CA, Cheng CP, Espinosa LA, Tang BT, Parker D, Herfkens RJ. In vivo quantification of blood flow and wall shear stress in the human abdominal aorta during lower limb exercise. Ann Biomed Eng. 2002;30:402–08. doi: 10.1114/1.1476016. [DOI] [PubMed] [Google Scholar]
- Udesen J, Gran F, Hansen KL, Jensen JA, Thomsen C, Nielsen MB. High frame-rate blood vector velocity imaging using plane waves: Simulations and preliminary experiments. Ieee Transactions on Ultrasonics Ferroelectrics and Frequency Control. 2008;55:1729–43. doi: 10.1109/TUFFC.2008.858. [DOI] [PubMed] [Google Scholar]
- Vennemann P, Lindken R, Westerweel J. In vivo whole-field blood velocity measurement tech niques. Experiments in Fluids. 2007;42:495–511. [Google Scholar]
- Westerweel J. Fundamentals of digital particle image velocimetry. Measurement Science & Technology. 1997;8:1379–92. [Google Scholar]
- Zarins CK, Giddens DP, Bharadvaj BK, Sottiurai VS, Mabon RF, Glagov S. Carotid Bifurcation Atherosclerosis Quantitative Correlation of Plaque Localization with Flow Velocity Profiles and Wall Shear-Stress. Circ Res. 1983;53:502–14. doi: 10.1161/01.res.53.4.502. [DOI] [PubMed] [Google Scholar]
- Zarins CK, Xu CP, Glagov S. Atherosclerotic enlargement of the human abdominal aorta. Atherosclerosis. 2001;155:157–64. doi: 10.1016/s0021-9150(00)00527-x. [DOI] [PubMed] [Google Scholar]
- Zhang F, Barker AJ, Gates PE, Strain WD, Mazzaro L, Fulford J, Shore AC, Bellenger NG, Lanning C, Shandas R. Noninvasive Wall Shear Stress Measurements in Human Carotid Artery Using Echo Particle Image Velocimetry: Initial Clinical Studies. IEEE Ultrasonics Symposium; Roma, Italy. 2009. [Google Scholar]
- Zhang F, Lanning C, Chen JS, Shandas R. ADVANCEMENT OF ULTRASOUND-BASED OPAQUE FLOW VELOCIMETRY: STUDY ON PRE-PROCESSING and POST-PROCESSING PARAMETERS. 2010. in prepare. [Google Scholar]
- Zhang F, Lanning C, Mazzaro L, Rech B, Chen JS, Chen SJ, Shandas R. Systematic Validation of the Echo Particle Image Velocimetry Technique Using a Patient Specific Carotid Bifurcation Model. 2008 IEEE International Ultrasonics Symposium; Beijing, China. 2008. pp. 9–12. [Google Scholar]
- Zhang F, Liu LL, Zheng HR, Shandas R. Addition of particle tracking techniques to improve two-dimensional echo PIV for opaque flow measurement. ASME 2007 Summer Bioengineering Conference; Keystone, CO, USA. 2007. [Google Scholar]
- Zhang F, Murta LO, Chen JS, Barker AJ, Mazzaro L, Lanning C, Shandas R. Evaluation of Segmentation Algorithms for Vessel Wall Detection in Echo Particle Image Velocimetry. IEEE International Ultrasonics Symposium; Roma, Italy. 2009. [Google Scholar]
- Zheng H, Liu L, Williams L, Hertzberg JR, Lanning C, Shandas R. Real time multicomponent echo particle image velocimetry technique for opaque flow imaging. Applied Physics Letters. 2006;88:261915. [Google Scholar]
- Zheng HR, Liu LL, Williams L, Hertzberg JR, Lanning C, Shandas R. Real time multicomponent echo particle image velocimetry technique for opaque flow imaging. Applied Physics Letters. 2006;88:1–3. [Google Scholar]
- Zheng HR, Williams L, Liu LL, Shandas R. Effect of Contrast Microbubble Concentration on Quality of Echo Particle Image Velocimetry (Echo PIV) Data: Initial In vitro Studies. IEEE Ultrasonics Symposium; Vancouver, BC, Canada. 2006. pp. 1560–63. [Google Scholar]


