Abstract
Braille reading is a demanding task that requires the identification of rapidly varying tactile patterns. During proficient reading, neighboring characters impact the fingertip at ∼100 ms intervals, and adjacent raised dots within a character at 50 ms intervals. Because the brain requires time to interpret afferent sensorineural activity, among other reasons, tactile stimuli separated by such short temporal intervals pose a challenge to perception. How, then, do proficient Braille readers successfully interpret inputs arising from their fingertips at such rapid rates? We hypothesized that somatosensory perceptual consolidation occurs more rapidly in proficient Braille readers. If so, Braille readers should outperform sighted participants on masking tasks, which demand rapid perceptual processing, but would not necessarily outperform the sighted on tests of simple vibrotactile sensitivity. To investigate, we conducted two-interval forced-choice vibrotactile detection, amplitude discrimination, and masking tasks on the index fingertips of 89 sighted and 57 profoundly blind humans. Sighted and blind participants had similar unmasked detection (25 ms target tap) and amplitude discrimination (compared with 100 μm reference tap) thresholds, but congenitally blind Braille readers, the fastest readers among the blind participants, exhibited significantly less masking than the sighted (masker, 50 Hz, 50 μm; target–masker delays, ±50 and ±100 ms). Indeed, Braille reading speed correlated significantly and specifically with masking task performance, and in particular with the backward masking decay time constant. We conclude that vibrotactile sensitivity is unchanged but that perceptual processing is accelerated in congenitally blind Braille readers.
Introduction
Braille reading is a challenging spatiotemporal task. The English Braille code represents the alphabet and punctuation marks through arrangements of raised dots (∼0.5 mm in height and 1 mm in diameter) within a three-row by two-column matrix, the Braille cell. To identify a Braille character, the reader must discern, while moving the finger over the Braille text, which of the six positions, spaced just 2.38 mm apart within each cell, contain embossed dots. The enhanced tactile spatial acuity of blind people (Stevens et al., 1996; Grant et al., 2000; Van Boven et al., 2000; Goldreich and Kanics, 2003, 2006; Legge et al., 2008; Alary et al., 2009) presumably facilitates Braille reading. In addition, the rate at which the fingertip encounters characters during Braille reading suggests that this activity requires the ability to perceive tactile inputs rapidly.
At typical scanning speeds (Davidson et al., 1992), proficient Braille readers encounter a cell approximately every 100 ms, and neighboring dots within a cell every 50 ms. Stimuli separated by such short temporal intervals cause perceptual interference in sighted people. When presented with two spatially structured vibrotactile stimuli in rapid succession, participants often fail to perceive one of the stimuli, or mistakenly merge the two stimuli into a single percept (Craig, 1983, 2000; Kirman, 1984; Evans and Craig, 1986; Evans, 1987). Perceptual interference also results when two spatially unstructured vibrotactile stimuli are applied in rapid succession through a single probe: In forward masking, the first stimulus reduces the probability of detection of the second stimulus (Gescheider et al., 1992, 1995; Makous et al., 1996); in backward masking, the second stimulus interferes with the detection of the first (Gescheider et al., 1989). Perceptual interference in all cases grows more pronounced as the delay between the two stimuli shortens, suggesting that the interference is caused at least in part by the persistence of central perceptual processing after stimulus offset. As pointed out by Craig (2000), the temporal window within which perceptual interference occurs may set a limit to Braille reading speed.
These considerations raise the question: do proficient Braille readers manage to avoid perceptual interference by processing tactile inputs unusually rapidly? To investigate, we tested blind and sighted participants on masking tasks, and on unmasked vibrotactile detection and discrimination. We found that congenitally blind proficient Braille readers outperformed sighted participants specifically on masking tasks, supporting accelerated tactile perceptual processing in this group. Furthermore, faster Braille readers experienced correspondingly less masking interference. We consider these findings in light of two plausible neural mechanisms: the enlarged somatosensory cortical representation of the Braille reading fingers (Pascual-Leone and Torres, 1993; Sterr et al., 1998; Burton et al., 2004) and the tactile responsiveness of occipital cortex, particularly in congenitally blind individuals (Sadato et al., 1996, 1998, 2002; Cohen et al., 1999; Burton et al., 2004).
Materials and Methods
Participants
We tested 89 normally sighted (20.0–78.1 years of age; median age, 53.5 years; 39 men, 50 women) and 57 profoundly blind (19.5–74.2 years of age; median age, 52.5 years; 25 men, 32 women) adults. All participants signed an informed consent form (read aloud to blind participants) before testing and were remunerated for their time in the laboratory. The Duquesne University Institutional Review Board and the McMaster University Research Ethics Board approved all procedures. The study began at Duquesne University, where we tested 62 participants (32 sighted, 30 blind), and continued at McMaster University, where we tested an additional 84 participants (57 sighted, 27 blind).
For blind participants, acceptance criteria ensured that blindness was of peripheral (ocular, retinal, or optic nerve) origin and that the degree of vision did not exceed residual light perception (ability to tell light from dark, but inability to read print, even with magnification devices). For sighted participants, dyslexia was an exclusion criterion because previous research indicates that it adversely affects tactile acuity (Grant et al., 1999) and that it may reflect an underlying temporal processing deficit (Laasonen et al., 2001). Diabetes was a general exclusion criterion because it can result in peripheral neuropathy and slowing of action potential conduction even at subclinical levels (Hyllienmark et al., 1995). All participants were screened against learning disabilities, nervous system disorders, and index fingertip injuries and calluses.
On completion of the sensory testing session, we conducted a brief interview to determine participants' handedness, using questions modified from the Edinburgh Handedness Inventory (Oldfield, 1971). Eighty-four sighted participants were right-handed, and 5 were left-handed; 51 blind participants were right-handed, and 6 were left-handed.
We further interviewed the blind participants about their visual deprivation history. We categorized participants as congenitally blind (residual light perception or less at birth), early blind (normal or low vision at birth declining to residual light perception or less by 12 years of age), or late blind (normal or low vision until at least 12 years of age, declining to residual light perception or less in adulthood).
Next, we interviewed blind participants about their Braille reading history and habits. We categorized participants as proficient (grade 2 Braille readers), novice (grade 1 Braille readers), or nonreaders. Grade 1 Braille, used by beginners, represents each letter of the alphabet with a unique dot combination. Grade 2 Braille, used by proficient readers, represents many common letter combinations (e.g., ch, sh, st) and words (e.g., “and,” “but,” “can”) by single characters.
We asked the proficient readers which hand(s) and finger(s) they used for reading (i.e., for actually acquiring language content, not simply for tracking the line) and asked multifinger proficient readers to specify a preferred reading finger (the finger they would read with if required to use just one). All proficient readers identified an index finger as the preferred reading finger.
To verify each participant's reading style and to record reading speed, we next observed and timed the proficient readers as they read a brief news article (652 Braille characters, 192 words, 22 lines) in grade 2 Braille, silently and at their normal speed. A series of comprehension questions after the reading verified that all readers understood the passage.
Participant characteristics are shown in Tables 1 and 2. Twenty-two blind participants were congenitally blind proficient Braille readers (CBPRs), 11 were early blind proficient Braille readers (EBPRs), 10 were late blind proficient Braille readers (LBPRs), and 14 were late blind novice or nonreaders (LBNRs) (9 novice, 5 nonreaders). The age distributions of the sighted and blind participants were well matched and did not differ significantly [all blind vs sighted, 6 (ages) × 2 (vision) χ2 = 2.711, p = 0.74; blind subgroups and sighted, 6 (ages) × 5 (groups) χ2 = 22.258, p = 0.33]. Similarly, the sex distributions of the sighted and blind participants did not differ significantly [all blind vs sighted, 2 (sex) × 2 (vision) χ2 = 2.19 × 10⁻⁵, p = 0.996; blind subgroups and sighted, 2 (sex) × 5 (groups) χ2 = 6.562, p = 0.16].
Table 1.
Age distributions of the blind and sighted participants
| Age (years) | Blind (N = 57) | Sighted (N = 89) |
|---|---|---|
| 19–30 | 26.3 (15) | 21.3 (19) |
| 30–40 | 5.3 (3) | 9.0 (8) |
| 40–50 | 14.0 (8) | 15.7 (14) |
| 50–60 | 31.6 (18) | 24.7 (22) |
| 60–70 | 17.5 (10) | 19.1 (17) |
| 70–80 | 5.3 (3) | 10.1 (9) |
Percentages (and numbers) of participants are shown in each group, for each age decade.
Table 2.
Characteristics of the four blind groups and sighted
| CBPR (N = 22) | EBPR (N = 11) | LBPR (N = 10) | LBNR (N = 14) | Sighted (S) (N = 89) | |
|---|---|---|---|---|---|
| Median age (years) | 52.5 | 49.6 | 47.7 | 59.0 | 53.5 |
| Age range (years) | 20.2–74.2 | 23.1–71.0 | 21.2–65.7 | 19.5–72.0 | 20.0–78.1 |
| Women, men | 17, 5 | 5, 6 | 4, 6 | 6, 8 | 50, 39 |
| NLP, LP | 15, 7 | 10, 1 | 2, 8 | 3, 11 | — |
| OHR, THR | 12, 10 | 5, 6 | 6, 4 | — | — |
NLP, No light perception; LP, residual light perception; OHR, one-hand reader; THR, two-hand reader. The bottom three rows list numbers of participants.
Vibrotactile stimulation
Vibrotactile stimuli were applied to the distal pad of the stationary index finger, using a probe with a flat circular glass surface (11 mm diameter) driven up and down by a precision mini-shaker (Bruel & Kjaer 4810). A Macintosh G3 computer (Apple) running LabVIEW 6.1 (National Instruments) controlled the probe displacement by passing voltage waveforms (32,000 samples per second, 12 bit resolution) through an analog output channel (National Instruments PCI-MIO-16E-1 board) to a power amplifier (Bruel & Kjaer type 2718) that drove the mini-shaker. The system was precalibrated with a charge accelerometer (Bruel & Kjaer type 4381) threaded onto the mini-shaker, in lieu of the load cell transducer (see below) used during experiments. Since probe displacement was not measured on-line during the experiments, the displacement amplitudes (in micrometers) reported here should be considered nominal values only.
The mini-shaker was contained within a medium-density fiberboard box (29 × 29 × 14 cm, length by width by height), through which the probe contacted the skin by means of a circular opening (13 mm diameter) in the top surface. The probe surface was level with the top surface of the box, with a 1 mm gap separating the probe circumference from the edge of the opening. While the distal pad of the index finger contacted the probe, the remaining fingers and palm rested on top of the box, and the forearm rested in prone position on a foam pad level with the top of the box.
A load cell transducer (Daytronic model 434AM-250G) attached in series between the mini-shaker and the probe ensured that the finger maintained a light but steady force against the probe surface. The participant was required to establish a contact force between 20 and 50 g to initiate each trial and was required to maintain the force within that range throughout the trial. Any finger movement during the trial resulting in forces >50 or <20 g generated an error (announced to the participant by computer voice) and resulted in the exclusion of the trial. The contact force range of 20–50 g was deemed an acceptable window, as this was convenient for most participants (smaller windows resulted in increasing numbers of discarded trials), and variation in contact force over this range exerts little effect on the responses of either rapidly adapting or slowly adapting peripheral afferents (Johnson and Lamb, 1981).
Perceptual tasks
Each participant undertook a total of 12 testing blocks, performing 6 tasks with the index finger of each hand. One hand (randomly chosen by the computer program) was tested during the first half of the session, followed by the other hand during the second half.
We took the following steps to ensure that participants understood each task: Before each testing block conducted on the first-tested hand, the investigator carefully explained the task to the participant and answered any questions the participant had about the task. Subsequently, the investigator asked the participant to repeat the task instructions back to the investigator. The experiment proceeded only when the investigator was satisfied that the participant had fully understood the task. Finally, a practice period with auditory feedback preceded each testing block (on both hands).
Each testing block consisted of 40 two-interval forced-choice (2-IFC) trials without feedback. The computer paused to give participants a 15 s break after every 20 trials, a 1 min break after each testing block, and a 5 min break between hands.
In all six tasks, the participant was asked to detect a half-cycle 20 Hz sinusoidal target pulse (25 ms duration), which felt like a brief “tap” (as it will be called henceforth). Proficient Braille readers encounter adjacent raised dots within a cell at ∼50 ms intervals (20 dots per second). Thus, the tap stimulus we used, while lacking the spatial structure of Braille characters, has a time course similar to that encountered by a point of skin as the fingertip scans across a raised dot during Braille reading. By using spatially unstructured stimuli, we intended to characterize vibrotactile sensitivity and temporal resolution in isolation from tactile spatial perception. Twenty hertz vibrotactile stimuli preferentially activate rapidly adapting type I mechanoreceptive afferents, corresponding to the non-Pacinian-I channel (Mountcastle et al., 1972; Bolanowski et al., 1988; Gescheider et al., 2004).
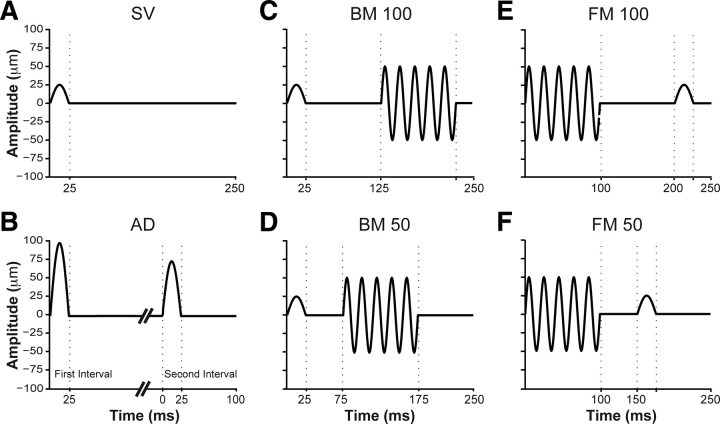
Task 1, simple vibrotactile detection (SV) (Fig. 1A), required the participant to detect the tap, which occurred in one of two randomly chosen intervals announced by auditory tones. The amplitude of the tap was adaptively adjusted (from a minimum of 1 μm to a maximum of 100 μm) to determine the participant's 76% correct detection threshold (see Bayesian adaptive method below).
Figure 1.
Perceptual tasks. A, Simple vibrotactile. B, Amplitude discrimination. C, Backward masking, target–masker delay, 100 ms. D, Backward masking, target–masker delay, 50 ms. E, Forward masking, masker–target delay, 100 ms. F, Forward masking, masker–target delay, 50 ms. In all tasks except amplitude discrimination, the participant's goal was to detect which interval contained the target tap (a 20 Hz sinusoidal pulse, 25 ms in duration, with amplitude ranging from 1 to 100 μm). In amplitude discrimination, the goal was to select the interval with the stronger tap. A and C–F show only the interval containing the tap.
Tasks 2–5, masking, required the participant to detect the tap in the presence of a masking vibration. A 100 ms, 50 Hz sinusoidal vibration of 50 μm amplitude was presented in both intervals, to test the interference produced by this vibratory stimulus (the masker) on the detection of the tap (the target), which was presented in just one of the intervals (randomly chosen). In tasks 2 and 3, backward masking (BM) (Fig. 1C,D), the tap preceded the masker. In tasks 4 and 5, forward masking (FM) (Fig. 1E,F), the tap followed the masker. The target–masker delay [interstimulus interval (ISI)] was 100 ms in tasks 2 and 4, and 50 ms in tasks 3 and 5. Auditory tones were not used to announce the intervals in tasks 2–5; the masking vibration, which was very easy to feel, served as the marker for each interval.
The effect of target–masker delay on the strength of masking can be quantified in one of two ways: (1) by presenting a target tap of fixed amplitude at different target–masker delays to determine how percentage correct detection depends on delay (shorter delays will be associated with lower percentage correct detection), or (2) by adaptively varying target amplitude at different target–masker delays to determine the target amplitude that results in a particular threshold performance level (e.g., 76% correct; shorter delays will be associated with greater 76% correct detection amplitudes). We followed procedure 2.
Task 6, amplitude discrimination (AD) (Fig. 1B), required the participant to report which of two taps, each announced by an auditory tone, was strongest. The amplitude of the reference tap was fixed at 100 μm while the amplitude of the target was varied, with values always <100 μm, to determine the participant's 76% correct difference threshold.
Bayesian adaptive method
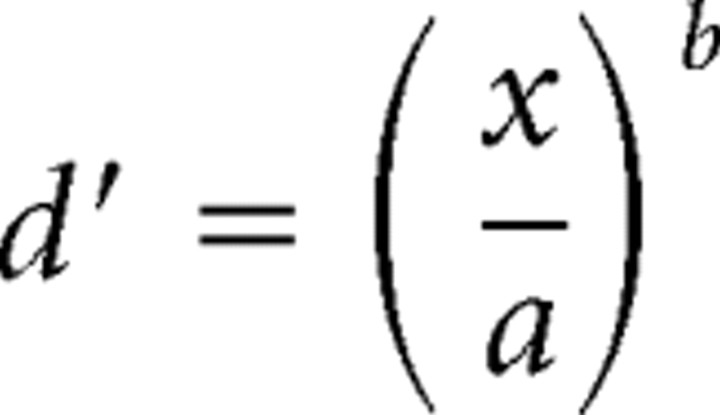
To estimate each participant's psychometric function, we used a 2-IFC procedure (above), with stimulus levels (tap amplitude) chosen by a modified version of the ψ method, a Bayesian adaptive algorithm (Kontsevich and Tyler, 1999). Following Kontsevich and Tyler (1999), we modeled d′ as a power function of stimulus level, and each participant's psychometric function—Pc(x), the probability of a correct response as a function of stimulus level, x—as a mixture of a cumulative normal (probit) function and a lapse rate term:
 |
 |
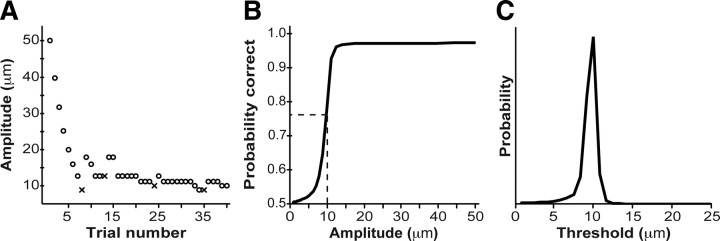
where the a-parameter is the threshold stimulus level, corresponding to 76% correct response probability (d′ = 1), and the b-parameter is the slope of the participant's psychometric function (Fig. 2). We modified the ψ algorithm by treating not only a and b, but also the lapse rate (δ) as an unknown parameter. We began with a uniform prior probability distribution over a wide range of a (1–100 μm), b (0.01–15), and δ (0.01–0.1) values.
Figure 2.
Adaptive psychophysical procedure. A, Performance of a participant (∘, correct; x, incorrect) on the simple vibrotactile detection task. The participant reported the perceived target interval by pressing one of two response keys. Target amplitude for each trial was selected using the modified ψ method. B, Most probable psychometric function, given the participant's performance. The dashed vertical line shows the stimulus level corresponding to 76% correct response probability. C, Posterior PDF for the participant's vibrotactile detection threshold. The mean of the PDF was taken as the best estimate of the participant's threshold.
The computer program computed a guessing Bayes factor (BF) after each trial:
 |
The numerator of the Bayes factor is the probability of the data given random guessing (50% probability correct) on each trial. The denominator is the probability of the data given the algorithm's best estimate of the participant's psychometric function (a, b, and δ parameters). For most participants, the Bayes factor rapidly approached zero as each testing block progressed, indicating that the participant's performance conformed to a psychometric function. In a minority of cases, the Bayes factor rose above 1. A Bayes factor >1 after 10 trials was taken as evidence that the participant was guessing on each trial and resulted in the termination of the testing block.
All participants completed the simple vibrotactile detection task with both hands, and all but one sighted participant completed the amplitude discrimination task with both hands. By contrast, on the masking tasks, sighted participants showed higher incompletion (chance performance) rates than did CBPR, EBPR, or LBPR participants. The percentage of total masking task blocks completed was 93.75 (CBPR), 97.73 (EBPR), 95.00 (LBPR), 74.11 (LBNR), and 87.08 (sighted). Among blind participants, only the LBNR had lower masking task completion rates than the sighted. The most difficult task to complete for all groups was FM50 (see supplemental Fig. 1, available at www.jneurosci.org as supplemental material).
When a participant was unable to complete a testing block, the participant's data were excluded from any subsequent threshold analysis that included that experimental task. For all analyses reported in Results, we used data only from participants who completed the relevant task with both hands. In addition, we excluded masking performance data from any participant whose SV threshold exceeded the masker amplitude (see below, Masking metric). This resulted in the exclusion of one participant (sighted) from the hand-averaged masking analyses, and four additional participants (two sighted, two late-blind nonreaders) from the analyses involving each hand individually.
Derived performance measures
To quantify performance, we derived four measures for use in statistical analyses.
SV and AD thresholds.
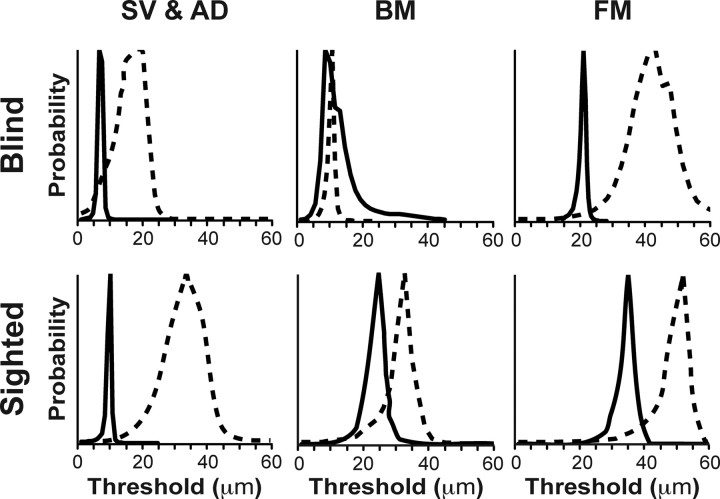
For completed testing blocks, we marginalized the psychometric function (a, b, δ) posterior probability density function (PDF) to derive a posterior PDF for the a-parameter of each participant on each task (Figs. 2C, 3). The mean of this a-parameter PDF was the dependent variable used in statistical analyses of the simple vibrotactile and amplitude discrimination task data.
Figure 3.
Posterior PDFs for thresholds of a single CBPR participant (top panels) and a single sighted participant (bottom panels) on all six tasks. Left, SV (solid lines) and AD (dashed lines). Middle, BM. Right, FM. In middle and right panels, the solid line indicates 100 ms target–masker delay, and the dashed line indicates 50 ms target–masker delay. Note that the estimated target detection thresholds at 50 ms delay are higher than those that at 100 ms delay; target detection thresholds under forward masking are higher than under backward masking; and the thresholds of the sighted participant on each task are higher than those of the CBPR participant.
Masking metric (m).
To quantify the perceptual disruption experienced by each participant in response to the masking stimulus, we used the performance metric:
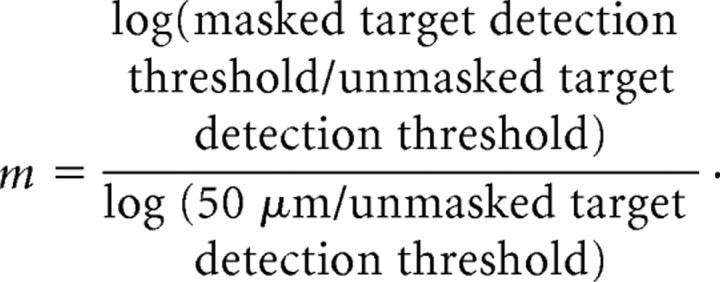 |
Here, masked and unmasked target detection thresholds are the mean of the participant's a-parameter PDF from the relevant masking task (e.g., BM100, etc.) and from the SV task, respectively.
The following reasoning led to our use of this metric: To achieve equal subjective masker strength (masker sensation level) for each participant, previous vibrotactile detection masking studies have adjusted masker amplitude on a per-participant basis to equal a fixed decibel shift (e.g., 20 dB) above the participant's unmasked vibrotactile detection threshold as follows:
 |
Those studies (Gescheider et al., 1989, 1992, 1995) applied greater masker amplitudes to participants with larger unmasked detection thresholds, to achieve the same masker sensation level for each participant. The studies then quantified degree of masking as the shift (in decibels) from unmasked to masked target detection threshold as follows:
 |
To avoid potential confounds in our between-subjects design, we chose to use a masking stimulus of fixed amplitude (50 μm) with all participants. This constant-amplitude masking stimulus presumably evoked a stronger sensation level in participants with lower unmasked target detection thresholds. In our study, therefore, the traditional degree-of-masking metric would tend to overestimate masking in participants with lower unmasked detection thresholds. Indeed, Gescheider et al. (1995) showed that degree of masking relates linearly to masker sensation level. Accordingly, we quantified masking by using a metric appropriate to our fixed masker amplitude protocol, degree of masking elicited per unit masker sensation level as follows:
 |
Thus, our masking metric is simply the slope of the line, relating degree of masking to masker sensation level [Gescheider et al. (1995), their Fig. 4], on which each participant falls. To determine the average value of m for the two hands, we first averaged across hands the participant's performance on the SV task, and on the relevant masking task, and then entered these two averages into the formula for m, above.
Figure 4.
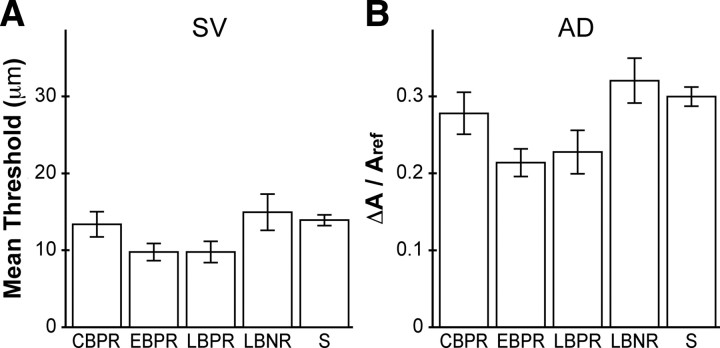
Mean performance of the five participant groups on the nonmasking tasks. A, SV. B, AD. Error bars indicate ±1 SE. S, Sighted.
Masking decay time constant (τ).
In addition to measuring the effect of masking (m, above), we examined the rate of decay in masking as a function of target–masker delay. As the degree of masking appears to diminish approximately exponentially with target–masker ISI, as the latter increases from zero to several hundred milliseconds (Gescheider et al., 1989), we modeled the temporal dependence of the masking metric, m, as follows:
 |
where t is the ISI (delay; in milliseconds) between target and masker, m0 is the predicted value of the masking metric at zero delay, and τ is the exponential decay time constant (in milliseconds). We then derived each participant's τ and m0 (see supplemental Methods, available at www.jneurosci.org as supplemental material) as follows:
 |
Note that, although we define t as the target–masker ISI, the formula for τ would be unchanged if we were to redefine t to equal target–masker stimulus-onset asynchrony; in such case, only the formula for m0 would change (see supplemental Methods, available at www.jneurosci.org as supplemental material).
Note that τ is positive only when m50 > m100. In addition, τ is undefined if the participant's detection threshold at 100 ms target–masker delay is less than the unmasked target detection threshold (as m100 is negative in that case). For some participants (because of random variability in responses) the estimated target detection threshold at 100 ms delay was slightly less than the estimated unmasked (SV) threshold. To ensure valid τ measures for all participants, then, we imposed an additional constraint (for the τ and m0 calculations only), that SV threshold < BM100 threshold < BM50 threshold, and similarly that SV threshold < FM100 threshold < FM50 threshold. We implemented this constraint by multiplying each participant's three-dimensional likelihood function (over SV, M100, M50 thresholds) by a step-function prior PDF (uniform over the region SV < M100 < M50 threshold, and zero otherwise) to generate a joint posterior PDF. We then used the mean of this joint posterior PDF as the estimates for SV, M100, and M50 thresholds in the calculation of the participant's masking metric, m. To calculate each participant's hand-averaged τ, for each masking task we averaged the participant's m scores on the two hands, and calculated the τ from this average m.
Character onset asynchrony.
To facilitate comparisons between the participants' masking time constants and their Braille reading speed, we derived from each participant's reading passage time an estimate of the average onset asynchrony (in milliseconds) between successive Braille characters that the participant would experience during reading. The character onset asynchrony (COA) is the elapsed time between the finger's first contact with one character and its first contact with the next.
A crude upper estimate of the COA can be obtained by dividing each participant's passage reading time by the number of characters in the passage. This crude estimate exceeds the actual COA, because the participant's total reading time includes the time spent scanning over spaces between words. Our Braille test passage was a news story consisting of 652 embossed characters forming 192 words, with 191 spaces between words. We estimate COA, therefore, as passage reading time divided by 843 (i.e., 652 + 191). We note that even this more accurate estimate probably exceeds the forward movement COA, as it does not take account of the possible scanning of multiple spaces at the ends of lines, or of time spent during occasional pauses and back-up-to-reread intervals, which we did not separately record (Davidson et al., 1992). In short, the typical reader's finger probably covered somewhat more ground during forward scanning movement, and did so in somewhat less time, than we have entered into our calculation of COA.
Statistical analysis
We used PASW Statistics, version 18 (SPSS) for Macintosh, to perform statistical analyses, with a significance criterion of 0.05. We used age- and sex-controlled main effects analyses of covariance (ANCOVA), with type III sum-of-squares. The bar graphs display marginal means, and the scatterplots display participants' unadjusted performance values. In the text, we report marginal means and two-tailed p values. Following the convention used by PASW Statistics, for Bonferroni-corrected comparisons, we report corrected p values rather than uncorrected p values with an adjusted significance criterion.
Results
We tested sighted participants and four groups of profoundly blind participants on vibrotactile detection, amplitude discrimination, and masking tasks, on the index fingers of both hands. The blind participants were CBPRs, EBPRs, LBPRs, and LBNRs.
The sighted participants performed equivalently with their dominant and nondominant hands, on each of the tasks (age- and sex-controlled ANCOVAs to test performance on dominant vs nondominant hands: SV, p = 0.24; AD, p = 0.087; masking, p = 0.18).
Similarly, the blind participants performed equivalently with their dominant and nondominant hands, and degree of light perception (residual or none) did not affect performance among the blind participants on any task (age- and sex-controlled ANCOVAs: SV, hand p = 0.16, light perception p = 0.82; AD, hand p = 0.36, light perception p = 0.87; masking, hand p = 0.64, light perception p = 0.091).
Additionally, the proficient Braille readers performed equivalently with the preferred reading finger and opposite index finger (paired t tests: SV, p = 0.31; AD, p = 0.73; BM100, p = 0.82; BM50, p = 0.59; FM100, p = 0.77; FM50, p = 0.79). The equivalent performance on these fingers held not only for the entire sample of proficient readers, but also separately for the one-hand proficient readers (paired t tests: SV, p = 0.57; AD, p = 0.34; BM100, p = 0.69; BM50, p = 0.60; FM100, p = 0.39; FM50, p = 0.11) and the two-hand proficient readers (paired t tests: SV, p = 0.07; AD, p = 0.48; BM100, p = 0.62; BM50, p = 0.19; FM100, p = 0.79; FM50, p = 0.32) (supplemental Fig. 2, available at www.jneurosci.org as supplemental material).
Therefore, to compare blind and sighted groups, we took average thresholds across the hands, and we categorized blind participants into the four groups defined above without regard to their light perception level.
Blind and sighted performed equivalently on SV and AD tasks
Age- and sex-controlled ANCOVAs (comparing five groups: CBPR, EBPR, LBPR, LBNR, and sighted) revealed that the sighted and blind participants performed equivalently on simple vibrotactile detection and amplitude discrimination tasks.
SV task
An ANCOVA on simple detection thresholds revealed highly significant main effects of age (F(1,139) = 32.793; p < 0.001; η2 = 0.191) and of sex (F(1,139) = 21.960; p < 0.001; η2 = 0.177), but no effect of participant group (p = 0.13) (Fig. 4A). The EBPR and LBPR had nonsignificantly lower SV thresholds than the other groups. Detection threshold increased with age by 0.20 μm per year (95% confidence interval, 0.13–0.27). The mean detection threshold of male participants was 6.5 μm higher than that of female participants (95% confidence interval, 4.2–8.9).
AD task
An ANCOVA on amplitude discrimination thresholds revealed no main effect of any factor (Fig. 4B). Interestingly, whereas age and sex were highly significant predictors of SV performance, these two factors did not approach significance for the AD performance data (age p = 0.47; sex p = 0.38). Although the five subject groups did not differ significantly in AD performance (p = 0.061), the same two groups with nonsignificantly lower SV thresholds, EBPR and LBPR, also had nonsignificantly lower AD thresholds. Indeed, inclusion of SV thresholds as a covariate in the ANCOVA revealed a highly significant correlation between SV and AD performance (F(1,132) = 13.388; p < 0.001), again with no effect of participant group on AD performance (p = 0.98).
CBPR outperformed sighted on all masking tasks
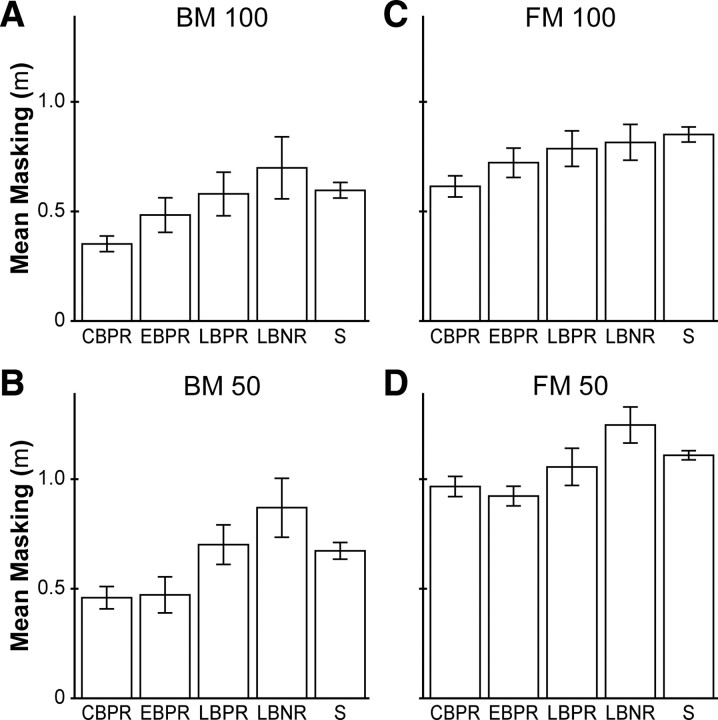
Unlike performance on the simple detection and amplitude discrimination tasks, performance on the masking tasks differed significantly across participant groups. An age- and sex-controlled ANCOVA revealed main effects of masking type (forward, backward) (F(1,82) = 24.166; p < 0.001; η2 = 0.228), target–masker delay (100 ms, 50 ms) (F(1,82) = 4.809; p = 0.031; η2 = 0.055), age (F(1,82) = 8.838; p = 0.004; η2 = 0.097), and participant group (F(4,82) = 3.508; p = 0.011; η2 = 0.146). Participant sex did not significantly affect masking task performance (p = 0.91).
Comparisons between each of the four blind groups and the sighted (Bonferroni corrected for four comparisons) revealed that CBPR significantly outperformed the sighted on masking tasks (p = 0.020), whereas EBPR marginally outperformed the sighted (EBPR vs sighted, p = 0.051) (Fig. 5). The masking task performance of LBPR and LBNR did not differ significantly from that of the sighted. Task-specific univariate tests revealed significantly better performance of CBPR compared with the sighted on all four masking tasks (BM100, p = 0.006; BM50, p = 0.033; FM100, p = 0.004; FM50, p = 0.019). EBPR participants, by contrast, significantly outperformed the sighted on only one masking task (FM50, p = 0.012).
Figure 5.
Mean masking performance metric of the five participant groups. A–D, Backward masking, 100 ms, 50 ms; forward masking, 100 ms, 50 ms. Error bars indicate ±1 SE. For masked target detection thresholds in micrometers, see supplemental Figure 3 (available at www.jneurosci.org as supplemental material).
CBPR had shorter masking decay time constants than the sighted
The above analyses showed that, for each type of masking and at each target–masker delay, the masking stimulus caused significantly less disruption to vibrotactile detection in CBPR than in sighted participants; furthermore, the effect of the masking stimulus decayed significantly as target–masker delay increased. One possible explanation for these results is that, at each target–masker delay, masking in CBPR is reduced by a fixed factor compared with masking in the sighted; another possibility is that masking falls off more rapidly with increasing target–masker delay in CBPR than in sighted participants.
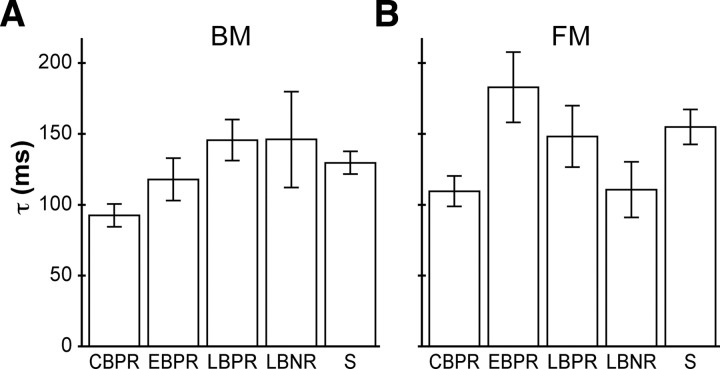
The possibility that masking decays more rapidly as a function of target–masker delay in CBPR than in sighted participants received support from the observation that the difference in masking metric between CBPR and sighted was greater, for each masking type, at 100 ms than at 50 ms delay (sighted m − CBPR m: BM100, 0.245; BM50, 0.214; FM100, 0.237; FM50, 0.142). To investigate further, we derived the participants' masking decay time constants from their performance at the two tested delays (100 and 50 ms), for both forward and backward masking (see Materials and Methods).
Age- and sex-controlled ANCOVAs on the masking decay time constants from the five participant groups, with planned comparison between CBPR and sighted, revealed that CBPR had significantly shorter backward masking time constants (t = 2.364; uncorrected p = 0.020) and marginally significantly shorter forward masking time constants (t = 1.963; p = 0.053) than the sighted. The mean CBPR backward masking time constant was 92 ms, compared with the mean sighted time constant of 130 ms (95% confidence interval for sighted BM τ − CBPR BM τ: 6–68 ms) (Fig. 6A). The mean CBPR forward masking time constant was 110 ms, compared with the mean sighted time constant of 155 ms (95% confidence interval for sighted FM τ − CBPR FM τ: −0.56–91 ms) (Fig. 6B). CBPR participants also had significantly smaller predicted backward masking at zero delay (t = 2.451; p = 0.016) than the sighted (CBPR m0, 1.07; sighted m0, 1.36). The predicted forward masking at zero delay of CBPR and sighted participants did not differ significantly (p = 0.98).
Figure 6.
Mean masking decay time constants of the five participant groups. A, Backward masking decay time constant. B, Forward masking decay time constant. Error bars indicate ±1 SE.
Braille reading speed predicted backward masking task performance
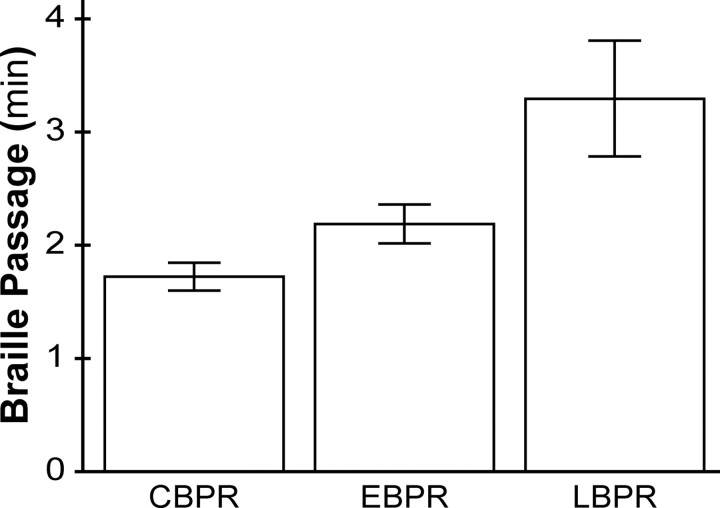
Not only did the CBPR participants have the best masking task performance, they were also the fastest Braille readers in the study. An age- and sex-controlled ANCOVA performed on the reading speeds (test passage reading time) of the three groups of proficient readers revealed a highly significant effect of group (F(2,38) = 8.625; p = 0.001; η2 = 0.312), with no significant effects of age (p = 0.51) or of sex (p = 0.49) (Fig. 7).
Figure 7.
Mean time taken to read the Braille test passage for each of the proficient Braille reader groups. Error bars indicate ±1 SE.
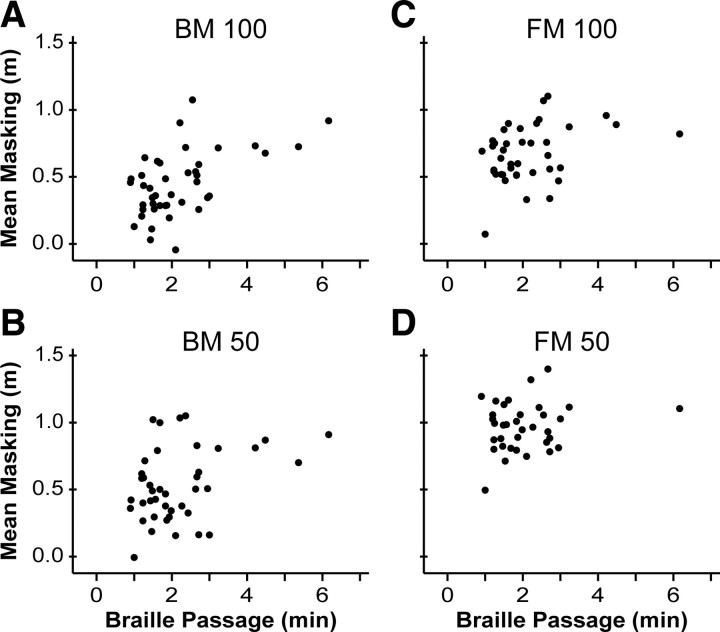
Since the backward masking characteristics and the passage reading time of the three groups of proficient readers showed similar trends (compare Figs. 5A,B, 6A, and 7), we wondered whether these measures were related. To investigate, we first conducted a series of bivariate correlations between the proficient readers' task performance and their passage reading time (Fig. 8). We found that BM100 and BM50 performance correlated significantly with reading time (BM100 r = 0.54, p < 0.001; BM50 r = 0.37, p = 0.018), such that faster readers showed less backward masking. FM100 performance also correlated significantly with reading time (FM100 r = 0.38; p = 0.016), but FM50 performance did not (p = 0.24). Similarly, performance on SV and AD was uncorrelated with reading time (p = 0.89 and 0.44) (supplemental Fig. 4, available at www.jneurosci.org as supplemental material). Thus, reading speed correlated specifically with masking task performance, and most consistently with backward masking task performance.
Figure 8.
Masking task performance metric of proficient Braille readers plotted against time required to read the Braille test passage. A–D, Backward masking, 100 ms, 50 ms; forward masking, 100 ms, 50 ms.
Having found that masking task performance varied with proficient reader group and with passage reading time (Figs. 5, 8), we next asked which one (if either) of these factors was the more important predictor of masking task performance. ANCOVAs on masking task performance, with age, sex, proficient reader group (CBPR, EBPR, and LBPR), and passage reading time as independent variables revealed that only passage reading time predicted masking task performance. Specifically, passage reading time significantly predicted BM100 performance (p = 0.003; η2 = 0.22) and marginally significantly predicted BM50 performance (p = 0.064; η2 = 0.10). Importantly, when considered along with passage reading time, participant group did not itself predict masking task performance (BM100, p = 0.60; BM50, p = 0.37). Thus, reading speed, not congenital or early blindness per se, was the primary predictor of backward masking task performance.
Character onset asynchrony correlated with backward masking time constant
Not only did faster Braille readers show less backward masking, they also had shorter backward masking time constants. Indeed, an ANCOVA with age, sex, participant group, and passage reading time revealed that passage reading time, and only passage reading time, significantly predicted the backward masking time constant (passage reading time, p = 0.025, η2 = 0.14; age, p = 0.54; sex, p = 0.27; group, p = 0.34). Thus, the backward masking time constant correlated specifically with Braille reading speed.
In light of these results, we wondered whether superior backward masking task performance reflects rapid perceptual consolidation that enables faster Braille reading. If so, a Braille reader's backward masking time constant might set an upper limit to the reader's speed. As reading speed increases, the temporal period between successively encountered characters shortens; at some critical speed determined by the reader's backward masking time constant, characters would be encountered so rapidly as to provoke considerable backward masking, with consequent diminishment of perceptual clarity. The demands of comprehension, then, would prevent reading in excess of this speed. If this idea is correct, and if proficient Braille readers tend to scan as rapidly as their perception allows, then scanning time per character should be proportional to the backward masking time constant.
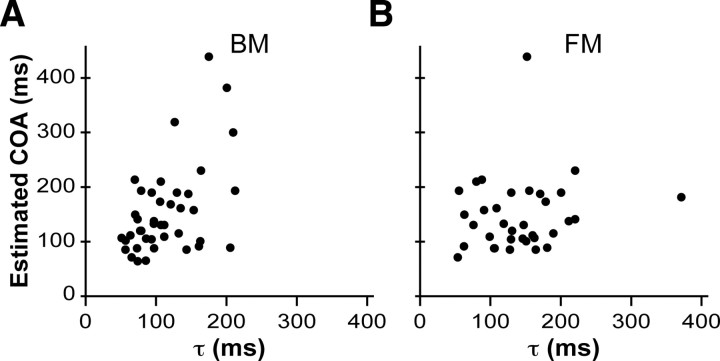
To investigate this hypothesis, we derived from each participant's reading passage time an estimate of the average onset asynchrony (in milliseconds) between successive Braille characters that the participant would experience during reading (COA) (see Materials and Methods). We plotted each reader's estimated COA against the reader's average backward masking time constant (Fig. 9A). The two measures were highly significantly correlated (r = 0.51; p = 0.0006), and the y-intercept of the best-fit regression line did not differ significantly from zero (p = 0.12), suggesting that the participants' COA could indeed be predicted by a simple multiple of their BM τ. By contrast, COA and FM τ were uncorrelated (p = 0.39) (Fig. 9B).
Figure 9.
Estimated COA during Braille reading plotted against masking decay time constants. A, Backward masking decay time constant. B, Forward masking decay time constant. For breakdown by proficient reader group, see supplemental Figure 5 (available at www.jneurosci.org as supplemental material).
Across proficient readers, the mean COA-to-BM τ ratio was 1.4 (SD, 0.6). Fifty-nine percent of proficient readers had a COA-to-BM τ ratio between 1 and 2 (and 90% had a ratio between 0.5 and 2.5). Thus, the majority of participants read rapidly enough so that their COA was less than twice their BM τ, but not so rapidly as to reduce their COA to less than their BM τ. These results are consistent with the hypothesis that the backward masking time constant constrains Braille reading speed.
Discussion
To our knowledge, the present study is the first to investigate vibrotactile masking in blind participants. Congenitally blind proficient Braille readers outperformed the sighted specifically on masking tasks, and Braille reading speed predicted backward masking task performance. A plausible interpretation is that early onset blindness leads to accelerated perceptual processing, which in turn enables rapid Braille reading.
Comparison with previous vibrotactile studies of sighted participants
The sighted participants' unmasked detection thresholds (∼14 μm) fell within the range of values reported previously by studies that, like ours, used low-frequency stimuli that activate rapidly adapting type I afferents innervating Meissner corpuscles (Talbot et al., 1968; Verrillo, 1971; Mountcastle et al., 1972; Ferrington et al., 1977; Barlow, 1987; Bolanowski et al., 1988; Gescheider et al., 1994, 2002; Stuart et al., 2003; Francisco et al., 2008; Soneda and Nakano, 2010).
As reported previously (Gescheider et al., 1992, 1994; Goble et al., 1996), we observed an age-related decline in low-frequency vibrotactile detection. A likely cause is age-associated loss of Meissner corpuscles (Bolton et al., 1966; Bruce, 1980). Age also detrimentally affects high-frequency vibrotactile perception (Verrillo, 1980; Gescheider et al., 1992, 1994; Goble et al., 1996) and tactile spatial perception (Stevens, 1992; Stevens and Choo, 1996; Stevens et al., 1996; Goldreich and Kanics, 2003, 2006), perhaps reflecting loss of Pacinian (Cauna, 1965) and Merkel receptors, respectively.
We observed that women outperformed men in vibrotactile detection, as reported by Gescheider et al. (1994) (but see Verrillo, 1979; Seah and Griffin, 2008). A plausible explanation is that Meissner corpuscle density is greater in smaller fingertips (Bolton et al., 1966; Dillon et al., 2001; Nolano et al., 2003). Sex differences favoring women have also been reported in tactile spatial tasks (Van Boven et al., 2000; Goldreich and Kanics, 2003, 2006; Peters et al., 2009), perhaps reflecting greater Merkel receptor density in smaller fingers (Peters et al., 2009).
We found amplitude difference thresholds in the range of ∼20–30%, consistent with previous reports. Francisco et al. (2008), using a 100 μm, 500 ms, 25 Hz reference stimulus, reported difference thresholds of ∼23%. Similarly, Craig (1974), using 200 ms, 160 Hz stimuli, reported that difference thresholds converged to ∼25% as stimulus level increased to 20 dB sensation level (our 100 μm reference is 20 dB sensation level for a participant with 10 μm detection threshold). Interestingly, amplitude difference thresholds reportedly are independent of stimulus frequency (Gescheider et al., 1990).
We found that participants with lower detection thresholds had correspondingly lower amplitude difference thresholds. This result is consistent with studies showing that amplitude discrimination conforms only approximately to Weber's law, such that difference thresholds decrease with increasing stimulus sensation level (Craig, 1974; Gescheider et al., 1990; Francisco et al., 2008): our 100 μm reference stimulus equates to greater sensation level for participants with smaller detection thresholds.
We found that masking was more pronounced at shorter target–masker delays, as reported by many studies (Coquery and Amblard, 1973; Evans, 1987; Gescheider et al., 1989). Additionally, at equal delays, forward masking was more pronounced than backward masking, consistent with Coquery and Amblard (1973). A plausible explanation is that central neural persistence contributes to both forward and backward masking, but masker-induced adaptation additionally contributes specifically to forward masking (Gescheider et al., 1992).
Evidence for accelerated perceptual processing in congenitally blind Braille readers
Several studies have reported enhanced tactile spatial acuity in blind individuals (Stevens et al., 1996; Grant et al., 2000; Van Boven et al., 2000; Goldreich and Kanics, 2003, 2006; Legge et al., 2008), but vibrotactile acuity in the blind has only recently been investigated. Using 20–100 Hz stimuli, Wan et al. (2010) found enhanced vibrotactile frequency discrimination in congenitally and early blind Braille readers compared with sighted participants. By contrast, using a 100 Hz standard stimulus, Alary et al. (2009) found no significant difference in frequency discrimination between blind Braille readers and sighted participants. Neither study investigated detection, amplitude discrimination, or masking.
We found that congenitally blind proficient Braille readers performed similarly to sighted participants on detection and amplitude discrimination tasks, but outperformed the sighted (and had shorter decay time constants) on masking tasks. What is the explanation for this? Of these tasks, presumably only masking probes the speed of perceptual processing. In backward masking, perceptual interference may occur because the brain is still processing the initial target stimulus when the subsequent, disrupting vibratory input arrives. Similarly, in forward masking, the persisting response of the nervous system to the initial vibration may interfere with processing of the subsequent target. These considerations suggest that the faster the nervous system is able to process stimuli to form a percept, the less masking will occur. Our results therefore suggest that early blindness is associated specifically with an increase in perceptual consolidation speed, without a concomitant increase in vibrotactile sensitivity.
Several recent studies provide evidence for a connection between early blindness and accelerated perceptual consolidation (for review, see Bavelier and Neville, 2002; Stevens and Weaver, 2005). Röder et al. (2004) found that congenitally blind Braille readers outperformed sighted participants and late-blind Braille readers on a tactile temporal order judgment task. In auditory studies, Stevens and Weaver (2005) found only marginal backward masking in early blind participants, in contrast to the marked backward masking observed in sighted participants (but see also Weaver and Stevens, 2006), and Liotti et al. (1998) found that congenitally blind participants were significantly faster than the sighted at detecting sound intensity changes. Our results further support the association between early blindness and accelerated perceptual processing.
Backward masking may constrain Braille reading speed
What limits Braille reading speed?
It is unlikely that Braille reading speed is constrained by motor capability. The average congenitally blind proficient Braille reader in our study read at ∼4.7 s per line (22 lines in 103 s). Humans are easily capable of moving their fingers across a page much faster than this.
Similarly, it is unlikely that Braille reading speed is constrained by semantic processing time. The average CBPR participant in our study read 112 words per minute (192 words in 103 s), whereas sighted humans routinely read print at >300 words per minute (Akutsu et al., 1991). The rate at which humans are able to interpret sequential linguistic inputs is thus much greater than the rate at which these inputs are encountered during Braille reading.
Finally, it is unlikely that Braille reading speed is constrained by the stimulus exposure time needed to accumulate sufficient sensorineural afferent activity on which to base a perceptual judgment. Indeed, trained sighted participants can identify raised English letters statically impressed onto the fingertip with exposures as short as 4 ms (Craig, 1980).
Rather, we suggest that Braille reading speed is constrained by the neural processing time required for tactile perceptual consolidation, reflected in the backward masking decay time constant. Consistent with this suggestion, we found that backward masking task performance correlated with Braille reading speed, and that proficient readers moved their fingers such that character onset asynchrony was proportional to the backward masking time constant. Thus, a Braille reader's backward masking time constant may set an upper limit to the rate at which the reader can perform the sequential tactile character recognition necessary for successful reading.
Interestingly, Braille reading speed correlated with backward but not with forward masking performance. A possible explanation for this difference is that our forward masking analyses had lower statistical power, as fewer participants were able to complete the forward masking tasks, particularly FM50 (see supplemental Fig. 1, available at www.jneurosci.org as supplemental material). An alternative explanation is that backward masking performance more faithfully reflects perceptual consolidation speed than does forward masking performance, as the latter may additionally reflect the time course of masker-induced adaptation (Gescheider et al., 1992). Indeed, backward masking is more effective than forward masking at disrupting tactile spatial pattern recognition (Craig, 1980, 1983). Research is needed to determine whether the correlation between backward masking performance and Braille reading speed reflects vibrotactile detection masking that comes into play during Braille reading, spatiotemporal pattern masking, or both.
Distinguishing the effects of early blindness from those of Braille experience
Our data suggest that early onset blindness facilitates rapid perceptual processing, and that rapid perceptual processing in turn enables fast Braille reading. We caution, however, that we cannot determine the direction of causal relationships from the observational data collected in the present study.
One important unresolved question is whether Braille reading experience itself promotes rapid perceptual processing. The most satisfactory answer to this question would come from comparisons between congenitally blind Braille readers and congenitally blind nonreaders. Since all congenitally (and early) blind participants in our sample were also proficient Braille readers, we were unable to take that direct approach.
We are able, however, to address this question indirectly by comparing Braille readers' masking task performance on the two index fingers. If Braille experience accelerates perceptual consolidation, then Braille readers might show less masking on the index finger preferred for reading than on the opposite index finger. Contrary to this prediction, masking performance on the two fingers was statistically equivalent, even among one-hand readers (see supplemental Fig. 2, available at www.jneurosci.org as supplemental material).
These results provide preliminary support for the hypothesis that Braille reading experience does not itself promote rapid perceptual processing. However, a possible alternative explanation is that Braille experience does play a role and that perceptual skill transfers across the hands (Sathian and Zangaladze, 1997).
Possible neural substrates
The neural substrate underlying the enhanced somatosensory perception of congenitally blind Braille readers is unclear. Functional imaging studies suggest an enlarged somatosensory cortical representation of the reading fingers (Pascual-Leone and Torres, 1993; Sterr et al., 1998; Burton et al., 2004). In addition, normally visual occipital cortical areas activate when early blind (and, generally to a lesser extent, later blind) individuals perform spatiotactile (Sadato et al., 1996, 1998, 2002; Cohen et al., 1999) or vibrotactile (Burton et al., 2004) tasks.
It is unclear at present how such neural reorganization might specifically enhance masking task performance, without also affecting performance on unmasked vibrotactile detection and amplitude discrimination tasks. The answer may lie in the fundamental difference between masking, which reflects perceptual consolidation speed, and unmasked detection and discrimination, which reflect vibrotactile sensitivity. Perhaps the neural networks normally engaged by tactile inputs are sufficient to drive vibrotactile sensitivity to saturation, but reorganized networks consisting of larger numbers of neurons enable faster perceptual consolidation.
Also unclear is the extent to which neural reorganization mediates tactile perceptual enhancement in other populations. Intriguingly, vibrotactile stimuli activate auditory cortex in congenitally deaf individuals (Levänen et al., 1998; Auer et al., 2007), who outperform normal hearing participants on vibrotactile frequency change detection tasks (Levänen and Hamdorf, 2001). Research is needed to investigate the possibly common neural mechanisms that enhance tactile processing in blind and deaf individuals.
Footnotes
This work was supported by grants from the National Eye Institute and the Natural Sciences and Engineering Research Council (Canada) (D.G.). We thank Deda Gillespie for equipment design and construction, Kajal Chohan for assistance with experiments, and two anonymous reviewers for their many helpful comments.
References
- Akutsu H, Legge GE, Ross JA, Schuebel KJ. Psychophysics of reading—X. Effects of age-related changes in vision. J Gerontol. 1991;46:P325–P331. doi: 10.1093/geronj/46.6.p325. [DOI] [PubMed] [Google Scholar]
- Alary F, Duquette M, Goldstein R, Elaine Chapman C, Voss P, La Buissonnière-Ariza V, Lepore F. Tactile acuity in the blind: a closer look reveals superiority over the sighted in some but not all cutaneous tasks. Neuropsychologia. 2009;47:2037–2043. doi: 10.1016/j.neuropsychologia.2009.03.014. [DOI] [PubMed] [Google Scholar]
- Auer ET, Jr, Bernstein LE, Sungkarat W, Singh M. Vibrotactile activation of the auditory cortices in deaf versus hearing adults. Neuroreport. 2007;18:645–648. doi: 10.1097/WNR.0b013e3280d943b9. [DOI] [PMC free article] [PubMed] [Google Scholar]
- Barlow SM. Mechanical frequency detection thresholds in the human face. Exp Neurol. 1987;96:253–261. doi: 10.1016/0014-4886(87)90044-6. [DOI] [PubMed] [Google Scholar]
- Bavelier D, Neville HJ. Cross-modal plasticity: where and how? Nat Rev Neurosci. 2002;3:443–452. doi: 10.1038/nrn848. [DOI] [PubMed] [Google Scholar]
- Bolanowski SJ, Jr, Gescheider GA, Verrillo RT, Checkosky CM. Four channels mediate the mechanical aspects of touch. J Acoust Soc Am. 1988;84:1680–1694. doi: 10.1121/1.397184. [DOI] [PubMed] [Google Scholar]
- Bolton CF, Winkelmann RK, Dyck PJ. A quantitative study of Meissner's corpuscles in man. Neurology. 1966;16:1–9. doi: 10.1212/wnl.16.1.1. [DOI] [PubMed] [Google Scholar]
- Bruce MF. The relation of tactile thresholds to histology in the fingers of elderly people. J Neurol Neurosurg Psychiatry. 1980;43:730–734. doi: 10.1136/jnnp.43.8.730. [DOI] [PMC free article] [PubMed] [Google Scholar]
- Burton H, Sinclair RJ, McLaren DG. Cortical activity to vibrotactile stimulation: an fMRI study in blind and sighted individuals. Hum Brain Mapp. 2004;23:210–228. doi: 10.1002/hbm.20064. [DOI] [PMC free article] [PubMed] [Google Scholar]
- Cauna N. The effects of aging on the receptor organs of the human dermis. In: Montagna W, editor. Advances in biology of skin. New York: Pergamon; 1965. pp. 63–96. [Google Scholar]
- Cohen LG, Weeks RA, Sadato N, Celnik P, Ishii K, Hallett M. Period of susceptibility for cross-modal plasticity in the blind. Ann Neurol. 1999;45:451–460. doi: 10.1002/1531-8249(199904)45:4<451::aid-ana6>3.0.co;2-b. [DOI] [PubMed] [Google Scholar]
- Coquery J, Amblard B. Backward and forward masking in the perception of cutaneous stimuli. Percept Psychophys. 1973;13:161–163. [Google Scholar]
- Craig JC. Vibrotactile difference thresholds for intensity and the effect of a masking stimulus. Percept Psychophys. 1974;15:123–127. [Google Scholar]
- Craig JC. Modes of vibrotactile pattern generation. J Exp Psychol Hum Percept Perform. 1980;6:151–166. doi: 10.1037//0096-1523.6.1.151. [DOI] [PubMed] [Google Scholar]
- Craig JC. The role of onset in the perception of sequentially presented vibrotactile patterns. Percept Psychophys. 1983;34:421–432. doi: 10.3758/bf03203057. [DOI] [PubMed] [Google Scholar]
- Craig JC. Processing of sequential tactile patterns: effects of a neutral stimulus. Percept Psychophys. 2000;62:596–606. doi: 10.3758/bf03212111. [DOI] [PubMed] [Google Scholar]
- Davidson PW, Appelle S, Haber RN. Haptic scanning of Braille cells by low- and high-proficiency blind readers. Res Dev Disabil. 1992;13:99–111. doi: 10.1016/0891-4222(92)90018-2. [DOI] [PubMed] [Google Scholar]
- Dillon YK, Haynes J, Henneberg M. The relationship of the number of Meissner's corpuscles to dermatoglyphic characters and finger size. J Anat. 2001;199:577–584. doi: 10.1046/j.1469-7580.2001.19950577.x. [DOI] [PMC free article] [PubMed] [Google Scholar]
- Evans PM. Vibrotactile masking: temporal integration, persistence, and strengths of representations. Percept Psychophys. 1987;42:515–525. doi: 10.3758/bf03207983. [DOI] [PubMed] [Google Scholar]
- Evans PM, Craig JC. Temporal integration and vibrotactile backward masking. J Exp Psychol Hum Percept Perform. 1986;12:160–168. doi: 10.1037//0096-1523.12.2.160. [DOI] [PubMed] [Google Scholar]
- Ferrington DG, Nail BS, Rowe M. Human tactile detection thresholds: modification by inputs from specific tactile receptor classes. J Physiol. 1977;272:415–433. doi: 10.1113/jphysiol.1977.sp012052. [DOI] [PMC free article] [PubMed] [Google Scholar]
- Francisco E, Tannan V, Zhang Z, Holden J, Tommerdahl M. Vibrotactile amplitude discrimination capacity parallels magnitude changes in somatosensory cortex and follows Weber's law. Exp Brain Res. 2008;191:49–56. doi: 10.1007/s00221-008-1494-6. [DOI] [PubMed] [Google Scholar]
- Gescheider GA, Bolanowski SJ, Jr, Verrillo RT. Vibrotactile masking: effects of stimulus onset asynchrony and stimulus frequency. J Acoust Soc Am. 1989;85:2059–2064. doi: 10.1121/1.397858. [DOI] [PubMed] [Google Scholar]
- Gescheider GA, Bolanowski SJ, Jr, Verrillo RT, Arpajian DJ, Ryan TF. Vibrotactile intensity discrimination measured by three methods. J Acoust Soc Am. 1990;87:330–338. doi: 10.1121/1.399300. [DOI] [PubMed] [Google Scholar]
- Gescheider GA, Valetutti AA, Jr, Padula MC, Verrillo RT. Vibrotactile forward masking as a function of age. J Acoust Soc Am. 1992;91:1690–1696. doi: 10.1121/1.402448. [DOI] [PubMed] [Google Scholar]
- Gescheider GA, Bolanowski SJ, Hall KL, Hoffman KE, Verrillo RT. The effects of aging on information-processing channels in the sense of touch: I. Absolute sensitivity. Somatosens Mot Res. 1994;11:345–357. doi: 10.3109/08990229409028878. [DOI] [PubMed] [Google Scholar]
- Gescheider GA, Santoro KE, Makous JC, Bolanowski SJ. Vibrotactile forward masking: effects of the amplitude and duration of the masking stimulus. J Acoust Soc Am. 1995;98:3188–3194. doi: 10.1121/1.413808. [DOI] [PubMed] [Google Scholar]
- Gescheider GA, Bolanowski SJ, Pope JV, Verrillo RT. A four-channel analysis of the tactile sensitivity of the fingertip: frequency selectivity, spatial summation, and temporal summation. Somatosens Mot Res. 2002;19:114–124. doi: 10.1080/08990220220131505. [DOI] [PubMed] [Google Scholar]
- Gescheider GA, Bolanowski SJ, Verrillo RT. Some characteristics of tactile channels. Behav Brain Res. 2004;148:35–40. doi: 10.1016/s0166-4328(03)00177-3. [DOI] [PubMed] [Google Scholar]
- Goble AK, Collins AA, Cholewiak RW. Vibrotactile threshold in young and old observers: the effects of spatial summation and the presence of a rigid surround. J Acoust Soc Am. 1996;99:2256–2269. doi: 10.1121/1.415413. [DOI] [PubMed] [Google Scholar]
- Goldreich D, Kanics IM. Tactile acuity is enhanced in blindness. J Neurosci. 2003;23:3439–3445. doi: 10.1523/JNEUROSCI.23-08-03439.2003. [DOI] [PMC free article] [PubMed] [Google Scholar]
- Goldreich D, Kanics IM. Performance of blind and sighted humans on a tactile grating detection task. Percept Psychophys. 2006;68:1363–1371. doi: 10.3758/bf03193735. [DOI] [PubMed] [Google Scholar]
- Grant AC, Zangaladze A, Thiagarajah MC, Sathian K. Tactile perception in developmental dyslexia: a psychophysical study using gratings. Neuropsychologia. 1999;37:1201–1211. doi: 10.1016/s0028-3932(99)00013-5. [DOI] [PubMed] [Google Scholar]
- Grant AC, Thiagarajah MC, Sathian K. Tactile perception in blind Braille readers: a psychophysical study of acuity and hyperacuity using gratings and dot patterns. Percept Psychophys. 2000;62:301–312. doi: 10.3758/bf03205550. [DOI] [PubMed] [Google Scholar]
- Hyllienmark L, Brismar T, Ludvigsson J. Subclinical nerve dysfunction in children and adolescents with IDDM. Diabetologia. 1995;38:685–692. doi: 10.1007/BF00401840. [DOI] [PubMed] [Google Scholar]
- Johnson KO, Lamb GD. Neural mechanisms of spatial tactile discrimination: neural patterns evoked by Braille-like dot patterns in the monkey. J Physiol. 1981;310:117–144. doi: 10.1113/jphysiol.1981.sp013540. [DOI] [PMC free article] [PubMed] [Google Scholar]
- Kirman JH. Forward and backward tactile recognition masking. J Gen Psychol. 1984;111:83–99. doi: 10.1080/00221309.1984.9921100. [DOI] [PubMed] [Google Scholar]
- Kontsevich LL, Tyler CW. Bayesian adaptive estimation of psychometric slope and threshold. Vision Res. 1999;39:2729–2737. doi: 10.1016/s0042-6989(98)00285-5. [DOI] [PubMed] [Google Scholar]
- Laasonen M, Service E, Virsu V. Temporal order and processing acuity of visual, auditory, and tactile perception in developmentally dyslexic young adults. Cogn Affect Behav Neurosci. 2001;1:394–410. doi: 10.3758/cabn.1.4.394. [DOI] [PubMed] [Google Scholar]
- Legge GE, Madison C, Vaughn BN, Cheong AM, Miller JC. Retention of high tactile acuity throughout the life span in blindness. Percept Psychophys. 2008;70:1471–1488. doi: 10.3758/PP.70.8.1471. [DOI] [PMC free article] [PubMed] [Google Scholar]
- Levänen S, Hamdorf D. Feeling vibrations: enhanced tactile sensitivity in congenitally deaf humans. Neurosci Lett. 2001;301:75–77. doi: 10.1016/s0304-3940(01)01597-x. [DOI] [PubMed] [Google Scholar]
- Levänen S, Jousmäki V, Hari R. Vibration-induced auditory-cortex activation in a congenitally deaf adult. Curr Biol. 1998;8:869–872. doi: 10.1016/s0960-9822(07)00348-x. [DOI] [PubMed] [Google Scholar]
- Liotti M, Ryder K, Woldorff MG. Auditory attention in the congenitally blind: where, when and what gets reorganized? Neuroreport. 1998;9:1007–1012. doi: 10.1097/00001756-199804200-00010. [DOI] [PubMed] [Google Scholar]
- Makous JC, Gescheider GA, Bolanowski SJ. Decay in the effect of vibrotactile masking. J Acoust Soc Am. 1996;99:1124–1129. doi: 10.1121/1.414597. [DOI] [PubMed] [Google Scholar]
- Mountcastle VB, LaMotte RH, Carli G. Detection thresholds for stimuli in humans and monkeys: comparison with threshold events in mechanoreceptive afferent nerve fibers innervating the monkey hand. J Neurophysiol. 1972;35:122–136. doi: 10.1152/jn.1972.35.1.122. [DOI] [PubMed] [Google Scholar]
- Nolano M, Provitera V, Crisci C, Stancanelli A, Wendelschafer-Crabb G, Kennedy WR, Santoro L. Quantification of myelinated endings and mechanoreceptors in human digital skin. Ann Neurol. 2003;54:197–205. doi: 10.1002/ana.10615. [DOI] [PubMed] [Google Scholar]
- Oldfield RC. The assessment and analysis of handedness: the Edinburgh inventory. Neuropsychologia. 1971;9:97–113. doi: 10.1016/0028-3932(71)90067-4. [DOI] [PubMed] [Google Scholar]
- Pascual-Leone A, Torres F. Plasticity of the sensorimotor cortex representation of the reading finger in Braille readers. Brain. 1993;116:39–52. doi: 10.1093/brain/116.1.39. [DOI] [PubMed] [Google Scholar]
- Peters RM, Hackeman E, Goldreich D. Diminutive digits discern delicate details: fingertip size and the sex difference in tactile spatial acuity. J Neurosci. 2009;29:15756–15761. doi: 10.1523/JNEUROSCI.3684-09.2009. [DOI] [PMC free article] [PubMed] [Google Scholar]
- Röder B, Rösler F, Spence C. Early vision impairs tactile perception in the blind. Curr Biol. 2004;14:121–124. [PubMed] [Google Scholar]
- Sadato N, Pascual-Leone A, Grafman J, Ibañez V, Deiber MP, Dold G, Hallett M. Activation of the primary visual cortex by Braille reading in blind subjects. Nature. 1996;380:526–528. doi: 10.1038/380526a0. [DOI] [PubMed] [Google Scholar]
- Sadato N, Pascual-Leone A, Grafman J, Deiber MP, Ibañez V, Hallett M. Neural networks for Braille reading by the blind. Brain. 1998;121:1213–1229. doi: 10.1093/brain/121.7.1213. [DOI] [PubMed] [Google Scholar]
- Sadato N, Okada T, Honda M, Yonekura Y. Critical period for cross-modal plasticity in blind humans: a functional MRI study. Neuroimage. 2002;16:389–400. doi: 10.1006/nimg.2002.1111. [DOI] [PubMed] [Google Scholar]
- Sathian K, Zangaladze A. Tactile learning is task specific but transfers between fingers. Percept Psychophys. 1997;59:119–128. doi: 10.3758/bf03206854. [DOI] [PubMed] [Google Scholar]
- Seah SA, Griffin MJ. Normal values for thermotactile and vibrotactile thresholds in males and females. Int Arch Occup Environ Health. 2008;81:535–543. doi: 10.1007/s00420-007-0252-6. [DOI] [PubMed] [Google Scholar]
- Soneda T, Nakano K. Investigation of vibrotactile sensation of human fingerpads by observation of contact zones. Tribol Int. 2010;43:210–217. [Google Scholar]
- Sterr A, Müller MM, Elbert T, Rockstroh B, Pantev C, Taub E. Perceptual correlates of changes in cortical representation of fingers in blind multifinger Braille readers. J Neurosci. 1998;18:4417–4423. doi: 10.1523/JNEUROSCI.18-11-04417.1998. [DOI] [PMC free article] [PubMed] [Google Scholar]
- Stevens AA, Weaver K. Auditory perceptual consolidation in early-onset blindness. Neuropsychologia. 2005;43:1901–1910. doi: 10.1016/j.neuropsychologia.2005.03.007. [DOI] [PubMed] [Google Scholar]
- Stevens JC. Aging and spatial acuity of touch. J Gerontol. 1992;47:35–40. doi: 10.1093/geronj/47.1.p35. [DOI] [PubMed] [Google Scholar]
- Stevens JC, Choo KK. Spatial acuity of the body surface over the life span. Somatosens Mot Res. 1996;13:153–166. doi: 10.3109/08990229609051403. [DOI] [PubMed] [Google Scholar]
- Stevens JC, Foulke E, Patterson MQ. Tactile acuity, aging, and Braille reading in long-term blindess. J Exp Psychol Appl. 1996;2:91–106. [Google Scholar]
- Stuart M, Turman AB, Shaw J, Walsh N, Nguyen V. Effects of aging on vibration detection thresholds at various body regions. BMC Geriatr. 2003;3:1. doi: 10.1186/1471-2318-3-1. [DOI] [PMC free article] [PubMed] [Google Scholar]
- Talbot WH, Darian-Smith I, Kornhuber HH, Mountcastle VB. The sense of flutter-vibration: comparison of the human capacity with response patterns of mechanoreceptive afferents from the monkey hand. J Neurophysiol. 1968;31:301–334. doi: 10.1152/jn.1968.31.2.301. [DOI] [PubMed] [Google Scholar]
- Van Boven RW, Hamilton RH, Kauffman T, Keenan JP, Pascual-Leone A. Tactile spatial resolution in blind Braille readers. Neurology. 2000;54:2230–2236. doi: 10.1212/wnl.54.12.2230. [DOI] [PubMed] [Google Scholar]
- Verrillo RT. Vibrotactile thresholds measured at the finger. Percept Psychophys. 1971;9:329–330. [Google Scholar]
- Verrillo RT. Comparison of vibrotactile threshold and suprathreshold responses in men and women. Percept Psychophys. 1979;26:20–24. [Google Scholar]
- Verrillo RT. Age related changes in the sensitivity to vibration. J Gerontol. 1980;35:185–193. doi: 10.1093/geronj/35.2.185. [DOI] [PubMed] [Google Scholar]
- Wan CY, Wood AG, Reutens DC, Wilson SJ. Congenital blindness leads to enhanced vibrotactile perception. Neuropsychologia. 2010;48:631–635. doi: 10.1016/j.neuropsychologia.2009.10.001. [DOI] [PubMed] [Google Scholar]
- Weaver KE, Stevens AA. Auditory gap detection in the early blind. Hear Res. 2006;211:1–6. doi: 10.1016/j.heares.2005.08.002. [DOI] [PubMed] [Google Scholar]


