The gene product, phosphodiesterase 4D (PDE4D) is anchored at the centrosome-Golgi cell region by phosphodiesterase 4D interacting protein (PDE4DIP). PDE4D is a member of a family of phosphohydrolyases. These enzymes are involved in signal transduction and hydrolyze 3' cyclic phosphate bonds in 3', 5'- cGMP and 3',5'-cAMP to energyze several reactions in the cell. The latter are termed second messengers and their rates of degradation are regulated. Eleven subtypes of PDEs comprise reactions related to memory and learning as well as other processes including immune cell activation, hormonesecretion, smooth vascular muscle action, platelet aggregation, and cardiac contractility [3].
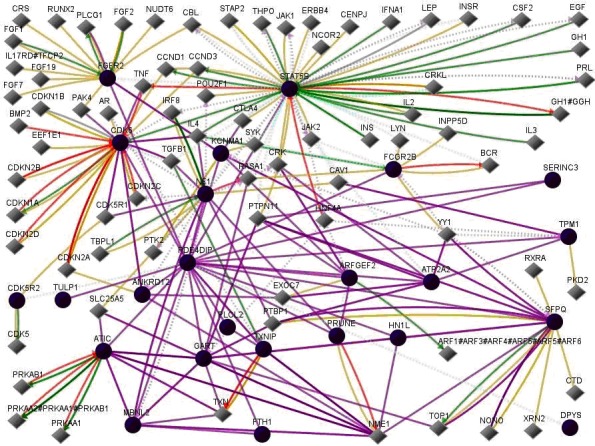
The use of GenePro SA Biosciences [2] indicates that PDE4DIP interacts with 23 other genes ANKRD12, ARFGEF2, ATIC, ATP2A2, CDK5R2, CDK6, DPYS, FCGR2B, FGFR2, FTH1, GART, HN1L, KCNMA1, MBNL2, NF1, PLCL2, PRUNE, SERINC3, SFPQ, STAT5B, TPM1, TULP1, and TXNIP. When PDE4DIP and the 23 genes are used asinput then the output is as shown in (Figure 1). Figure 1 shows 100 interactions related toPDE4DIP, which is expressed in multiple regions of brain [3].
Figure 1.

PDE4DIPinteractions. In this figure, line-colors and various interactions with other genes are red Down-regulation, green Up-regulation, beige Regulation, purple Co-expression, brown Physical Interaction, turquoise dotted Predicted Protein Interaction, and mauve dotted Predicted TFactor Regulation. (GenePro SA Biosciences, http://www.sabiosciences.com/).
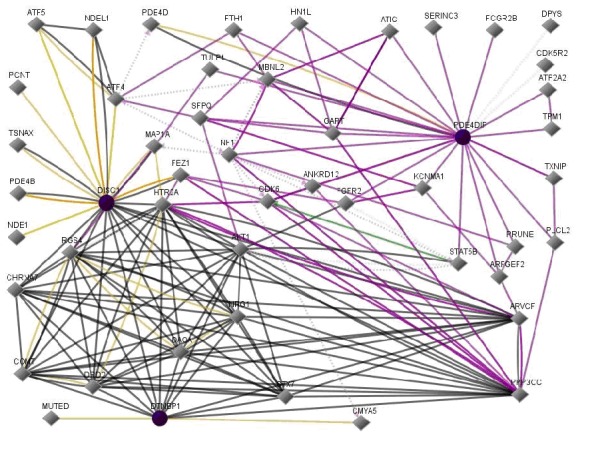
As a further example illustrating gene product interactions implicated in the disease Schizophrenia, (Figure 2) shows interactions between Disrupted in Schizophrenia 1 (DISC1) and dysbindin (DTNBP1) [4]. In addition, PDE4DIP is included [3].
Figure 2.

DISC1, DTNBP1, and PDE4DIPinteractions. In this figure, line-colors and various interactions with other genes are red Down-regulation, green Up-regulation, beige Regulation, purple Co-expression, brown Physical Interaction, turquoise dotted Predicted Protein Interaction, and mauve dotted Predicted TFactor Regulation. (GenePro SA Biosciences, http://www.sabiosciences.com/).
As an exercise, it is suggested for the interested reader to track and categorize the various interacting genes identified in the figures.
Acknowledgments
There are no financial conflicts.
Footnotes
Citation:Shapshak, Bioinformation 8(16): 740-741 (2012)
References
- 1. http://www.genecards.org/
- 2. http://www.sabiosciences.com.
- 3.S Kim, et al. Transl Psychiatry. 2012;8:e113. doi: 10.1038/tp.2012.42. [DOI] [PMC free article] [PubMed] [Google Scholar]
- 4.LM Camargo, et al. Mol Psychiatry. 2007;12:74. doi: 10.1038/sj.mp.4001880. [DOI] [PubMed] [Google Scholar]


