

Abstract
For improvement of prognosis for glioblastoma patients, which remains poor, identification and targeting of glioblastoma progenitor cells are crucial. In this study, we found that the Cluster of Differentiation (CD)166/activated leukocyte cell adhesion molecule (ALCAM) was highly expressed on CD133+ glioblastoma progenitor cells. ALCAM+CD133+ cells were highly enriched with tumor sphere-initiating cells in vitro. Among gliomas with isocitrate dehydrogenase-1/R132H mutation, the frequencies of ALCAM+ cells were significantly higher for glioblastomas than for World Health Organization grade II or III gliomas. The function of ALCAM in glioblastoma was then investigated. An in vitro invasion assay showed that transfection of ALCAM small interfering RNA or small hairpin RNA into glioblastoma cells significantly increased cell invasion without affecting cell proliferation. A soluble isoform of ALCAM (sALCAM) was also expressed in all glioblastoma samples and at levels that correlated well with ALCAM expression levels. In vitro invasion of glioblastoma cells was significantly enhanced by administration of purified sALCAM. Furthermore, overexpression of sALCAM in U87MG glioblastoma cells promoted tumor progression in i.c. transplants into immune-deficient mice. In summary, we were able to show that ALCAM constitutes a novel glioblastoma progenitor cell marker. We could also demonstrate that ALCAM and its soluble isoform are involved in the regulation of glioblastoma invasion and progression.
Keywords: activated leukocyte cell adhesion molecule, cancer stem cell, CD166, glioblastoma, invasion
Glioblastoma is one of the most frequently occurring malignancies in the CNS. Despite intensive treatment, including surgery, radiation, and chemotherapy, the prognosis for glioblastoma is still very poor, and the median survival time is only 12–15 months.1 One major reason for the extremely poor prognosis is that glioblastoma progenitor cells possessing tumor-initiating ability2,3 are resistant to radiation and chemotherapy.4 Glioblastoma progenitor cells reportedly exist in the Cluster of Differentiation (CD)133+ glioblastoma cell population.2 While CD133 is the most promising marker for the identification of glioblastoma progenitor cells, additional cell surface markers for glioblastoma progenitor cells are needed for more efficient enrichment of these cells and identification of their location in a microenvironment. Recently, stage-specific embryonic antigen–1,5 A2B5,6 neural cell adhesion molecule L1,7 and integrin alpha-68 have been mentioned as candidates for novel glioblastoma stem/progenitor cell markers.
One main source of the high malignancy of glioblastoma is the invasion of isolated tumor cells into the surrounding parenchyma.9 It is therefore important to clarify the molecular mechanism of this strong invasiveness of glioblastoma cells, and several molecules, such as cadherin,10 neural cell adhesion molecule,11 and integrin,12 are reportedly involved in glioblastoma invasion.
The CD166/activated leukocyte cell adhesion molecule (ALCAM) is a member of the immunoglobulin superfamily and is widely expressed in various tissues, such as neurons, fibroblasts, endothelial cells, and keratinocytes.13–15 ALCAM is involved in neurogenesis,13 angiogenesis, hematopoiesis,16 leukocyte trafficking,17 and hematopoietic stem cell maintenance in bone marrow niches.18 It is reported to be a cell surface marker for mesenchymal stem cells19,20 and hematopoietic progenitor cells.16,21 It is also expressed in several kinds of cancer and is reportedly a marker for cancer stem cells in colon cancer22 and prostate cancer.23 However, there have been no reports about ALCAM expression on glioblastoma cells. On the other hand, functional roles of ALCAM have been investigated in several kinds of cancer,24 especially in metastatic melanoma, in which it functions as a cell surface sensor for cell density and controls the transition from local cell proliferation to tissue invasion.25,26 Moreover, ALCAM was found to be required for promoting cell invasion because of its efficient triggering of the activation of the metalloproteinase cascade in response to extensive cell-to-cell and cell-to-matrix contacts.25
The soluble isoform of ALCAM (sALCAM) was isolated as an alternative short ALCAM transcript comprising only the first 3 exons.27 Since the sALCAM protein possesses the immunoglobulin domain D1, which is required for homophilic ALCAM binding, sALCAM impairs cell-to-cell interaction through homophilic ALCAM binding,27 and as a result affects the coordination of local tumor growth, invasion, and metastasis.28 It was also reported that sALCAM attenuates melanoma invasion.28
In this study, we examined whether ALCAM could serve as a progenitor cell marker for glioblastoma, while the clinical significance of ALCAM as an indicator of the histological grade or as a prognostic factor was also investigated. In addition, we investigated the functional roles of ALCAM and sALCAM in glioblastoma.
Materials and Methods
Glioma Samples and Clinical Data
For fluorescence activated cell sorter (FACS) analysis, 12 glioblastoma samples from patients who had undergone surgery at Osaka University Hospital between 2007 and 2008 were analyzed. For immunohistochemical analysis, formalin-fixed paraffin-embedded (FFPE) glioma samples from patients who had undergone surgery at Osaka University Hospital between 2003 and 2010 were analyzed. For Kaplan–Meier analysis, we obtained clinical data to estimate progression-free survival (PFS) and overall survival (OS) from our database or medical records of glioblastoma patients who had undergone maximal surgical resection and chemoradiation therapy between 2005 and 2010 at Osaka University Hospital.
This study was approved by the institutional review board of Osaka University School of Medicine. The details of the study were explained to glioma patients before they underwent surgery at Osaka University Hospital. When written agreement had been obtained from a patient for the use of the resected tissue for this research, a part of the tissue was subjected to the analyses in this study.
FACS Analysis
Glioblastoma samples were first minced with a scalpel and then dissociated using a neural cell dissociation kit containing papain (Miltenyi Biotec), according to the manufacturer's instructions. Single-cell suspensions generated from the glioblastoma samples were stained with biotin-conjugated anti-CD133 monoclonal antibody (mAb) (AC133; Miltenyi Biotec), phycoerythrin-conjugated anti-ALCAM mAb (3A6; BD Pharmingen), CD45-allophycocyanin (APC) (BD Pharmingen), CD31-APC (eBioscience), and then with streptavidin–fluorescein isothiocyanate (BD Pharmingen) or Cy7PE (eBioscience). The stained suspensions were then analyzed on FACSAria flow cytometer (Becton Dickinson).
Tumor-Sphere Formation Assay
Five hundred FACS-sorted cells were seeded in 96-well plates and cultured in a serum-free medium supplemented with 20 ng/mL of epidermal growth factor (R&D Systems), 20 ng/mL of basic fibroblast growth factor (Peprotech), and 20 ng/mL of leukemia inhibitory factor (Millipore) in 5% CO2. Cells were nourished every 2 days by refreshing half of the medium. The tumor spheres were counted 14 days after the seeding.
Quantitative PCR
Total RNA was extracted from the glioma cell line and primary glioblastoma samples using Trizol (Invitrogen Life Technologies) according to the manufacturer's instructions. cDNA was generated using Moloney murine leukemia virus reverse transcriptase (Promega) and then subjected to quantitative PCR with SYBR (Synergy Brands) green in an Applied Biosystems 7900HT system. To measure ALCAM or sALCAM expression, the following primers were used: for ALCAM: CGTGAATTCCACCAAGAAGGAGGAGGA for sense primers and TCTGTCTTTGTATTCTGGTACATCG for antisense primers; for sALCAM: AGACAGATTGAACCTCTCTCAGAAAAC for sense primers and GCTGCAGACTACTTACTGAACACC for antisense primers.
Knockdown of ALCAM Expression by siRNA and shRNA
Anti-ALCAM small interfering (si)RNA, short hairpin (sh)RNA, or control RNA was transfected to U87MG and U251 cells (American Type Culture Collection) using Lipofectamine RNAimax reagent (Invitrogen). Sequences of siRNAs specific for ALCAM were: siRNA1: UCUACAAUGAGAGUCAAUGACUCUC and GAGAGUCAUUGACUCUCAUUGUAGA, siRNA2: AGUAAUUGUCCACUGAAUGGCUGGC and GCCAGCCAUUCAGUGGACAAUUACU. Stealth RNA interference negative control (Invitrogen) was used as the negative control siRNA. Two days after transfection, cells were subjected to FACS analysis for detection of ALCAM expression and to a Matrigel invasion assay. The cell proliferation assay was started soon after siRNA transduction.
To establish cell lines in which ALCAM expression was stably knocked down, we used a Mission shRNA (Sigma Aldrich) lentivirus carrying an shRNA sequence against ALCAM (CCGGCAGCCATGATAATAGGTCATACTCGAGTATGACCTATTATCATGGCTGTTTTTG). Lentivirus was produced by transfection of the lentiviral vector with the gag-pol–expressing vector and the vector expressing a vesicular stomatitis virus-glycoprotein envelope (both were kindly donated by Hiroyuki Miyoshi). Viruses were concentrated by centrifugation with PEG-it (System Bioscience). U87MG and U251 glioblastoma cells were infected with lentivirus carrying ALCAM-shRNA. Knockdown of ALCAM was confirmed by FACS analysis.
Generation of sALCAM Isoform-Expressing Glioblastoma Cells
The expression vector carrying flag-tagged sALCAM cDNA (sALCAM-p3XFLAG) (Sigma Aldrich)27 was kindly donated by Koji Ikeda MD of Kyoto Prefectural University of Medicine. U87MG glioblastoma cells were transduced with flag-tagged sALCAM cDNA by means of electroporation. Stable transfectants were selected by culturing cells in medium supplemented with 500 μg/mL of G418 (Roche). The sALCAM-Flag protein was detected by western blotting using anti-Flag M2 antibody (Sigma Aldrich) and anti-mouse immunoglobulin G-alkaline phosphatase (Santa Cruz Biotechnology). The sALCAM-Flag protein was purified from U87MG expressing sALCAM-Flag cells using anti-Flag affinity gel (Sigma Aldrich) according to the manufacturer's instructions.
Invasion Assay
The invasiveness of U87MG and U251 cells was assayed with a modified Boyden Chamber Matrigel method29 using the Biocoat Matrigel invasion chamber (Becton Dickinson Bioscience) according to the manufacturer's instructions. Cells were washed with phosphate buffered saline (PBS) and harvested using a cell dissociation buffer (Invitrogen), after which 2.5 × 10⁴ cells in serum-free Dulbecco's modified Eagle's medium (DMEM) were seeded onto Matrigel-coated filters. DMEM containing 10% fetal bovine serum was added to the lower compartment, and cells were incubated for 48 h. After removal of the cells that remained in the top chamber, the top surface of each membrane was cleared of cells with a cotton swab. Cells that had penetrated to the bottom side of the membrane were then fixed in buffered formalin, stained with a Diff-Quik Stain Set (Wako), and counted.
Gelatin Zymography
The same number of cells (5 × 10⁵) were placed in 100 μL of serum-free medium (DMEM/F12 Ham's) and incubated for 24 h. Supernatant from each well was subjected to gelatin zymography with zymogram gel (Tris-glycine; Invitrogen) according to the manufacturer's instructions. The gels were then stained with Coomasie brilliant blue R-250.
Intracranial Xenograft Model
Newborn Rag2−/−γc−/− mice (kindly donated by Irving Weissman, MD, of Stanford University) were used as recipients. Pups were anesthetized on ice, and glioblastoma cells (2 × 10⁵) in 2 μL of PBS were injected into the right lateral ventricle with a stereotactic injector (Stoelting).
Immunohistochemical Analysis
For double immunostaining, indirect immunoalkaline phosphatase and immunoperoxidase methods were used. Fresh frozen glioblastoma tissue sections (6 μm) were fixed in pure acetone for 10 min and then in a formol-calcium solution for 1 min after rehydration in PBS. After washing in PBS and incubation with a blocking solution (Block Ace; DS Pharma Biomedical) for 10 min, the sections were incubated with the first mAb, anti-CD166 (3A6; Abcam), for 1 h at room temperature. Each subsequent step was followed by washing 3 times with PBS for 2 min. Bound mAb was detected with an alkaline phosphatase-labeled second antibody for 20 min, and the sections were fixed further with 1% glutaraldehyde (Nacalai Tesque) in PBS for 30 s. The labeled cells were then colored red with Alkaline Phosphatase Substrate Kit I (Vector red; Vector Laboratories). The sections were then incubated with the biotin-labeled second mAb, anti-CD31 (eBioscience), reacted with streptavidin peroxidase (N-Histofine; Nichirei), and colored brown with 3,3′-diaminobenzidine (DAB) hydrochloride (Histofine Simple Stain DAB; Nichirei). Levamisole (Sigma Chemical) and hydrogen peroxide solution (Nacalai Tesque) were used to inhibit endogenous alkaline phosphatase and peroxidase activity, respectively. The sections were counterstained with Lillie-Mayer's hematoxylin solution (Wako) and mounted in Aquatex (Merck).
FFPE glioma samples were also stained with anti-ALCAM mAb (3A6; Abcam) and anti-IDH1-R132H mAb (H09; Dianova). The histofine simple stain MAX-PO (Multi; Nichirei) was used as a secondary antibody. For visualization, the specimens were reacted with 3,3′-DAB tetrahydrochloride (Dojindo).
Statistical Analysis
Student's t-test was used to determine statistical significance for the in vitro experiments. For the analysis of clinical data and in vivo experiments, Kaplan–Meier analysis and the Wilcoxon test were used. For all analyses, differences were defined as statistically significant at P < .05.
Results
ALCAM Is a Glioblastoma Progenitor Cell Marker
ALCAM expression on CD31−CD45−CD133+ glioblastoma cells (CD133+ glioblastoma cells) or CD31−CD45−CD133− glioblastoma cells (CD133− glioblastoma cells) was subjected to FACS analysis. Ratios of ALCAM+ cells were significantly (P < .05, n = 12) higher in the CD133+ glioblastoma cell population (37.0 ± 10.1% [1.9%–95.4%]) than in the CD133− cell population (17.4 ± 6.2% [0%–57.6%]) (Fig. 1A). CD133+ glioblastoma cells could be separated into an ALCAM+ and an ALCAM− population. To examine whether ALCAM+CD133+ glioblastoma cells were enriched with glioblastoma progenitor cells, a tumor-sphere formation assay was performed with fluorescence activated cell sorted ALCAM+CD133+ or ALCAM−CD133+ glioblastoma cells. Five glioblastoma samples were examined, and cells that formed tumor spheres accounted for 4.6 ± 0.4 per 500 cells in the ALCAM+CD133+ fraction, and for 0.6 ± 0.6 per 500 cells in the ALCAM−CD133+ fraction (P< .05, Fig. 1B). These results indicate that ALCAM in combination with CD133 can be used as a glioblastoma progenitor cell marker. Furthermore, in a glioblastoma sample that contained no CD133+ cells, only ALCAM+ cells formed tumor spheres (Fig. 1C), showing that ALCAM is a potential marker for glioblastoma progenitor cells even in CD133– glioblastoma samples. Immunohistochemical analysis with anti-ALCAM mAb identified distinct ALCAM+CD31− glioblastoma cells, whereas endothelial cells were ALCAM+CD31+ (Fig. 1D).
Fig. 1.

ALCAM is a glioblastoma progenitor cell marker. (A) Flow cytometric analyses of CD45−CD31− cells from glioblastoma samples. Three representative cases are shown. CD45−CD31− cells were separated into CD133+ and CD133−cell populations and then analyzed for ALCAM expression. (B) Tumor-sphere formation assays using FACS-sorted CD133+ALCAM+ cells or CD133+ALCAM− glioblastoma cells. (C) Tumor-sphere assays using CD133− ALCAM+ cells or CD133− ALCAM− cells in a glioblastoma sample that contained no CD133+ cells. (D) Immunohistochemical staining of ALCAM and CD31 expression on glioblastoma samples. Red (vector red): ALCAM; brown (DAB):CD31.
Frequency of ALCAM+ Cells Correlates with Histological Grade in IDH1-R132H Mutation-Positive Glioma and Prognosis for IDH1-R132H Mutation-Negative Primary Glioblastoma Patients
It is now known that World Health Organization (WHO) grade II gliomas are almost uniformly characterized by isocitrate dehydrogenase (IDH)-1 mutations, while most primary glioblastomas are IDH1 wild type.30–33 In addition, the presence of IDH1 mutation reportedly correlates well with positive staining for anti-IDH1-R132H mAb in immunohistochemical studies.34,35 IDH1-R132H+ glioma samples (Fig. 2A) were examined for ALCAM expression. For this analysis, we used 16 WHO grade II glioma samples (10 diffuse astrocytomas, 3 oligoastrocytomas, and 3 oligodendrogliomas), 10 WHO grade III glioma samples (6 anaplastic astrocytomas, 3 anaplastic oligoastrocytomas, and 1 anaplastic oligodendroglioma), and 9 glioblastoma samples. The percentages of ALCAM+ cells were 27.7 ± 9.1, 29.4 ± 20.2, and 48.7 ± 8.9% for WHO grades II, III, and IV, respectively (Fig. 2B). The frequency of ALCAM+ cells was significantly (P< .05) higher in glioblastomas than in WHO grade II or III gliomas.
Fig. 2.

ALCAM expression correlates with histological grade of glioma and prognosis for glioblastoma patients. (A) Immunohistochemical staining of anti-IDH1-R132H mAb in astrocytoma samples. (B) Percentages of ALCAM+ cells in IDH1-R132H mutation+ WHO grades II–IV glioma specimens. The horizontal bar shows the average percentages of ALCAM+ glioblastoma cells. (C) Plots for progression-free survival and overall survival of primary glioblastoma patients with high percentages (≧60%) and of those with low percentages (<60%) of ALCAM+ cells.
We also examined whether the frequencies of ALCAM+ cells correlated with the prognosis for primary glioblastoma (IDH1-R132H mutation–) patients. PFS and OS were compared for glioblastoma patients with a high percentage and those with a low percentage of ALCAM+ cells. At a cutoff value of 60% ALCAM+ cells, median PFS for the patients with a high percentage of ALCAM+ cells (115.75 ± 67.41 days, n= 12) was significantly (P< .05) higher than for their low-percentage counterparts (447.97 ± 308.36 days, n= 27) (Fig. 2C). The corresponding median OS was 275.77 ± 151.27 and 731.61 ± 300.69 days (P < .05) (Fig. 2C). However, at a cutoff value of 50% or less of ALCAM+ cells, the difference in PFS or OS was not statistically significant (data not shown).
ALCAM Is Involved in the Regulation of Glioblastoma Cell Invasion
The functional roles of ALCAM in glioblastoma were investigated next. Two sequences of siRNA specific for ALCAM were used for knocking down ALCAM in glioblastoma cells. A comparison between cell growth of anti-ALCAM siRNA-transfected and negative control siRNA-transfected U87MG glioblastoma cells (Fig. 3A) showed that the reduction in ALCAM expression had no effect on cell growth (Fig. 3B). We then used a modified Boyden Chamber Matrigel assay to examine the effects of ALCAM knockdown on U87MG and U251 glioblastoma cell invasion. The numbers of cells that reached the bottom of the filters through the Matrigel were 23.3 ± 6.8, 66.7 ± 12.9, and 5.7 ± 1.9 of the ALCAM siRNA1, ALCAM siRNA2, and negative control siRNA-transfected U87MG cells, respectively, and were 221.2 ± 9.3 and 50.2 ± 8.4 of the ALCAM shRNA- and negative control-transfected U251 cells, respectively (Fig. 3C), indicating that downregulation of ALCAM expression of glioblastoma cells significantly (P < .05) enhanced tumor cell invasion. Conditioned media from cultures of ALCAM siRNA- or negative control siRNA-transfected U87MG cells were analyzed with gelatin zymography. Conversion of promatrix metalloproteinase (MMP)-2 to active MMP-2 was observed in both of the conditioned media, while there was no difference in the quantity of active MMP-2 between ALCAM siRNA-transfected U87MG and control siRNA-transfected cells (Fig. 3D).
Fig. 3.

Downregulation of ALCAM expression on glioblastoma cells promotes cell invasion. (A) FACS analysis of ALCAM expression on anti-ALCAM siRNA–transfected or negative control siRNA–transfected U87MG cells. (B) Comparison of cell proliferation between anti-ALCAM siRNA–transfected and negative control siRNA–transfected U87MG cells. (C) Matrigel invasion assay with anti-ALCAM siRNA–transfected, anti-ALCAM shRNA–transfected, or negative control–transfected U87MG and U251 cells. Bar graph shows numbers of cells having migrated through Matrigel layer. Representative pictures of cells having penetrated to the bottom side of the membrane. (D) Gelatin zymography using medium conditioned by anti-ALCAM siRNA–transfected or negative control siRNA–transfected U87MG cells.
The soluble isoform of ALCAM (sALCAM) expressed in glioblastoma cells enhances cell invasion in vitro and promotes tumor progression in vivo.
Endogenous expression levels of ALCAM and sALCAM in primary glioblastoma samples were examined by using quantitative real-time PCR (Fig. 4A). All primary glioblastoma samples expressed sALCAM. In addition, sALCAM expression levels in glioblastoma samples correlated well with ALCAM expression levels (Fig. 4A).
Fig. 4.

A soluble isoform of ALCAM is expressed in glioblastoma cells and promotes cell invasion. (A) Correlation between ALCAM mRNA expression and sALCAM mRNA expression in glioblastoma samples. (B) Detection by western blot with anti-FLAG mAb of sALCAM-FLAG protein in cell lysate of sALCAM-expressing U87MG cells. (C) Comparison of cell proliferation between empty vector-transduced U87MG cells (U87MG-mock) and sALCAM-expressing U87MG (U87MG-sALCAM) cells. Two independent clones of U87MG-sALCAM cells were used for the experiments. (D) Matrigel invasion assay with U87MG-mock or U87MG-sALCAM cells. Numbers of cells having passed through the Matrigel layer are shown. (E) Detection by western blot with anti-FLAG mAb of sALCAM-FLAG protein in culture supernatant of U87MG-sALCAM cells and purified sALCAM-FLAG. (F) Matrigel invasion assay with U87MG and U251 cells. Purified sALCAM (0.2 µg/mL, 1 µg/mL) was added to the upper chamber of the transwells.
To examine the functional role of sALCAM in glioblastoma cells, U87MG cells transduced with sALCAM-Flag or an empty vector (U87MG-sALCAM or U87MG-mock) were generated (Fig. 4B). There was no difference in cell proliferation between U87MG-mock and U87MG-sALCAM cells (Fig. 4C). We next used a modified Boyden Chamber Matrigel assay to examine whether sALCAM was involved in glioblastoma cell invasion. The numbers of cells that reached the bottom of the filters through the Matrigel were 30.8 ± 13.2, 27.0 ± 4.8, and 5.8 ± 1.8 of the U87MG-sALCAM clone 1, U87MG-sALCAM clone 2, and U87MG-mock cells, respectively. These results indicate that sALCAM expression in glioblastoma cells significantly (P < .05) enhances tumor cell invasion (Fig. 4D). Conditioned media from cultures of U87MG-sALCAM or U87MG-mock cells were also analyzed by means of gelatin zymography. Conversion of pro-MMP-2 to active MMP-2 was observed in both of the conditioned media, while there was no difference in the amount of active MMP-2 between ALCAM siRNA-transfected U87MG and control siRNA-transfected cells.
Western blotting with anti-Flag mAb led to the detection of sALCAM-Flag protein in the culture supernatant of U87MG-sALCAM cells (Fig. 4E). We used the anti-Flag affinity gel to purify the sALCAM-Flag protein (Fig. 4E) and then examined with an in vitro invasion assay whether this purified sALCAM protein promoted the invasion of glioblastoma cells. We found that the ability of invasion of U87MG and U251 cells was significantly (P < .05) increased by the addition of purified sALCAM, with the effect depending on the quantity added (Fig. 4F). This result makes it clear that sALCAM promotes the invasion of glioblastoma cells.
Next, we examined the effect of sALCAM on glioblastoma progression in vivo. Two clones of U87MG-sALCAM or U87MG-mock cells were injected i.c. into the right ventricle of the newborn pups of Rag2−/−γc−/− mice. Two independent clones of the U87MG-sALCAM cells were examined. Difference in the survival curve was significant (P < .05) for mice injected with sALCAM-expressing U87MG cells (both clone 1 and clone 2) and those with U87MG-mock cells, but was not significant for sALCAM-expressing clones 1 and 2 (Fig. 5A). All of the mice (n = 8) transplanted with the U87MG-sALCAM cells died of glioblastoma development within 35 days after tumor injection, while none of the mice transplanted with the U87MG-mock cells had developed glioblastoma by posttransplant day 35 (Fig. 5A and B), thus demonstrating that sALCAM significantly enhances tumor progression in vivo.
Fig. 5.
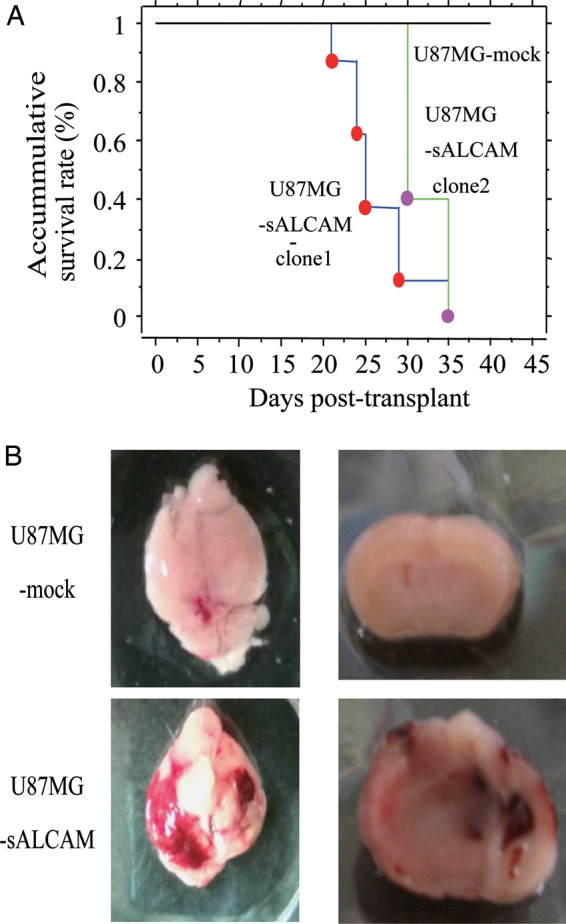
Expression of sALCAM in U87MG glioblastoma cells promotes tumor progression in vivo. (A) Newborn pups of Rag2−/−γc−/− mice were injected with U87MG-sALCAM or U87MG-mock cells. Two independent clones of U87MG-sALCAM cells were used for the experiments. Kaplan–Meier survival curve for each group is shown. (B) Representative photos of the brain of the mouse transplanted with U87MG-sALCAM cells and of the one transplanted with control U87MG cells.
Discussion
In this study we showed that ALCAM+ CD133+ glioblastoma cells are enriched with tumor sphere-initiating cells, indicating that ALCAM is a novel glioblastoma progenitor cell marker. Some researchers have reported that glioblastoma stem-like cells can be derived from CD133− cells,6,36,37 and we also found that some glioblastoma samples contained no CD133+ cells. For such a CD133− glioblastoma sample, ALCAM is also useful for the identification of glioblastoma progenitor cells. Furthermore, immunohistochemical analysis with anti-ALCAM mAb is effective for the identification of glioblastoma progenitor cells in tumor specimens.
While previous studies reported that ALCAM could be used as a prognostic factor for several types of cancers, their conclusions differed. Some studies concluded that high levels of ALCAM expression were related to poor prognosis for breast cancer,38 colorectal cancer,39 pancreatic cancer,40 and melanoma.41 On the other hand, other studies came to the conclusion that high ALCAM expression was a favorable prognostic factor for prostate cancer,42 breast cancer,43,44 and epithelial ovarian cancer.45 This is probably because, as discussed below, the function of ALCAM varies depending on the cell type and the microenvironment surrounding tumor cells. Our results showed that the frequencies of ALCAM+ cells in primary glioblastomas correlated significantly with both PFS and OS using an arbitrary cutoff value. We also examined other cutoff values of ≤50%, but the difference in survival was not significant statistically, which might be due to small patient numbers and/or the difficulties in matching other prognostic factors between the 2 groups. These suggested that the frequency of ALCAM+ cells is a candidate prognostic marker for glioblastoma, but its significance needs to be tested in further studies with greater numbers of patients using multivariate analysis.
Knockdown of ALCAM expression in glioblastoma cells resulted in promotion of tumor cell invasion without affecting cell proliferation. This finding is compatible with previously reported results for a metastatic melanoma cell line. In the case of melanoma, interference with endogenous ALCAM by the expression of an amino terminal-truncated ALCAM protein increased cell migration and invasive growth in vitro,26 while in a metastatic melanoma cell line, downregulation of ALCAM expression by siRNA inhibited MMP-2 activation.25 However, no such effect on MMP-2 was observed in the glioblastoma cells used in our experiments. The function of ALCAM may thus vary depending on the cell type and/or microenvironment.
Van Kilsdonk et al.28 showed that the soluble isoform of ALCAM attenuated the invasion of melanoma cell lines in vitro and also in reconstructed skin. This finding led us to hypothesize that sALCAM also attenuates the invasion of glioblastoma cells, and sALCAM was in fact highly expressed and secreted from glioblastoma cells. However, in contrast to our supposition, overexpression of sALCAM in glioblastoma cells enhanced tumor cell invasion in vitro and tumor progression in vivo. Another study found that sALCAM also promoted cell migration in endothelial cells in vitro.27 The functions of sALCAM may therefore also vary depending on the cell type and microenvironment.
In conclusion, ALCAM is expressed in glioblastoma progenitor cells. Frequencies of ALCAM-expressing cells may correlate with disease progression of glioma and prognosis of glioblastoma patients. Furthermore, we showed that not only membrane-bound ALCAM but also sALCAM are involved in the regulation of glioblastoma cell invasion.
Funding
This work was supported by a grant from the Knowledge Cluster Initiative (Stage II) established by the Ministry of Education, Culture, Sports, Science, and Technology of Japan (to Naoki Hosen) and from the Ministry of Education, Culture, Sports, Science, and Technology of Japan (grant 21591870 to Naoki Kagawa and grant 22791343 to Noriyuki Kijima).
Acknowledgments
We wish to thank Tal Raveh, PhD (Stanford University), for valuable technical advice, Irving L. Weissman, MD (Stanford University) for kindly donating Rag2−/−γc−/− mice, Koji Ikeda, MD (Kyoto Prefectural University of Medicine) for kindly donating sALCAM-p3XFLAG, Ms. Mariko Kakinoki (Osaka University) for data collection, and Ms. Mariko Kihara (Osaka University) for technical assistance.
Conflict of interest statement. None declared.
References
- 1.Stupp R, Mason WP, van den Bent MJ, et al. Radiotherapy plus concomitant and adjuvant temozolomide for glioblastoma. N Engl J Med. 2005;352:987–996. doi: 10.1056/NEJMoa043330. doi:10.1056/NEJMoa043330. [DOI] [PubMed] [Google Scholar]
- 2.Singh SK, Hawkins C, Clarke ID, et al. Identification of human brain tumour initiating cells. Nature. 2004;432:396–401. doi: 10.1038/nature03128. doi:10.1038/nature03128. [DOI] [PubMed] [Google Scholar]
- 3.Galli R, Binda E, Orfanelli U, et al. Isolation and characterization of tumorigenic, stem-like neural precursors from human glioblastoma. Cancer Res. 2004;64:7011–7021. doi: 10.1158/0008-5472.CAN-04-1364. doi:10.1158/0008-5472.CAN-04-1364. [DOI] [PubMed] [Google Scholar]
- 4.Bao S, Wu Q, McLendon RE, et al. Glioma stem cells promote radioresistance by preferential activation of the DNA damage response. Nature. 2006;444:756–760. doi: 10.1038/nature05236. doi:10.1038/nature05236. [DOI] [PubMed] [Google Scholar]
- 5.Son MJ, Woolard K, Nam DH, Lee J, Fine HA. SSEA-1 is an enrichment marker for tumor-initiating cells in human glioblastoma. Cell Stem Cell. 2009;4:440–452. doi: 10.1016/j.stem.2009.03.003. doi:10.1016/j.stem.2009.03.003. [DOI] [PMC free article] [PubMed] [Google Scholar]
- 6.Ogden AT, Waziri AE, Lochhead RA, et al. Identification of A2B5+CD133- tumor-initiating cells in adult human gliomas. Neurosurgery. 2008;62:505–514. doi: 10.1227/01.neu.0000316019.28421.95. discussion 14–5 doi:10.1227/01.neu.0000316019.28421.95. [DOI] [PubMed] [Google Scholar]
- 7.Bao S, Wu Q, Li Z, et al. Targeting cancer stem cells through L1CAM suppresses glioma growth. Cancer Res. 2008;68:6043–6048. doi: 10.1158/0008-5472.CAN-08-1079. doi:10.1158/0008-5472.CAN-08-1079. [DOI] [PMC free article] [PubMed] [Google Scholar]
- 8.Lathia JD, Gallagher J, Heddleston JM, et al. Integrin alpha 6 regulates glioblastoma stem cells. Cell Stem Cell. 2010;6:421–432. doi: 10.1016/j.stem.2010.02.018. doi:10.1016/j.stem.2010.02.018. [DOI] [PMC free article] [PubMed] [Google Scholar]
- 9.Teodorczyk M, Martin-Villalba A. Sensing invasion: cell surface receptors driving spreading of glioblastoma. J Cell Physiol. 2010;222:1–10. doi: 10.1002/jcp.21901. doi:10.1002/jcp.21901. [DOI] [PubMed] [Google Scholar]
- 10.Perego C, Vanoni C, Massari S, et al. Invasive behaviour of glioblastoma cell lines is associated with altered organisation of the cadherin-catenin adhesion system. J Cell Sci. 2002;115:3331–3340. doi: 10.1242/jcs.115.16.3331. [DOI] [PubMed] [Google Scholar]
- 11.Owens GC, Orr EA, DeMasters BK, Muschel RJ, Berens ME, Kruse CA. Overexpression of a transmembrane isoform of neural cell adhesion molecule alters the invasiveness of rat CNS-1 glioma. Cancer Res. 1998;58:2020–2028. [PubMed] [Google Scholar]
- 12.Fukushima Y, Ohnishi T, Arita N, Hayakawa T, Sekiguchi K. Integrin alpha3beta1-mediated interaction with laminin-5 stimulates adhesion, migration and invasion of malignant glioma cells. Int J Cancer. 1998;76:63–72. doi: 10.1002/(sici)1097-0215(19980330)76:1<63::aid-ijc11>3.0.co;2-h. doi:10.1002/(SICI)1097-0215(19980330)76:1<63::AID-IJC11>3.0.CO;2-H. [DOI] [PubMed] [Google Scholar]
- 13.Tanaka H, Matsui T, Agata A, et al. Molecular cloning and expression of a novel adhesion molecule, SC1. Neuron. 1991;7:535–545. doi: 10.1016/0896-6273(91)90366-8. doi:10.1016/0896-6273(91)90366-8. [DOI] [PubMed] [Google Scholar]
- 14.Johnston IG, Paladino T, Gurd JW, Brown IR. Molecular cloning of SC1: a putative brain extracellular matrix glycoprotein showing partial similarity to osteonectin/BM40/SPARC. Neuron. 1990;4:165–176. doi: 10.1016/0896-6273(90)90452-l. doi:10.1016/0896-6273(90)90452-L. [DOI] [PubMed] [Google Scholar]
- 15.Burns FR, von Kannen S, Guy L, Raper JA, Kamholz J, Chang S. DM-GRASP, a novel immunoglobulin superfamily axonal surface protein that supports neurite extension. Neuron. 1991;7:209–220. doi: 10.1016/0896-6273(91)90259-3. doi:10.1016/0896-6273(91)90259-3. [DOI] [PubMed] [Google Scholar]
- 16.Ohneda O, Ohneda K, Arai F, et al. ALCAM (CD166): its role in hematopoietic and endothelial development. Blood. 2001;98:2134–2142. doi: 10.1182/blood.v98.7.2134. doi:10.1182/blood.V98.7.2134. [DOI] [PubMed] [Google Scholar]
- 17.Cayrol R, Wosik K, Berard JL, et al. Activated leukocyte cell adhesion molecule promotes leukocyte trafficking into the central nervous system. Nat Immunol. 2008;9:137–145. doi: 10.1038/ni1551. doi:10.1038/ni1551. [DOI] [PubMed] [Google Scholar]
- 18.Nakamura Y, Arai F, Iwasaki H, et al. Isolation and characterization of endosteal niche cell populations that regulate hematopoietic stem cells. Blood. 2010;116:1422–1432. doi: 10.1182/blood-2009-08-239194. doi:10.1182/blood-2009-08-239194. [DOI] [PubMed] [Google Scholar]
- 19.Pittenger MF, Mackay AM, Beck SC, et al. Multilineage potential of adult human mesenchymal stem cells. Science. 1999;284:143–147. doi: 10.1126/science.284.5411.143. doi:10.1126/science.284.5411.143. [DOI] [PubMed] [Google Scholar]
- 20.Bruder SP, Ricalton NS, Boynton RE, et al. Mesenchymal stem cell surface antigen SB-10 corresponds to activated leukocyte cell adhesion molecule and is involved in osteogenic differentiation. J Bone Miner Res. 1998;13:655–663. doi: 10.1359/jbmr.1998.13.4.655. doi:10.1359/jbmr.1998.13.4.655. [DOI] [PubMed] [Google Scholar]
- 21.Uchida N, Yang Z, Combs J, et al. The characterization, molecular cloning, and expression of a novel hematopoietic cell antigen from CD34+ human bone marrow cells. Blood. 1997;89:2706–2716. [PubMed] [Google Scholar]
- 22.Dalerba P, Dylla SJ, Park IK, et al. Phenotypic characterization of human colorectal cancer stem cells. Proc Natl Acad Sci USA. 2007;104:10158–10163. doi: 10.1073/pnas.0703478104. doi:10.1073/pnas.0703478104. [DOI] [PMC free article] [PubMed] [Google Scholar]
- 23.Rajasekhar VK, Studer L, Gerald W, Socci ND, Scher HI. Tumour-initiating stem-like cells in human prostate cancer exhibit increased NF-kappaB signalling. Nat Commun. 2011;2:162. doi: 10.1038/ncomms1159. doi:10.1038/ncomms1159. [DOI] [PMC free article] [PubMed] [Google Scholar]
- 24.Ofori-Acquah SF, King JA. Activated leukocyte cell adhesion molecule: a new paradox in cancer. Transl Res. 2008;151:122–128. doi: 10.1016/j.trsl.2007.09.006. doi:10.1016/j.trsl.2007.09.006. [DOI] [PubMed] [Google Scholar]
- 25.Lunter PC, van Kilsdonk JW, van Beek H, et al. Activated leukocyte cell adhesion molecule (ALCAM/CD166/MEMD), a novel actor in invasive growth, controls matrix metalloproteinase activity. Cancer Res. 2005;65:8801–8808. doi: 10.1158/0008-5472.CAN-05-0378. doi:10.1158/0008-5472.CAN-05-0378. [DOI] [PubMed] [Google Scholar]
- 26.van Kempen LC, Meier F, Egeblad M, et al. Truncation of activated leukocyte cell adhesion molecule: a gateway to melanoma metastasis. J Invest Dermatol. 2004;122:1293–1301. doi: 10.1111/j.0022-202X.2004.22531.x. doi:10.1111/j.0022-202X.2004.22531.x. [DOI] [PubMed] [Google Scholar]
- 27.Ikeda K, Quertermous T. Molecular isolation and characterization of a soluble isoform of activated leukocyte cell adhesion molecule that modulates endothelial cell function. J Biol Chem. 2004;279:55315–55323. doi: 10.1074/jbc.M407776200. doi:10.1074/jbc.M407776200. [DOI] [PubMed] [Google Scholar]
- 28.van Kilsdonk JW, Wilting RH, Bergers M, et al. Attenuation of melanoma invasion by a secreted variant of activated leukocyte cell adhesion molecule. Cancer Res. 2008;68:3671–3679. doi: 10.1158/0008-5472.CAN-07-5767. doi:10.1158/0008-5472.CAN-07-5767. [DOI] [PubMed] [Google Scholar]
- 29.Albini A, Iwamoto Y, Kleinman HK, et al. A rapid in vitro assay for quantitating the invasive potential of tumor cells. Cancer Res. 1987;47:3239–3245. [PubMed] [Google Scholar]
- 30.Yan H, Parsons DW, Jin G, et al. IDH1 and IDH2 mutations in gliomas. N Engl J Med. 2009;360:765–773. doi: 10.1056/NEJMoa0808710. doi:10.1056/NEJMoa0808710. [DOI] [PMC free article] [PubMed] [Google Scholar]
- 31.Parsons DW, Jones S, Zhang X, et al. An integrated genomic analysis of human glioblastoma multiforme. Science. 2008;321:1807–1812. doi: 10.1126/science.1164382. doi:10.1126/science.1164382. [DOI] [PMC free article] [PubMed] [Google Scholar]
- 32.Ichimura K, Pearson DM, Kocialkowski S, et al. IDH1 mutations are present in the majority of common adult gliomas but rare in primary glioblastomas. Neuro Oncol. 2009;11:341–347. doi: 10.1215/15228517-2009-025. doi:10.1215/15228517-2009-025. [DOI] [PMC free article] [PubMed] [Google Scholar]
- 33.Nobusawa SWT, Kleihues P, Ohgaki H. IDH1 mutations as molecular signature and predictive factor of secondary glioblastomas. Clin Cancer Res. 2009;15:6002–6007. doi: 10.1158/1078-0432.CCR-09-0715. doi:10.1158/1078-0432.CCR-09-0715. [DOI] [PubMed] [Google Scholar]
- 34.Mellai MPA, Caldera V, Monzeglio O, Cassoni P, Valente G, Schiffer D. IDH1 and IDH2 mutations, immunohistochemistry and associations in a series of brain tumors. J Neurooncol. 2011;105(2):345–357. doi: 10.1007/s11060-011-0596-3. [DOI] [PubMed] [Google Scholar]
- 35.Preusser M, Wohrer A, Stary S, et al. Value and Limitations of Immunohistochemistry and Gene Sequencing for Detection of the IDH1-R132H Mutation in Diffuse Glioma Biopsy Specimens. J Neuropathol Exp Neurol. 2011;70:715–723. doi: 10.1097/NEN.0b013e31822713f0. doi:10.1097/NEN.0b013e31822713f0. [DOI] [PubMed] [Google Scholar]
- 36.Beier D, Hau P, Proescholdt M, et al. CD133(+) and CD133(-) glioblastoma-derived cancer stem cells show differential growth characteristics and molecular profiles. Cancer Res. 2007;67:4010–4015. doi: 10.1158/0008-5472.CAN-06-4180. doi:10.1158/0008-5472.CAN-06-4180. [DOI] [PubMed] [Google Scholar]
- 37.Wang J, Sakariassen PO, Tsinkalovsky O, et al. CD133 negative glioma cells form tumors in nude rats and give rise to CD133 positive cells. Int J Cancer. 2008;122:761–768. doi: 10.1002/ijc.23130. doi:10.1002/ijc.23130. [DOI] [PubMed] [Google Scholar]
- 38.Burkhardt M, Mayordomo E, Winzer KJ, et al. Cytoplasmic overexpression of ALCAM is prognostic of disease progression in breast cancer. J Clin Pathol. 2006;59:403–409. doi: 10.1136/jcp.2005.028209. doi:10.1136/jcp.2005.028209. [DOI] [PMC free article] [PubMed] [Google Scholar]
- 39.Weichert W, Knosel T, Bellach J, Dietel M, Kristiansen G. ALCAM/CD166 is overexpressed in colorectal carcinoma and correlates with shortened patient survival. J Clin Pathol. 2004;57:1160–1164. doi: 10.1136/jcp.2004.016238. doi:10.1136/jcp.2004.016238. [DOI] [PMC free article] [PubMed] [Google Scholar]
- 40.Kahlert C, Weber H, Mogler C, et al. Increased expression of ALCAM/CD166 in pancreatic cancer is an independent prognostic marker for poor survival and early tumour relapse. Br J Cancer. 2009;101:457–464. doi: 10.1038/sj.bjc.6605136. doi:10.1038/sj.bjc.6605136. [DOI] [PMC free article] [PubMed] [Google Scholar]
- 41.van Kempen LC, van den Oord JJ, van Muijen GN, Weidle UH, Bloemers HP, Swart GW. Activated leukocyte cell adhesion molecule/CD166, a marker of tumor progression in primary malignant melanoma of the skin. Am J Pathol. 2000;156:769–774. doi: 10.1016/S0002-9440(10)64943-7. doi:10.1016/S0002-9440(10)64943-7. [DOI] [PMC free article] [PubMed] [Google Scholar]
- 42.Kristiansen G, Pilarsky C, Wissmann C, et al. ALCAM/CD166 is up-regulated in low-grade prostate cancer and progressively lost in high-grade lesions. Prostate. 2003;54:34–43. doi: 10.1002/pros.10161. doi:10.1002/pros.10161. [DOI] [PubMed] [Google Scholar]
- 43.King JA, Ofori-Acquah SF, Stevens T, Al-Mehdi AB, Fodstad O, Jiang WG. Activated leukocyte cell adhesion molecule in breast cancer: prognostic indicator. Breast Cancer Res. 2004;6:R478–R487. doi: 10.1186/bcr815. doi:10.1186/bcr815. [DOI] [PMC free article] [PubMed] [Google Scholar]
- 44.Ihnen M, Muller V, Wirtz RM, et al. Predictive impact of activated leukocyte cell adhesion molecule (ALCAM/CD166) in breast cancer. Breast Cancer Res Treat. 2008;112:419–427. doi: 10.1007/s10549-007-9879-y. doi:10.1007/s10549-007-9879-y. [DOI] [PubMed] [Google Scholar]
- 45.Mezzanzanica D, Fabbi M, Bagnoli M, et al. Subcellular localization of activated leukocyte cell adhesion molecule is a molecular predictor of survival in ovarian carcinoma patients. Clin Cancer Res. 2008;14:1726–1733. doi: 10.1158/1078-0432.CCR-07-0428. doi:10.1158/1078-0432.CCR-07-0428. [DOI] [PubMed] [Google Scholar]