Abstract
Purpose
Detecting and recognizing steps and ramps is an important component of the visual accessibility of public spaces for people with impaired vision. The present study, which is part of a larger program of research on visual accessibility, investigated the impact of two factors that may facilitate the recognition of steps and ramps during low-acuity viewing. Visual texture on the ground plane is an environmental factor that improves judgments of surface distance and slant. Locomotion (walking) is common during observations of a layout, and may generate visual motion cues that enhance the recognition of steps and ramps.
Methods
In two experiments, normally sighted subjects viewed the targets monocularly through blur goggles that reduced acuity to either approx. 20/150 Snellen (mild blur) or 20/880 (severe blur). The subjects judged whether a step, ramp or neither was present ahead on a sidewalk. In the texture experiment, subjects viewed steps and ramps on a surface with a coarse black-and-white checkerboard pattern. In the locomotion experiment, subjects walked along the sidewalk toward the target before making judgments.
Results
Surprisingly, performance was lower with the textured surface than with a uniform surface, perhaps because the texture masked visual cues necessary for target recognition. Subjects performed better in walking trials than in stationary trials, possibly because they were able to take advantage of visual cues that were only present during motion.
Conclusions
We conclude that under conditions of simulated low acuity, large, high-contrast texture elements can hinder the recognition of steps and ramps while locomotion enhances recognition.
Keywords: visual accessibility, texture, locomotion, low vision, low acuity, mobility, visual recognition, steps, ramps
Obstacles on the ground or discontinuities in the ground plane, such as steps, pose hazards for people with low vision. Visual impairment is a risk factor for both falls and fractures in the elderly.1,2 Recognizing ground-plane irregularities, such as steps and ramps, is an important component of the visual accessibility of public spaces for people with impaired vision. Visual accessibility is the use of vision to travel efficiently and safely through an environment, to perceive the spatial layout of the environment, and to update one’s location in the environment. A long-term goal of our research on visual accessibility is to provide a principled basis for guiding the design of safe environments for the mobility of people with low vision.
In our previous study3 we investigated the impact on the detection of steps and ramps of environmental factors, such as target-background contrast and lighting arrangements, and also viewing conditions such as distance to target.3 Adults with normal vision, wearing acuity-reducing goggles, were tested in a windowless classroom using methods like those described in this paper. Among the results of the previous study, a step up was more visible with the acuity-reducing goggles than a step down. The effects of target-background contrast were greater than the effects of lighting arrangement. The empirical results were interpreted in the context of a probabilistic model of target-cue detection. Ongoing research in our lab is extending the findings to subjects with low vision.
In the present study, we address the influence of two additional visual factors expected to enhance the recognition of ramps and steps under low-resolution viewing--surface texture and self-locomotion. Here, low-resolution viewing refers to viewing through acuity-reducing goggles (see Methods for details).
Texture is thought to provide information about the distance and orientation of surfaces.4 Although computer graphics specialists have contributed much to our understanding of the image properties of real materials, with the goal of simulating such materials in virtual displays, there is a dearth of research on visual texture perception in real environments.5 However, some evidence demonstrates the impact of surface texture on real-world perception of target distance and surface slant.6-8 These studies leave open the question of whether surface texture would help or hinder the recognition of steps, ramps, or other ground-plane irregularities.
In the real world, ground-plane surface textures often result from distributions of small elements, often with low contrast features, (e.g., grass, carpet weave, or a gravel path). With normal vision, such texture elements might be an effective source of information, but with low vision, they would often be invisible and unlikely to convey useful information. We hypothesized that surfaces with large, high-contrast texture elements would enhance the identification of steps and ramps with low-resolution viewing. If so, appropriately designed visual texture patterns on walking surfaces might facilitate safe mobility for people with reduced acuity or contrast sensitivity. In Experiment 1, subjects viewed steps and ramps on a surface with a coarse black-and-white checkerboard pattern. Since the angular size of texture elements depends on viewing distance, we expected any benefits from texture to depend on acuity and viewing distance.
Motion perception tends to be resistant to blur and contrast reduction9-11 prompting our interest in motion cues for visual accessibility. While steps and ramps are usually static in the real world (escalators being an interesting exception12) self locomotion (walking) provides a common source of retinal-image motion. It is ecologically relevant to study detection and recognition of obstacles during walking because people are often mobile when making such judgments. It is possible that self motion might enhance the visibility of low-contrast contours or yield information from motion parallax or other change-of-view cues to improve detection and recognition of ramps and steps.
In brief, we hypothesized that both surface texture and self-locomotion would enhance the recognition of ramps and steps with low-resolution vision.
EXPERIMENT 1 METHODS
Stimuli and Procedure
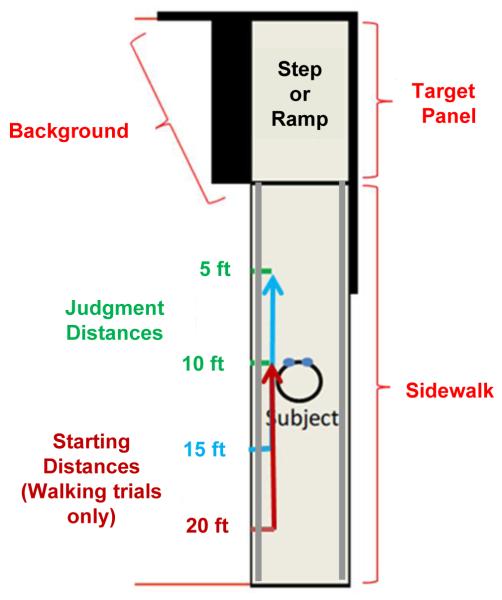
A large, windowless, 33.25 by 18.58 ft (10.13 by 5.66 m) classroom in the basement of the psychology building on the campus of the University of Minnesota was used as the test space for all experiments. A schematic drawing is shown in Figure 1.
Figure 1.
Schematic diagram of the test space, showing the target panel (upper left), the sidewalk, the black background, the two stationary viewing locations in green (5 ft and 10 ft), and the two starting locations for the walking trials in blue (15 ft and 20 ft). The gray, metal railings were present for the walking trials only. With the omission of the hand rails, the identical test space was used in Legge et al., 2010.3 A color version of this figure is available online at www.optvissci.com.
A uniform gray sidewalk (4 ft wide by 24.5 ft long; 1.3 m by 7.5 m) was constructed using hardboard deck portable stage risers (Figure 1). This sidewalk was elevated 16 in (0.4 m) above the floor. Five possible targets were shown at a fixed location on the sidewalk’s south end: a single step up or down (7 in height), a ramp up or down (7 in change of height over 8 ft), or flat (see Figure 2). A 4 by 8 ft (1.2 m by 4.3 m) by 2 in thick rectangular panel of expanded polystyrene (EPS), painted uniform gray, formed the target. Sidewalk and target were also painted gray. Using motorized scissor jacks, the target panel was adjusted by raising or lowering one or both ends of the panel above or below the sidewalk.
Figure 2.
The five targets (shown with plain gray surfaces) were Step Up, Step Down, Ramp Up, Ramp Down and Flat. The five targets are shown again with textured surfaces in the top row of Figure 4.
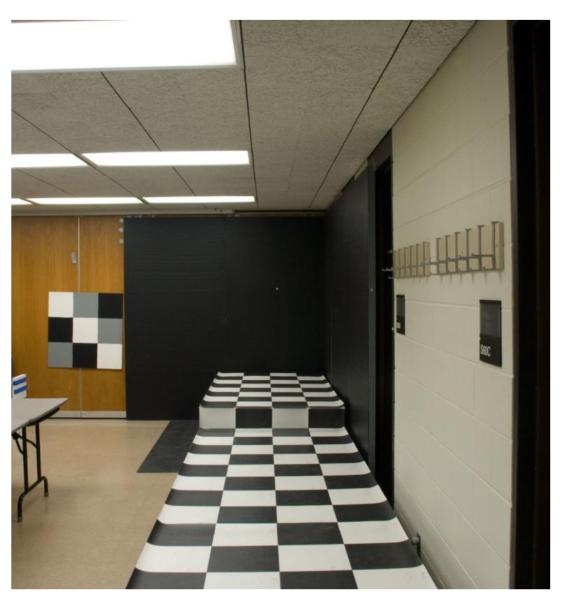
The visual background for the targets was formed by the classroom floor, far wall, and right-hand wall (see Figure 3). The walls were paneled with rectangular sections of EPS, and the section of floor on the left of the target was covered with a wooden panel (painted to match the background).
Figure 3.
Photo of the test space, with the sidewalk and Step Up target covered by textured surfaces. The overhead lighting is also shown. A color version of this figure is available online at www.optvissci.com.
Overhead lighting was produced by four rows of three end-to-end 2 by 4 ft luminaries (recessed acrylic prismatic 4 lamp SP41 fluorescent). This lighting produced a luminance of approximately 77 cd/m2 on white squares and 5 cd/m2 on black squares in the texture pattern used in Experiment 1. The overhead illumination is representative of typical ambient room lighting. For more information about the test space and apparatus, please see Legge et al. (2010).3
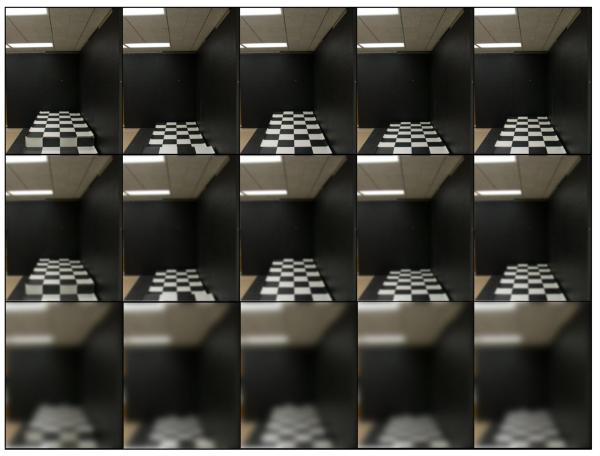
Effective acuity through the subject’s dominant eye (determined with an aiming task) was reduced using either one or two Bangerter Occlusion Foils13, mounted in a goggle frame. The foils were attached to one (mild blur) or both (severe blur) sides of a clear acrylic lens mounted in a welding goggle frame. See Figure 4 for examples of the effect of blur on target visibility. To reduce glare from illumination by the overhead fluorescent lights through the goggles, a cylindrical, black, acrylic viewing tube was attached to the goggles in front of the dominant eye. The tube reduced the field of view from about 48° to 33° (see Legge et al., 2010 for details).3 Effective acuity through the blur foils was determined by measuring each subject’s acuity while wearing the blur goggles using the Lighthouse Distance Acuity chart. The mean acuity with mild blur was 20/152 (logMAR = 0.88) and with severe blur, 20/884 (logMAR = 1.65). Contrast sensitivity was also estimated psychophysically (Pelli-Robson chart, see Legge et al., 20103) as 0.8 (mild blur) and 0.6 (severe blur). Luminance was attenuated by approximately a factor of two through the blur foils.
Figure 4.
The targets are shown with full resolution (top), mild blur (middle), and severe blur (bottom). Here, the sidewalk has texture. The five targets, from left to right are: Step Up, Step Down, Ramp Up, Ramp Down, and Flat. The blurred images shown here are based on digital filtering and are not identical to images seen through the goggles. A color version of this figure is available online at www.optvissci.com.
Texture
We compared ramps-and-steps recognition performance for a textured surface with similar recognition data for a uniform gray surface reported by Legge et al. (2010).3 The texture was a checkerboard pattern composed of large, high-contrast squares. The goal was to determine if visible texture would enhance the recognition of ramps and steps.
Participants
24 normally sighted young adults, ages 18-24 (M = 21.3 years), with mean acuity of 20/16 (logMAR = −0.097) and mean contrast sensitivity of 1.73 participated. Each subject completed the experiment in one session lasting from two to three hours. The experimenter obtained informed consent in accordance with procedures approved by the University of Minnesota’s IRB.
Targets and Texture Pattern
The sidewalk and target were covered by linoleum flooring with a continuous texture of alternating black and white, high contrast (0.87 Michelson Contrast) squares (1 ft per side). An additional 4-ft-long by 7-in-wide narrow rectangle of black and white flooring was used to cover the riser for the Step Up target.
Procedure
Before each testing condition, subjects were shown the targets with normal viewing (no blur). This was done to equate their prior knowledge of the targets.
During each trial, the seated subject reported which of the five targets was shown (5-alternative forced choice) with a viewing time of 4 seconds. Subjects viewed the targets through the blurring goggles from three distances of 5 ft, 10 ft, and 20 ft (1.52, 3.05, and 6.10 m, respectively). To mask auditory cues associated with changing the target configuration, subjects wore noise-reducing earmuffs and listened to auditory white noise. Subjects were instructed to turn their head to face the right-hand wall between trials, preventing them from viewing the target adjustment.
Each subject completed 60 trials, two for each of the five targets, for two blur levels (mild and severe) and three viewing distances (5, 10, or 20 ft). See Figure 4 for the appearances of the targets with approximations of the mild and severe blur. Viewing distances are shown in Figure 1. Half of the subjects (N = 12) viewed the targets against a gray background and the other half viewed them against a black background (painted with Valspar interior satin dark kettle black acrylic latex). Since the contrast of the gray targets against the black background was higher (Michelson contrast = 0.82) than that against the gray background (0.25), it was hypothesized that subjects would perform with higher accuracy in the former condition. Within each background group (Black or Gray), trials were blocked by blur level and viewing distance.
EXPERIMENT 1 RESULTS
In the presentation of results for Experiment 1, data for the uniform surface conditions come from the study of Legge et al. 3, in which performance with the same black and gray backgrounds was compared. The size of the subject groups and testing conditions in the Legge et al. (2010) study were identical to the current study, apart from the difference in surface pattern (texture vs. uniform). Accuracy for target identification (% correct) is reported. Chance accuracy was 20% because there were five targets.
To achieve normality of the group data, accuracy data were arcsine-transformed prior to statistical testing. We conducted a repeated-measures analysis of variance (ANOVA) on the transformed accuracy data, with three between-subjects factors—sidewalk type (Texture or Uniform), blur (Mild or Severe), and background color (Black or Gray)—and one within-subjects factor—viewing distance (5, 10 and 20 ft). T-tests, using a Bonferroni correction for multiple comparisons, were used in post-hoc testing.
We hypothesized that texture would facilitate recognition of ramps and steps. However, contrary to expectation, the Uniform sidewalk groups performed slightly better overall (71% correct) than the texture sidewalk groups (67% correct), p = .029. The difference was greater with severe blur: the Uniform groups had 58% correct performed and the Texture groups had 47% correct, p = .001. With Mild blur, there was no significant difference between Textured and Uniform groups. The three-way interaction between sidewalk type, background color, and blur showed that Textured sidewalk was only significantly worse than Uniform sidewalk with Severe blur and the black background (F (1, 88) = 11.34, p = .001).
Figure 5 shows that performance was much better with mild blur (85% correct) than with severe blur (52% correct; F (1, 88) = 242.83, p < .0001). The high-contrast black background (88% correct) yielded better performance than the low-contrast gray background (78%) for the Uniform groups, p = .01 (see Legge et al.3). Unexpectedly, there was no difference in performance between the black and gray backgrounds for the Texture groups.
Figure 5.
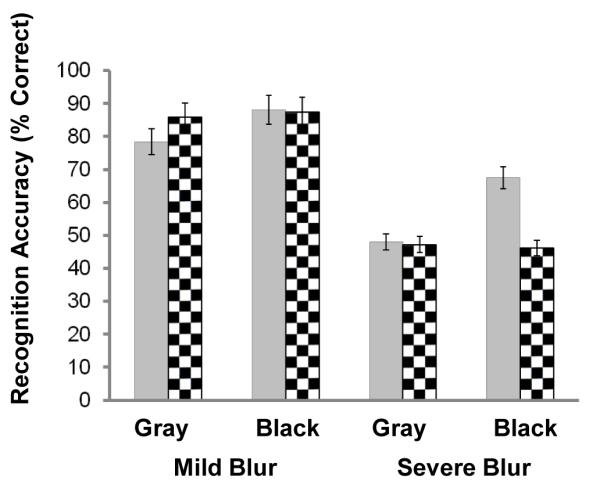
Recognition performance (% correct) with black versus gray background under blur. Error bars represent ± standard error.
Performance varied with viewing distance (5, 10, or 20 ft) from the target (F (2, 88) = 19.72, p < .001). With Texture and Mild blur, performance was better at 10 & 20 ft than at 5 ft, but with Gray & Mild blur, performance was best at 10 ft, p’s < .03. For Severe blur, performance was best at the shortest distance of 5 ft for both groups and declined at longer distances, presumably due to acuity limitations, p < .001.
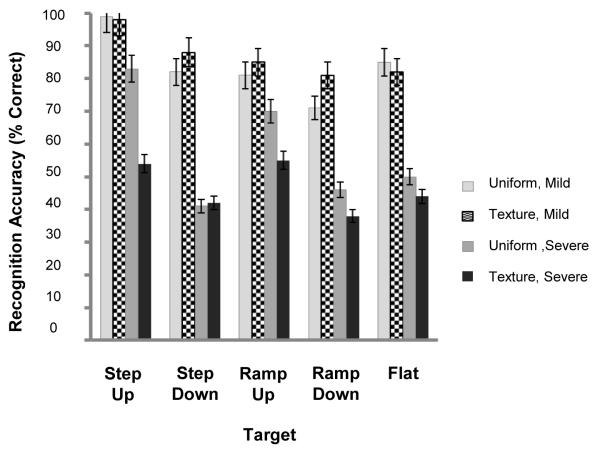
Figure 6 shows that performance depended on the target (Step Up, Step Down, Ramp Up, Ramp Down, or Flat). Both Texture and Uniform groups performed better on Step Up than on Step Down, Ramp Down, or Flat, p’s < .01. Similarly, both Texture and Gray groups performed better on Ramp Up than on Step Down, p’s < .05. Overall, target accuracies for the texture study (Experiment 1) roughly correspond to those found with overhead lighting in Legge et al., 2010 when the corresponding conditions are compared (e.g., Black background & Mild blur at 10 ft).3
Figure 6.
Recognition performance for the five targets. Error bars represent ± standard error.
EXPERIMENT 2. LOCOMOTION
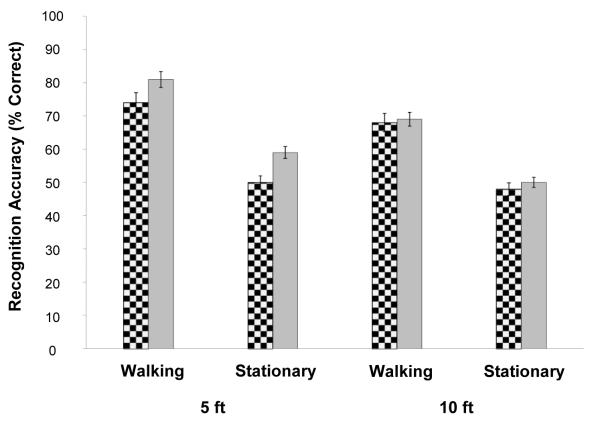
In this experiment, we compared recognition performance for a stationary condition and a walking condition. In the walking condition, subjects approached the targets along the sidewalk, stopping at the designated viewing distances (5 ft or 10 ft) to make their recognition decisions. The goal of this experiment was to determine if locomotion facilitated the recognition of ramps and steps.
Methods
Participants
18 normally sighted young adults ages 18-36 (M = 23.4 years), with mean acuity of 20/18 (logMAR = −0.046) and mean contrast sensitivity of 1.72 participated. Each subject completed the experiment in one session lasting from two to three hours. The experimenter obtained informed consent in accordance with procedures approved by the University of Minnesota’s IRB.
Procedure: Walking versus Stationary
This experiment was like the Texture Experiment, with the following exceptions. Subjects made target recognition judgments from distances of 5 ft or 10 ft (but not 20 ft) either after stationary viewing or after walking 10 ft along the sidewalk from a greater distance to the same viewing locations. Weight-bearing railings were added to both sides of the sidewalk to enhance safety and subjects were asked to keep one hand on the left railing at all times during the experiment. Tactile markers were used to indicate the 5 ft, 10 ft, 15 ft and 20 ft distances.
In the stationary trials, subjects stood at the designated viewing distance and made their recognition decisions. In the moving trials, subjects walked 10 ft toward the target, stopped at the designated viewing distance, and made a recognition decision.
Testing was conducted with the same two surface patterns on the sidewalk (uniform and textured) used in Experiment 1. In both cases, the background was black. (See Figure 4 for examples.) Since our previous results3 showed that the largest differences in performance among conditions were present with Severe blur, subjects were tested with only Severe blur.
Each subject completed 80 trials, two for each of the five targets, for two viewing distances (5 or 10 ft), two surface types (Uniform vs. Textured), and two movement conditions (Walking vs. Stationary). Within each surface type, trials were blocked by viewing distance and movement.
To determine whether walking trials were longer than stationary trials, we recorded three types of time measurements each for 10 trials (N = 4). Stationary trial time was the time taken in stationary trials from the experimenter’s verbal signal for subjects to look at the targets until the subject made a recognition response. Average time for a stationary trial, 3.6 seconds, was close to the 4-second time limit in our earlier study.3 For the moving trials, total moving trial time was the time between the onset of walking and the subject’s verbal recognition response. Walking time was the time from the onset of walking until the subject stopped, not including any additional time before a verbal recognition response. Average total moving trial time was 8.2 seconds, and average walking time was 5.8 seconds.
For the walking trials, subjects were asked to wait until they arrived at the designated viewing location to give their response. They usually responded very soon after reaching this point (mean of 2.4 seconds) so most of the trial time was taken up with walking, rather than standing after the walk. Also, since subjects responded whenever they were ready during stationary trials, it is unlikely that requiring them to wait the average duration of a moving trial (~8 seconds) before giving their response would affect performance.
RESULTS
To achieve normality of the group data, accuracy data were arcsine-transformed prior to statistical testing. We conducted a repeated-measures analysis of variance (ANOVA) on the transformed accuracy data, with three within-subjects factors—locomotion (Walking or Stationary), sidewalk type (Texture or Uniform), and viewing distance (5 ft or 10 ft). The analysis revealed significant main effects of locomotion, F (1, 18) = 51.90, p < .0001; Sidewalk type, F (1, 18) = 7.20, p < .01; and viewing distance, F (1, 18) = 9.96, p < .006.
Subjects performed much better in the moving condition (74%) than in the stationary condition (52%). See Figure 7 for a comparison of Moving and Stationary performance with the Textured sidewalk and the Uniform sidewalk. As in Experiment 1, subjects performed better with the Uniform sidewalk (67.50% correct) than with the textured sidewalk (58%), p < .01. Subjects performed better at the 5 ft distance (66%) than at the 10 ft distance (59%), p < .01.
Figure 7.
Comparison of walking and stationary recognition performance at 5 and 10 ft. Error bars represent ± standard error.
DISCUSSION
The aim of these experiments was to determine whether surface texture and locomotion toward the target would enhance recognition of steps and ramps. Contrary to expectation, surface texture detracted from performance. As hypothesized, locomotion towards a step or ramp improved recognition compared with stationary observations. The Locomotion experiment also replicated the findings of the texture experiment, showing that for severe blur, recognition of steps and ramps was poorer with the texture pattern.
Why did the surface texture interfere with recognition performance? Texture contours may mask some of the critical features for target recognition. In our previous study3, we identified a set of cues useful for distinguishing among the five targets.3 Figure 8 illustrates these cues.
Figure 8.
Cues for distinguishing steps and ramps. In panel A, the cues for the step up target are shown. The transition contrast cue marks the transition between the riser and the top of the target panel. The contour kink cue marks the “kink” in the boundary contour of the sidewalk that is created by the step up. In panel B, the L-junction cue marks the L-shaped boundary contour that is created by the step down. In panel C, the contour bend out cue marks the subtle bend in the boundary profile of the sidewalk created by a ramp up. A corresponding bend in cue marks the bend for ramp down. Height in the picture plane, the horizontal bounding contour between the far edge of the target panel and the back wall, is an additional cue that can be used for all five targets. Picture height is high for step up and ramp up, low for step down and ramp down, and intermediate for the flat target. From Legge et al., 2010.3
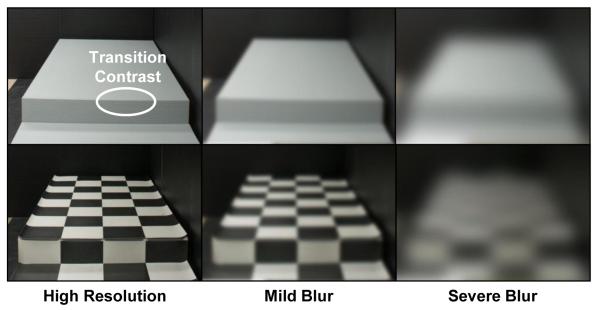
Our previous study3 indicated that the transition contrast cue, diagnostic of Step Up, was primarily responsible for good recognition of this target. But this transition contrast cue appears to be less salient in the presence of the high-contrast texture edges (see Figure 9). The transition contrast cue is much more obvious with the uniform sidewalk than with the checked sidewalk, particularly for severe blur.
Figure 9.
The Step Up target is shown in gray (top) and with the checked surface texture (bottom) in a normal, high-resolution image (left) and with digital approximations of the blur (mild, middle; severe, right).
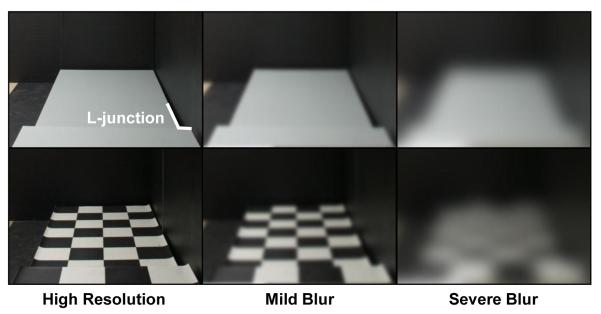
The contour clutter produced by the horizontal & vertical contrast features of the texture pattern may reduce the salience or mask the subtle contours for the L-junction cue, which is diagnostic of Step Down (see Figure 10). The even more subtle bend-in and bend-out cues, for Ramp Down and Ramp Up, respectively, are also obscured with the textured sidewalk under conditions of severe blur. However, our results with a checkerboard pattern with strong orthogonal straight contours may represent a worst case scenario. Other coarse patterns, such as a diamond texture (contours rotated 45 degrees with respect to the step riser) or wide, black-and-white stripes might possibly produce better performance than the checkerboard texture. For example, stripes parallel to the bounding contour of the sidewalk would replicate the cues along this contour at the step or ramp transition possibly increasing target visibility.
Figure 10.
The Step Down target is shown with uniform surface (top) and textured surface (bottom), in high resolution (left) and with digital approximations of mild blur (middle); and severe blur (right). The masking of the L-junction by the texture contours is more pronounced for the severe blur.
Why does locomotion enhance recognition of steps and ramps? Retinal-image motion could help in several ways. Motion parallax is known to improve depth discrimination in low vision and for normal vision under conditions of blur or low contrast.11 In the present case, motion parallax might have facilitated detection of depth differences between the boundary contours for the sidewalk and target panel. But even in the stationary viewing condition, subjects were allowed to move their heads, so the parallax cue was potentially available in this condition as well.
A second possible cue is accretion and deletion of surface features as the viewpoint changes between a nearer surface and a more distant partially overlapping surface.14 In our case, as the subject moved along the sidewalk toward the target, a little more of the lower surface came into view in the Step Down condition. This might explain the greater benefit of locomotion we observed for recognition of the step down. More generally, locomotion produces observations from a range of slightly different viewpoints. Perhaps the integration of the multiple views provides information not available from a single viewpoint.
A third possibility is that locomotion produces greater retinal image motion of informative image contours, enhancing their visibility. This might be especially significant for our severe blur condition because it is well known that contrast sensitivity for patterns composed of low spatial frequencies is enhanced by abrupt temporal onsets or offsets.15
The foregoing possibilities refer to enhancement of the visibility of cues by retinal-image motion. There is also evidence that the value of retinal-image motion in conveying 3D information about objects and surfaces is enhanced for active compared with passive observers, even when the visual input is identical.16 These authors propose that extra-visual movement-based information is incorporated into judgments of 3D structure.
While we expect the qualitative features of our results to generalize to people with reduced acuity associated with low vision, several caveats are in order.
First, the Bangerter blur foils reduce acuity and contrast sensitivity for normally sighted subjects, but are not necessarily representative of any particular form of low vision. For example, the contrast sensitivities through the blur foils associated with the two levels of acuity reduction (see Methods) are not well matched to the measured correlations of acuity and contrast sensitivity in low vision subjects.17 Our subjects differed from a typical group of low-vision subjects in other ways. Our subjects were young whereas most subjects with low vision are older. Our subjects had to deal with reduced acuity and contrast sensitivity whereas many people with low vision also experience visual-field loss. Our subjects undoubtedly had much less experience functioning with low-resolution vision than a typical group of people with low vision.
Second, we studied monocular viewing to simplify the optical arrangements for our subjects, and to simplify potential extension of the findings to low vision. Many people with mild or severe low vision have unequal vision status (acuities and other visual characteristics) of the two eyes, with performance determined primarily by the better eye (see, e.g., Kabanarou & Rubin18). In principle, stereopsis could be a useful binocular cue in recognizing ground plane irregularities. However, stereoacuity declines at low spatial frequencies and for unequal contrasts in the two eyes (Legge & Gu, 198919), which may imply weak or absent stereopsis in many cases of low vision.
Third, our subjects knew that one of the five targets was present in each trial, and where to look for it, but low-vision pedestrians navigating unfamiliar locations in the real world do not always know when and where obstacles will appear in their path. Such uncertainties pose challenges for mobility not present in our study.
We conclude that, contrary to our first hypothesis, a coarse texture pattern on the ground plane can hinder the visibility of ramps and steps under low-resolution viewing conditions. It is likely that contour associated with the texture pattern itself interferes with the visibility of pertinent cues for the ramps and steps. Consistent with our second hypothesis, we conclude that locomotion toward ramps and steps does enhance their visibility. If our results generalize to people with low vision, our findings may prove helpful in designing spaces to enhance visual accessibility. The findings may also be helpful for rehabilitation specialists who can inform their low-vision clients about the potential interfering effects of surface patterns or the advantages of locomotion in the visual exploration of their surroundings.
ACKNOWLEDGMENTS
We thank Muzi Chen for help testing our subjects. This work was supported by National Eye Institute, National Institutes of Health Grant EY017835 to Gordon Legge.
Footnotes
This is a PDF file of an unedited manuscript that has been accepted for publication. As a service to our customers we are providing this early version of the manuscript. The manuscript will undergo copyediting, typesetting, and review of the resulting proof before it is published in its final citable form. Please note that during the production process errors may be discovered which could affect the content, and all legal disclaimers that apply to the journal pertain.
REFERENCES
- 1.de Boer MR, Pluijm SMF, Lips P, Moll AC, Völker-Dieben HJ, …van Rens GHMB. aspects of visual impairment as risk factors for falls and fractures in older men and women. Journal of Bone and Mineral Research. 2004;19(9):1539–1547. doi: 10.1359/JBMR.040504. [DOI] [PubMed] [Google Scholar]
- 2.Lord SR, Dayhew J. Visual risk factors for falls in older people. Journal of the American Geriatrics Society. 2001;49(5):508–515. doi: 10.1046/j.1532-5415.2001.49107.x. [DOI] [PubMed] [Google Scholar]
- 3.Legge GE, Yu D, Kallie CS, Bochsler TM, Gage R. Visual accessibility of ramps and steps. Journal of Vision. 2010;10(11):8, 1–19. doi: 10.1167/10.11.8. [DOI] [PMC free article] [PubMed] [Google Scholar]
- 4.Gibson JJ. The stimulus variables for visual depth and distance – momentary stimulation. In: Carmichael L, editor. Perception of the visual world. Houghton Mifflin; Cambridge: 1950. pp. 77–116. [Google Scholar]
- 5.Landy MS, Graham N. Visual perception of texture. In: Chalupa LM, Werner JS, editors. The Visual Neurosciences. MIT Press; Cambridge, MA: 2004. pp. 1106–1118. [Google Scholar]
- 6.Sinai MJ, Ooi TL, Teng L, He ZJ. Terrain influences the accurate judgment of distance. Nature. 1998;395(6701):497–500. doi: 10.1038/26747. [DOI] [PubMed] [Google Scholar]
- 7.Feria CS, Braunstein ML, Andersen GJ. Judging distance across texture discontinuities. Perception. 2003;32:1423–1440. doi: 10.1068/p5019. [DOI] [PubMed] [Google Scholar]
- 8.Wu B, Ooi TL, He ZJ. Perceiving distance accurately by a directional process of integrating ground information. Nature. 2004;428:73–77. doi: 10.1038/nature02350. [DOI] [PubMed] [Google Scholar]
- 9.McKee SP, Silverman GH, Nakayama K. Precise velocity discrimination despite random variations in temporal frequency and contrast. Vision Res. 1986;26(4):609–619. doi: 10.1016/0042-6989(86)90009-x. [DOI] [PubMed] [Google Scholar]
- 10.Straub A, Paulus W, Brandt T. Influence of visual blur on object-motion detection, self-motion detection, and postural balance. Behavioral Brain Research. 1990;40(1):1–6. doi: 10.1016/0166-4328(90)90037-f. [DOI] [PubMed] [Google Scholar]
- 11.Jobling JT, Mansfield JS, Legge GE, Menge MR. Motion parallax: effects of blur, contrast, and field size in normal and low vision. Perception. 1997;26(12):1529–1538. doi: 10.1068/p261529. [DOI] [PubMed] [Google Scholar]
- 12.Cohn TE, Lasley DJ. Visual depth illusion and falls in the elderly. Clinics in Geriatric Medicine. 1985;1(3):601–20. [PubMed] [Google Scholar]
- 13.Odell NV, Leske DA, Hatt SR, Adams WE, Holmes JM. The effect of Bangerter filters on optotype acuity, Vernier acuity, and contrast sensitivity. J Aapos. 2008;12(6):555–559. doi: 10.1016/j.jaapos.2008.04.012. [DOI] [PMC free article] [PubMed] [Google Scholar]
- 14.Yonas A, Craton LG, Thompson WB. Relative motion: kinetic information for the order of depth at an edge. Attention, Perception, and Psychophysics. 1987;41(1):53–59. doi: 10.3758/bf03208213. [DOI] [PubMed] [Google Scholar]
- 15.Legge GE. Sustained and transient mechanisms in human vision: spatial and temporal properties. Vision Research. 1978;18:69–81. doi: 10.1016/0042-6989(78)90079-2. [DOI] [PubMed] [Google Scholar]
- 16.Wexler M, Panerai F, Lamouret I, Droulez J. Self-motion and the perception of stationary objects. Nature. 2001;409(6816):85–88. doi: 10.1038/35051081. [DOI] [PubMed] [Google Scholar]
- 17.Kiser AK, Mladenovich D, Eshraghi F, Bourdeau D, Dagnelie G. Reliability and consistency of visual acuity and contrast sensitivity measures in advanced eye disease. Optom Vis Sci. 2005;82(11):946–954. doi: 10.1097/01.opx.0000187863.12609.7b. [DOI] [PubMed] [Google Scholar]
- 18.Kabanarou SAMDP, Rubin GSP. Reading With Central Scotomas: Is There a Binocular Gain? [Article] Optometry & Vision Science November. 2006;83(11):789–796. doi: 10.1097/01.opx.0000238642.65218.64. 2006. [DOI] [PubMed] [Google Scholar]
- 19.Legge GE, Gu Y. Stereopsis and contrast. Vision Research. 1989;29:989–1004. doi: 10.1016/0042-6989(89)90114-4. [DOI] [PubMed] [Google Scholar]


