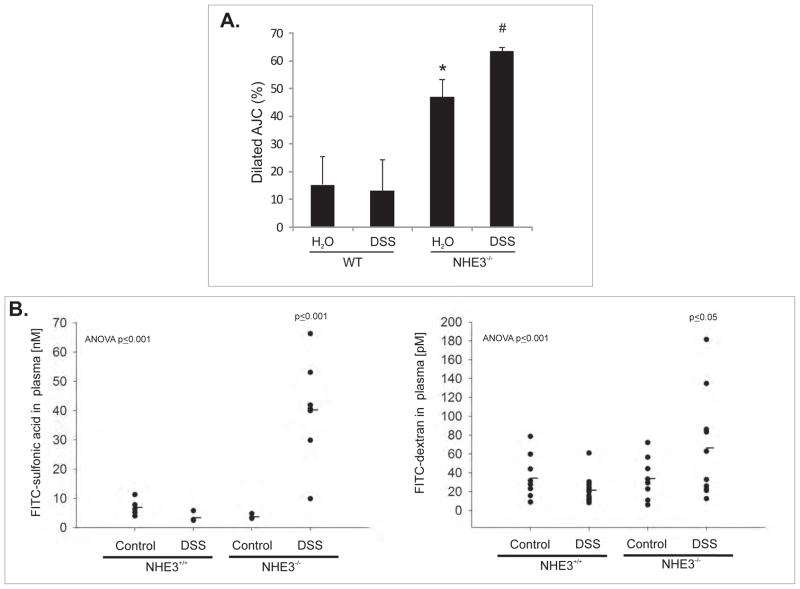
Figure 6.
(A) Quantitative summary of the TEM analysis of the apical junction complex(AJC) in the small intestinal epithelium of untreated and DSS-treated WT and NHE3−/− mice.
Mice were treated with 4% DSS for 48 hrs. 30–40 AJC’s per specimen were analyzed and designated as dilated or not. Average percent contribution of dilated AJC’s was calculated and statistically analyzed by ANOVA followed by post hoc Fisher’s PLSD test, with P ≤ 0.05 considered significant and depicted as different symbols next to bars (n=4). (B) Intestinal mucosal tracer flux in untreated and DSS-treated WT and NHE3−/− mice. Mice were treated with DSS as above and then gavaged with FITC-SA or FITC-dextran as described in the Supplementary Methods section. Marker-associated fluorescence was measured in blood plasma and concentrations calculated from respective standard curve. The results were statistically analyzed by ANOVA followed by post hoc Fisher’s protected least significant difference test, with P ≤ 0.05 considered significant and depicted by the p values. Only DSS-treated NHE3−/− mice were different from other groups (n=5–10).

