Abstract
We demonstrate that intermolecular stacking is capable of forming one-dimensional arrays of a blunt-ended 3-helix DNA motif. The array can be visualized in the atomic force microscopy through conjugated streptavidin nanoparticles. We estimate the strength of the triple stacking interaction to be −8.6 kcal/mol.
The information content of DNA makes it an excellent candidate for producing smart materials on the nanoscale.1 Watson-Crick base pairing has enabled the self-assembly of many DNA nanostructures and devices through the specificity of designed intermolecular interactions, particularly sticky-ends. Examples include DNA objects,2 one-dimensional (1D),3 two-dimensional (2D)4,5 and three-dimensional (3D)6 arrays, and nanomechanical devices.7,8 Thus, sticky-ended cohesion has enabled the construction of numorous target nanostructures.
Recently, we reported six-helix (6HB) and eight-helix (8HB) DNA nanotubes3 that could be self-assembled from two half-tubes, employing specifically designed lateral cohesive interactions. Sticky ends on the tips of the helices led to the self-assembly of DNA tubes that extended several microns. During that study, we noted that 1D DNA arrays also formed from blunt-ended 6HB, 8HB and half-tube bent TX (BTX) motifs. Here, we show that 1D arrays can assemble in an arbitrary order if blunt BTX motifs are used. This finding demonstrates the importance of using sticky-ended interactions in designs, because we show that flush DNA stacking interactions in multi-domain species lead to non-specific structures.
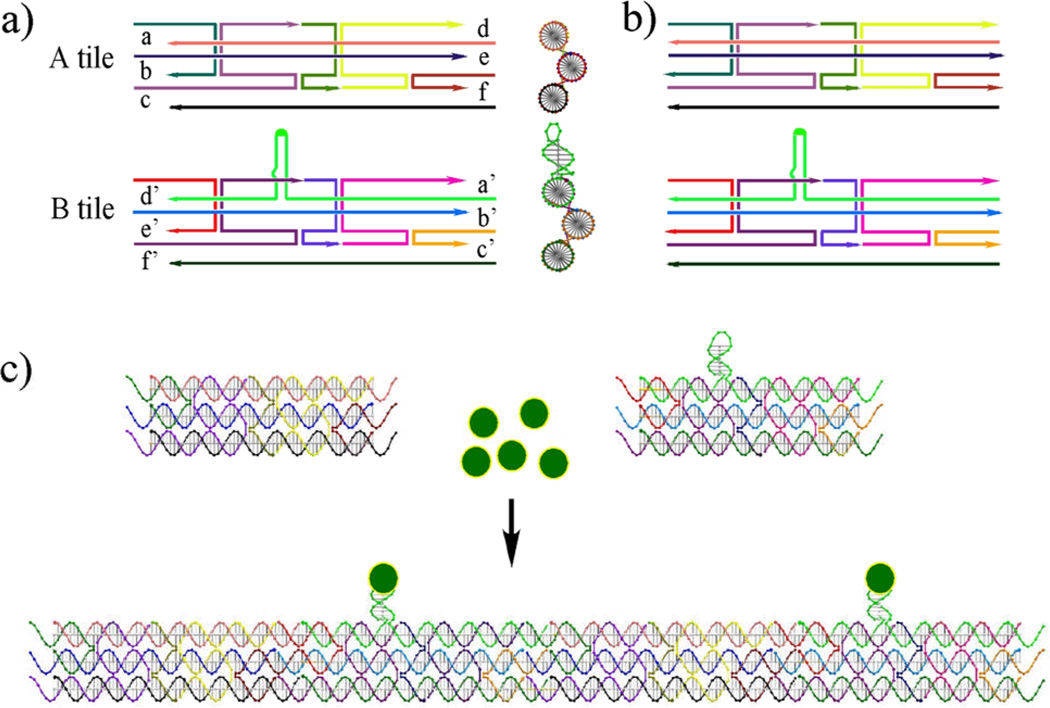
The BTX structure contains three double helical domains, with a 120° angle between the planes of successive pairs of helix axes.3 We designed two different BTX molecules, one with a marker domain that can bind streptavidin (the B tile), and one lacking this domain (the A tile). Fig. 1 contains schematic drawings of the strand structures of the two BTX molecules, either containing sticky ends (1a) or lacking sticky ends (1b). All tiles are six double helical turns in length (63 nucleotide pairs). Each tile contains three DNA double helical domains; these are connected together by four immobile crossover points to produce a 120°angle, which is visible in a side-view in the right part of Fig. 1a. The B tile contains a hairpin that protrudes from the upper helix in the drawing; it contains 10 nucleotide pairs and incorporates two biotin groups in its loop region (Fig. S1).
Fig. 1.
Schematic drawings of the DNA BTX molecules. (a) BTX molecules containing sticky ends. The strand structures of the A and B tiles are indicated; the B tile contains a hairpin feature (in green) whose loop contains biotin groups. The sticky ends in the A tile are labeled a, b, c, d, e and f, and they are complementary to the primed sticky ends in the B tile. A GIDEON-generated14 side view of the BTX molecules showing the 120° angle between DX segments is drawn to the right of the strand structures. (b) The strand structures of the blunt-ended tiles is shown. (c) Regular self-assembly of the sticky-ended BTX tiles. The A and B tiles are shown in GIDEON molecular representations. Streptavidin molecules are shown as yellow circles filled with green that bind to the hairpins. The regular alternation of A and B tiles is visible following sticky-ended cohesion to form a 1D array.
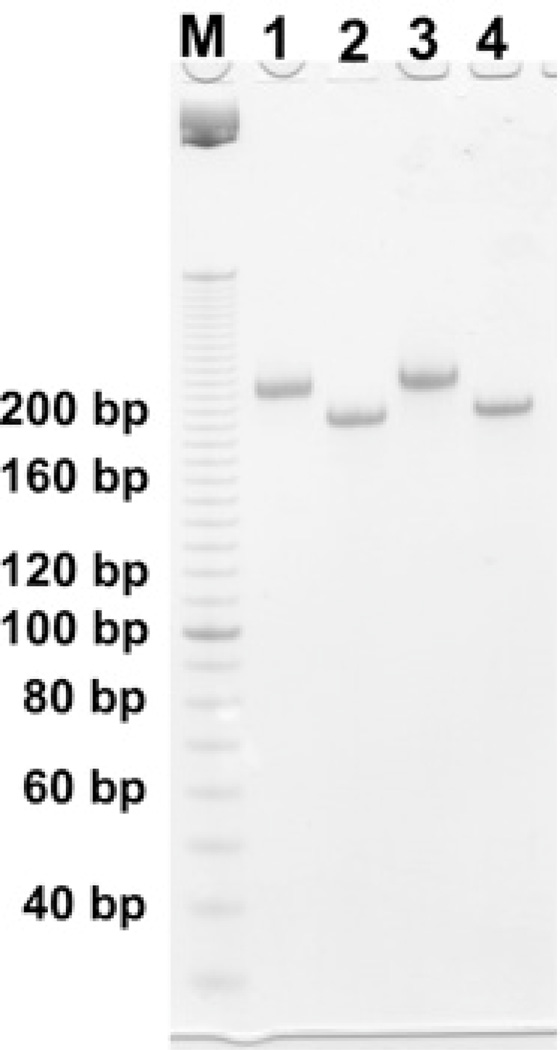
We first characterized the BTX molecules by using non-denaturing gel electrophoresis. Fig. 2 shows the two versions of the BTX molecule. Lanes 1 (B-tile) and 2 (A-tile) contain the blunt-ended versions, and lanes 3 (B-tile) and 4 (A-tile) contain the sticky-ended versions. All of them form clear bands, thus demonstrating their stability and clean formation. The material in lanes 1 and 3 migrates more slowly than that in lanes 2 and 4, owing to the presence of the protruding hairpin feature.
Fig. 2.
A non-denaturing gel demonstrating the formation of the BTX molecules. Lane M contains a linear marker ladder separated by 10 nucleotide pairs. Lane 1 contains the blunt-ended B tile and lane 2 contains the blunt-ended A tile. Lane 3 contains the sticky-ended B tile and lane 4 contains the sticky-ended A tile. The hairpin loops retard the mobilities of the B tiles in lanes 1 and 3.
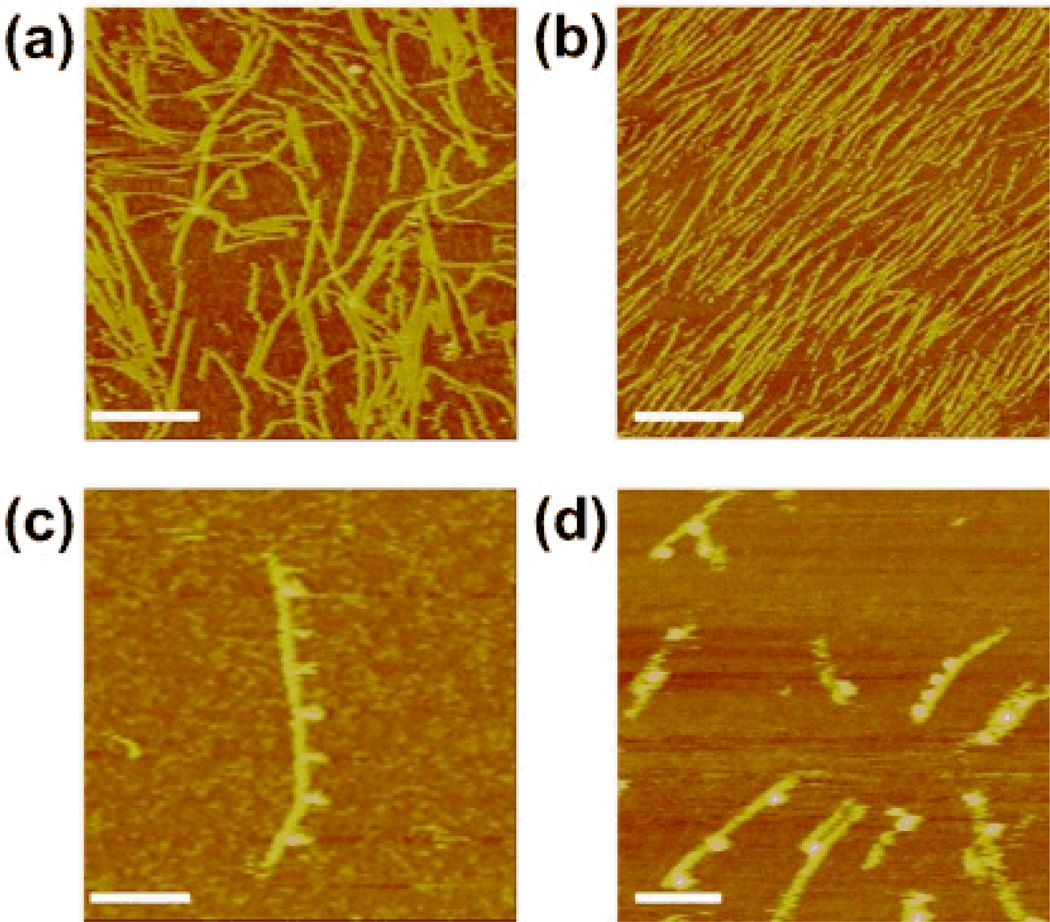
Fig. 3 shows sticky-ended and blunt-ended 1D BTX linear arrays. Panels (a) and (b) lack streptavidin, whereas that label has been added to the material in panels (c) and (d). Fig. 3a shows an AFM image of the sticky-ended self-assembled BTX linear DNA array. The DNA arrays are seen to be of various lengths (~100–800 nm), and may be bent or straight. Fig. 3b shows an AFM image of a blunt-ended BTX linear DNA array. All of the rods look straight and appear to be 200–300 nm in length. The ~1 nm hairpin loops are not resolved in Fig. 3a and 3b. However, the addition of 4 nm streptavidin molecules to the biotinylated hairpins dramatically enhances their visibility in the AFM.9 Fig. 3c shows a BTX linear array of the sticky-ended BTX molecules that has been labeled with streptavidin. The distance between each adjacent streptavidin molecule is ~39 nm, (details in Fig. S2a), in good agreement with the designed distance (40 nm) for an alternating ABAB… pattern. Fig. 3d shows a blunt-ended BTX linear array that has been labeled with streptavidin. The streptavidin doesn’t form a periodic arrangement. Some of the distances are ~20 nm (Fig. S2b), suggesting adjacent B-tiles within the array. Another distance seen is ~59 nm, probably owing to two A tiles between two B tiles (Fig. S2c). Also seen is a distance of ~84 nm, likely resulting from three A tiles between two B tiles (Fig. S2d). Fig. 3d demonstrates that the blunt-ended self-assembled 1D array contains A tiles and B tiles that abut each other in an arbitrary order. It is worth noting, however, that the streptavidin features, when seen in the blunt-ended arrays, all appear to be on the same side of the array, suggesting that there is no apparent rotational component to the stacking interaction.
Fig. 3.
Atomic force micrographs of blunt and sticky-ended BTX linear arrays. (a) A mixture of sticky-ended BTX A and B tiles lacking streptavidin labels. One-dimensional linear arrays are visible. (b) A mixture of blunt-ended A and B BTX tiles lacking streptavidin labels. These tiles also produce 1D linear arrays. In neither (a) nor (b) are the hairpins clearly visible. (c) An array like those in (a), but labeled with streptavidin. The regular 40 nm repeat of streptavidin markers is visible. (d) Arrays like those in (b), but labeled with streptavidin. Varied spacings between the streptavidin markers can be seen. Scale bars: (a) and (b), 250 nm; (c) and (d) 100 nm.
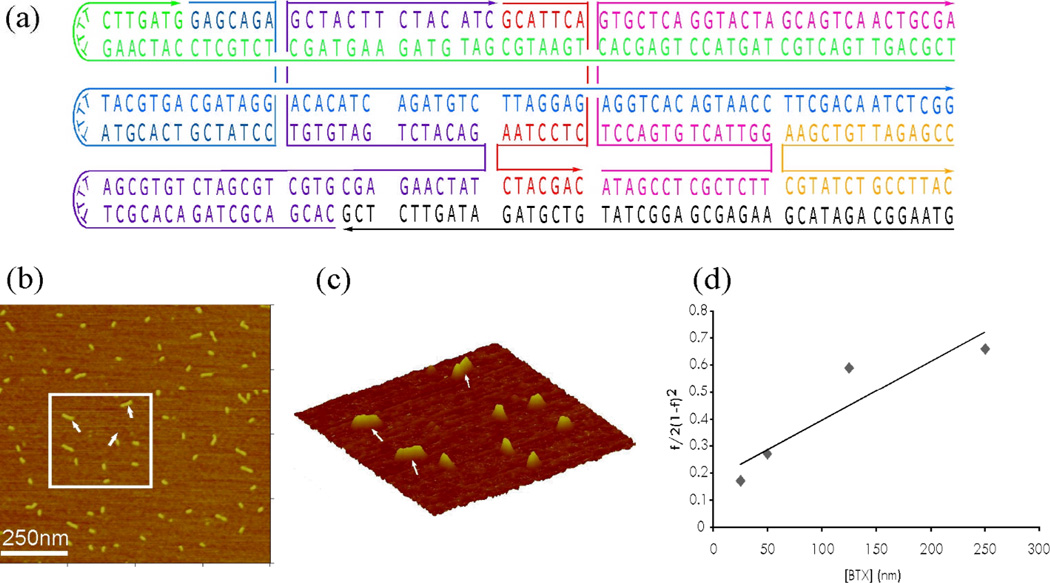
The strength of this base-stacking interaction is clearly of importance. To this end, we have estimated it by observing the dimers that form in a BTX system observed in the AFM, using the single-molecule methods of Ratcliffe & Erie.10 The blunt-ended BTX tile B was modified to form a new molecule by capping its ends with short T4 loops on one side (Fig. 4a); its extra hairpin was also removed. Two monomers form one dimer by blunt-ended stacking interactions in solution. To determine the stacking association constant, solutions of varying concentrations were prepared and imaged in the AFM, by using tapping mode in air. A set of images was collected at each concentration. The images were almost entirly monomers or dimers; a very small number (<.1%) of star-shaped trimers were noted, but ignored in our estimate of the stacking energy because they may involve a different mechanism of cohesion, e.g., strand exchange. Fig. 4b shows a 1 µm × 1 µm AFM image at 125 nM concentration. At this size, it is possible to distinguish monomers from dimers. The 3D view shown in Fig. 4c shows the rectangular area within the box in Fig. 4b. Arrows in Fig. 4c point to dimers, which are clearly distinct from monomers. 3D images with different rotation angles were used to ensure dimer formation was correctly observed. The stacking constant may then be calculated by analyzing data from depositions at several different BTX concentrations, using equation 1.11
| (1) |
Where Ka is the association equilibrium constant (Ka= [dimer]/[monomer]2), c is the concentration of BTX monomers, and f is the fraction of monomers seen as dimers. Because the dissociation constant, Kd is the inverse of the Ka, a plot of f/2 (1-f)2 versus c (Fig. 4d) yields Kd as the inverse slope of the line. The dissociation constant Kd obtained is 4.5 × 10⁻⁷ M. The free energy change calculated from ΔG0 = −RT ln Ka is −8.6 kcal/mol at T = 298 K in 10.5 mM Mg2+. It is likely that this quantity will depend on the individual nucleotides involved in the stacking interaction.
Fig. 4.
Calculation of the Binding Constant. (a) Schematic drawings of the DNA BTX Molecule Used to Measure the Association Constant. The BTX molecule was capped with short T4 loops on one end. The sequence is based on Tile B. (b) An AFM Image of BTX Molecule at a Concentration of 125 nM. The scan size is 1 µm × 1 µm a sufficiently high resolution to distinguish between dimers and monomers. (c) A 3D View of the Rectangle Area within the Image. Arrows point to dimers, which are clearly distinct from monomers. (d) Representative Plot used for Kd Determination. Kd is the inverse slope of the line and is 4.5 × 10⁻⁷ M for the conditions used (25 °C, 10.5 mM Mg2+).
The AFM images in Fig. 3 provide direct evidence that blunt-ended BTX molecules can align to form 1D DNA arrays. This phenomenon may be utilized for nanostructure design, as done earlier when used in conjunction with lateral interactions.3 This is particularly important if one is considering a complex dynamic system for DNA-based computation or assembly12 wherein such stacking species could be designed as intermediates; such species, designed to be ephemeral could stall the assembly or computation. The near absence of linear trimers or larger multimers in experiments involving the molecule in Fig. 4a demonstrates that stacking can be almost completely defeated by the addition of hairpins, although other mechanisms of cohesion may be present. Rothemund has pointed out that more complex components, such as DNA origami,13 could be used to produce an interdigitating code that might be capable of directing specific interactions.
In summary, we have demonstrated here that blunt-ended molecules with three domains are capable of forming apparently random 1D arrays containing about 10 to 15 molecules. Although the importance of stacking interactions in DNA structure has been appreciated for a very long time, this work constitutes a warning to those who might be misled into thinking that blunt ends will not result in the presence of nanostructures.
Supplementary Material
Acknowledgments
This research has been supported by grants GM-29544 from the National Institute of General Medical Sciences, CTS-0608889 and CCF-0726378 from the National Science Foundation, 48681-EL and W911NF-07-1-0439 from the Army Research Office, N000140910181 from the Office of Naval Research and a grant from the W.M. Keck Foundation.
Footnotes
Electronic Supplementary Information (ESI) available: Experimental methods and DNA sequence. See DOI: 10.1039/b000000x/
Contributor Information
Risheng Wang, Email: rsw224@nyu.edu.
Akinori Kuzuya, Email: kuzu@mkomi.rcast.u-tokyo.ac.jp.
Wenyan Liu, Email: wl502@nyu.edu.
Nadrian. C. Seeman, Email: ned.seeman@nyu.edu.
Notes and references
- 1.Seeman NC. Nature. 2003;42:427. doi: 10.1038/nature01406. [DOI] [PubMed] [Google Scholar]
- 2.Chen J, Seeman NC. Nature. 1991;350:631. doi: 10.1038/350631a0. [DOI] [PubMed] [Google Scholar]
- 3.Kuzuya A, Wang R, Sha R, Seeman NC. Nano Letters. 2007;7:1757. doi: 10.1021/nl070828k. [DOI] [PMC free article] [PubMed] [Google Scholar]
- 4.Winfree E, Liu F, Wenzler LA, Seeman NC. Nature. 1998;394:539. doi: 10.1038/28998. [DOI] [PubMed] [Google Scholar]
- 5.Ding B, Sha R, Seeman NC. J. Am. Chem. Soc. 2004;126:10236. doi: 10.1021/ja047486u. [DOI] [PubMed] [Google Scholar]
- 6.Zheng J, Birktoft JJ, Chen Y, Wang T, Sha R, Constantinou PE, Ginell LS, Mao C, Seeman NC. Nature. 2009;243:150. doi: 10.1038/nature08274. [DOI] [PMC free article] [PubMed] [Google Scholar]
- 7.Mao C, Sun W, Shen Z, Seeman NC. Nature. 1999;397:144. doi: 10.1038/16437. [DOI] [PubMed] [Google Scholar]
- 8.Yan H, Zhang X, Shen Z, Seeman NC. Nature. 2002;415:62. doi: 10.1038/415062a. [DOI] [PubMed] [Google Scholar]
- 9.Li H, Park SH, Reif JH, LaBean TH, Yan H. J. Am. Chem. Soc. 2004;126:418. doi: 10.1021/ja0383367. [DOI] [PubMed] [Google Scholar]
- 10.Ratcliff GC, Erie DA. J. Am. Chem. Soc. 2001;123:5632. doi: 10.1021/ja005750n. [DOI] [PubMed] [Google Scholar]
- 11.Cantor CR, Shimmel PR. In: Biophysical Chemistry. Freeman WH, editor. San Francisco: 1980. p. 1195. [Google Scholar]
- 12.Yin P, Choi HTM, Calvert CR, Pierce NA. Nature. 2008;451:318. doi: 10.1038/nature06451. [DOI] [PubMed] [Google Scholar]
- 13.Rothemund PWK. Nature. 2006;440:297. doi: 10.1038/nature04586. [DOI] [PubMed] [Google Scholar]
- 14.Birac JJ, Sherman WB, Kopatsch J, Constantinou PE, Seeman NC. J. Mol. Graph & Modeling. 2006;25:470. doi: 10.1016/j.jmgm.2006.03.005. [DOI] [PMC free article] [PubMed] [Google Scholar]
Associated Data
This section collects any data citations, data availability statements, or supplementary materials included in this article.


