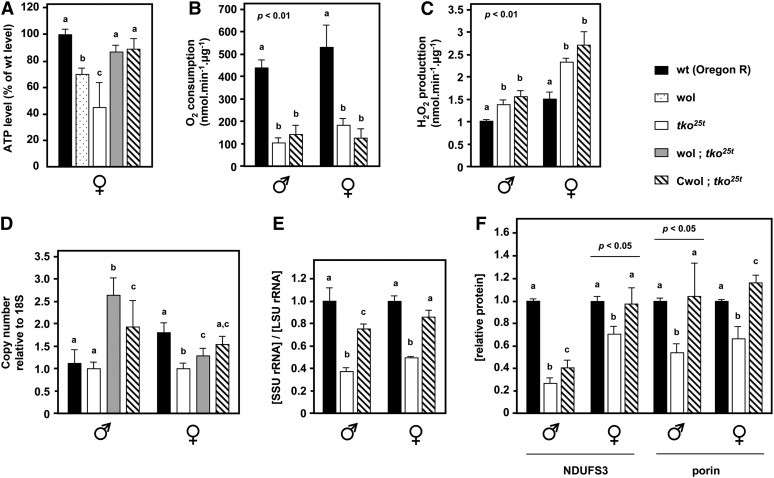
Figure 2 .
BER1 mtDNA influences ATP, mtDNA, mtRNA, and protein levels in tko25t flies. (A) ATP levels in whole flies (mean ± SD), plus (B) oxygen consumption, and (C) ROS production of isolated mitochondria from flies of the indicated sex and genotypes, mean ± SE, three or more biological replicates. (D) Copy number of mtDNA in flies of the genotypes indicated, relative to 18S rDNA, means ± SD, normalized to that in tko25t flies of the same sex. (E) Ratio of mitoribosomal SSU to LSU RNA levels in flies of the indicated genotypes, means ± SD wol; tko25t and Cwol; tko25t flies, maintained as balanced stocks, were backcrossed over five or more generations to tko25t in the Oregon R background and rendered homozygous prior to the experiment. (F) Levels of a representative subunit of complex I (NDUFS3) and of a global mitochondrial protein marker (porin) in flies of the sex and genotype indicated, based on densitometry of Western blots as shown in Figure S2E, normalized against a cytosolic loading control (α-actinin). A, B, and C denote significantly different data classes (Newman–Keuls test, P < 0.05, based on ANOVA, P < 0.001 except where indicated, each sex and, where appropriate, each gene considered separately).

