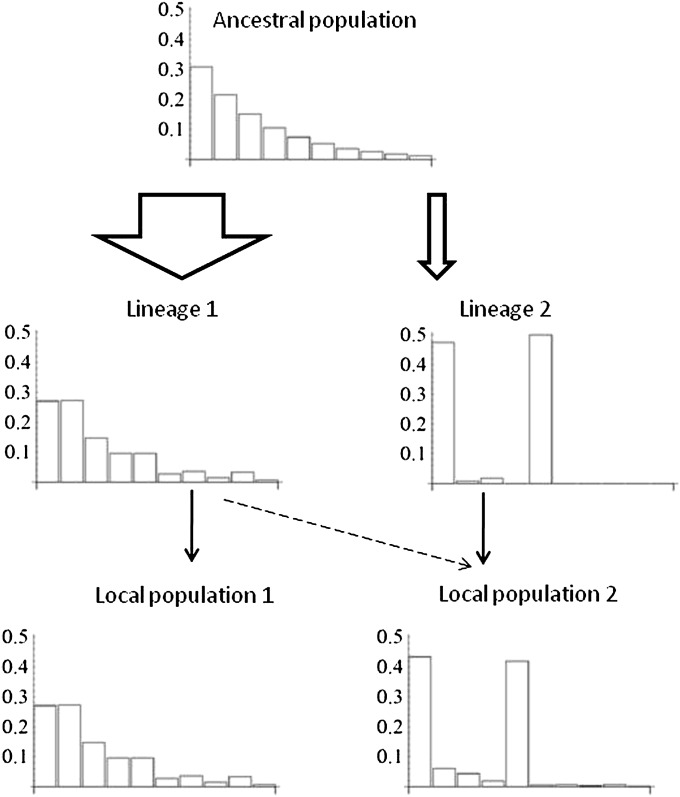
Figure 1 .
Schematic presentation of the admixture F model (AFM), in which subpopulations are constructed as admixtures of independent lineages. The histograms represent allele frequencies in a particular locus in the ancestral generation, in two independent lineages, and in two present subpopulations. In this example, lineage 1 has been subject to little drift (parameter value a1 = 100). In contrast, only two alleles remain at high frequency in lineage 2 as a result of much drift (a2 = 0.5). Population 1 is identical to lineage 1 (k11 = 1, k12 = 0). Population 2 is mainly derived from lineage 2, but has received some gene flow from lineage 1 (k21 = 0.1, k22 = 0.9). These parameter values give population-level coancestry coefficients , , and , yielding FST = 0.22.

