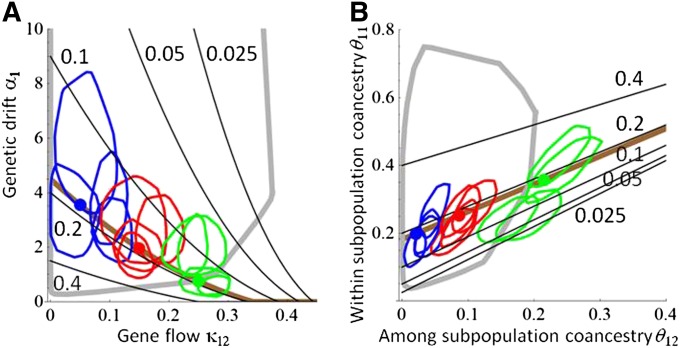
Figure 4 .
Separation of genetic drift and gene flow as causes of genetic differentiation. In the simulated case study consisting of two identical populations, FST and the subpopulation-level coancestry coefficients depend on the parameters a1 = a2 (measuring genetic drift) and k12 = k21 (measuring gene flow). The black lines show isoclines of FST in (k12, a1) space (A) and in (θ12,θ11) space (B). The brown line shows the isocline of FST = 0.18 corresponding to the true value in all three simulated scenarios, and the solid circles show the true parameter values for each of the scenarios. The lines show the parameter estimates of the fitted models, measured by 75% polytope quantiles of the posterior distributions. The thick gray lines show the 75% polytope quantiles for the prior distribution.

