

Abstract
Fusarins are a class of mycotoxins of the polyketide family produced by different Fusarium species, including the gibberellin-producing fungus Fusarium fujikuroi. Based on sequence comparisons between polyketide synthase (PKS) enzymes for fusarin production in other Fusarium strains, we have identified the F. fujikuroi orthologue, called fusA. The participation of fusA in fusarin biosynthesis was demonstrated by targeted mutagenesis. Fusarin production is transiently stimulated by nitrogen availability in this fungus, a regulation paralleled by the fusA mRNA levels in the cell. Illumination of the cultures results in a reduction of the fusarin content, an effect partially explained by a high sensitivity of these compounds to light. Mutants of the fusA gene exhibit no external phenotypic alterations, including morphology and conidiation, except for a lack of the characteristic yellow and/or orange pigmentation of fusarins. Moreover, the fusA mutants are less efficient than the wild type at degrading cellophane on agar cultures, a trait associated with pathogenesis functions in Fusarium oxysporum. The fusA mutants, however, are not affected in their capacities to grow on plant tissues.
INTRODUCTION
Filamentous fungi are able to produce a wide range of secondary metabolites. Many of them are mycotoxins, i.e., compounds with undesired deleterious effects on human or animal health (8). There is a considerable lack of knowledge on the biological functions of many fungal secondary metabolites (7).
Fusarium species are able to produce a variety of polyketides, a heterogeneous family of chemicals whose synthesis starts from the sequential condensation of acetate units through the activity of a multifunctional polyketide synthase (PKS). Fungal PKSs are large multidomain enzymes, related to fatty acid synthases (31), and classified as type I PKSs according to the different classes described in bacteria (34). Variability in the type and number of domains contributes to the diversity of metabolites generated by fungal PKSs.
The Fusarium graminearum (Gibberella zeae) genome includes 15 presumptive PKS-encoding genes involved in the biosynthesis of different compounds (12), such as the pigments fusarubin (35) and bikaverin (19) or the mycotoxins zearalenone (38), aurofusarin (30), and fusarin C (13). We are interested in fusarin C, a mutagenic compound (13, 14, 40), which is active on mammalian cells in vitro (5). Fusarin C is an unstable compound, spontaneously converted into stereoisomers upon exposure to long-wave UV light (14). Its mutagenicity requires metabolic activation, but, due to its instability, attempts to isolate the reactive metabolite have been unsuccessful (13). The mutagenic properties apparently rely on the C13-C14 epoxide group, present also in the fusarin C stereoisomers.
Little information is available on the regulation of fusarin C biosynthesis in Fusarium. Its production was induced by the lack of zinc (17) and by the presence of a high carbon concentration (16) in F. moniliforme. Fusarin C produced by F. fujikuroi (2) was enhanced upon growth at high temperature, low aeration (15), and nitrogen starvation (41). In addition to F. graminearum, the PKS responsible for fusarin biosynthesis (FusA/Fus1) has been identified in F. moniliforme, F. venenatum, and F. verticillioides (12, 32, 3). In the present study, the gene encoding the PKS responsible for fusarin biosynthesis in F. fujikuroi, fusA, has been identified and characterized. The effect of nitrogen availability on fusarin production and fusA mRNA levels has been investigated. As predicted, ΔfusA mutants did not produce fusarin C, but they exhibited an unexpected reduction in their capacity to degrade cellophane.
MATERIALS AND METHODS
Fungal strains and culture conditions.
Wild-type F. fujikuroi (G. fujikuroi mating population C [22]) FKMC1995 (kindly provided by John F. Leslie) and IMI58289 (Commonwealth Mycological Institute, London, England) were used. Unless otherwise stated, strains were grown on DG minimal medium (1) with l-asparagine instead of NaNO3 as a nitrogen source (DGasn). For the selection of transformants, the medium was supplemented with 50 mg of hygromycin/ml. For conidiation analyses, the strains were grown in the dark for 7 days at 22°C on DGasn. For the determination of colony growth, a piece of mycelium from each strain was spotted onto DGasn agar and incubated in the dark or under illumination for 7 days at 22 or 30°C.
For the analysis of fusarin production, the strains were grown at 30°C, in the dark or under illumination (3 W/m2 white light, ∼180 lx, provided by four fluorescent lamps OSRAM L, 18W/840; Lumlux, Germany), in 500-ml Erlenmeyer flasks with 250 ml of DG medium with the indicated nitrogen source. The flasks were inoculated with 106 conidia and incubated for 3 to 14 days on a rotary shaker at 150 rpm. To study the effect of the nitrogen concentration, l-asparagine was used at two concentrations: 20 mM (high-N medium) or 4.2 mM (low-N medium). The nitrogen concentration in the low-N medium corresponds to the N/C ratio obtained with 1 g of NH4NO3/liter in ICI medium, described as a limiting N content (4). Production was also analyzed with other nitrogen sources: 35.3 mM NaNO3, 25 mM NH4NO3, 20.5 mM glutamine, and 33.7 mM alanine for high-N medium and 7.4 mM NaNO3, 3.75 mM NH4NO3, 4.31 mM Gln, and 7.08 mM Ala for low-N medium.
For DNA isolation, the strains were grown in 50 ml of DGasn medium in 250-ml Erlenmeyer flasks for 2 days at 30°C and 150 rpm. Mycelia were filtered from the media through Whatman paper. For RNA isolation, mycelial samples were filtered from the media after growing in the conditions described above for fusarin production. Mycelia were frozen in liquid nitrogen until used.
Fusarin analysis.
Fusarins were extracted from mycelia and culture medium and measured. Medium samples (3 ml) were extracted twice by partition with an equal volume of chloroform. The extracted samples were combined and vacuum dried in a Concentrator Plus (Eppendorf, Germany) and resuspended in 0.2 ml of methanol. For cell extraction, ca. 20 mg of lyophilized mycelia were ground with methanol in a Fast-Prep-24 homogenizer (MP Biomedicals LLC Europe, France) using sea sand (Panreac Química SAU, Barcelona, Spain) and two pulses of 30 s at 6 m/s. The extracted samples were vacuum dried and resuspended in 0.2 ml of methanol. Fusarin concentrations were determined through absorption at 350 nm using a UV/Vis spectrophotometer (Beckman DU, USA) as described previously (2).
Identification and targeted mutation of fusA.
The sequences for the fusA orthologues of F. graminearum and F. verticillioides were obtained from the Fusarium Comparative Database (http://www.broadinstitute.org/annotation/genome/fusarium_group/MultiHome.html) and compared to the CLUSTAL alignment program. Because of the large size of this gene (ca.11 kb in the indicated species), two primer sets (Table 1) were designed to amplify two distant fusA gene segments, which we designated pksF1 and pksF2 (see Fig. 4). pksF1 is a 1.6-kb DNA fragment obtained with the primer set fusA-1F/fusA-1R (Table 1), partially covering the N-terminal KAS and AT domains (see Fig. 4). pksF2 is a 1.2-kb DNA fragment obtained with the primer set fusA-2F/fusA-2R, partially covering the C-terminal AMP and PP domains (see Fig. 4). The identity of the PCR products was confirmed by sequencing. To facilitate the subcloning of the pksF1 and pksF2 fragments, the primer sets were modified to include artificial restriction sites: (i) fusA-4R (ApaI)/fusA-4F (KpnI) for pksF1 and (ii) fusA-5F (SpeI)/fusA-5R (NotI) for pksF2. The resulting products were separately cloned into the pGEM-T Easy vector (Promega). The hygromycin resistance (Hygr) cassette from plasmid pAN7-1 (24) was released by digestion with BglII and BamHI and cloned in pBluescript KS(+) (Stratagene), yielding plasmid pVIO2. pksF1 and pksF2 fragments were released from their pGEM-T corresponding plasmids and cloned into pVIO2 flanking the Hygr cassette, producing the fusA disruption vector pVIO3. Plasmid constructions and orientation of cloned DNA segments were confirmed by restriction analysis. For F. fujikuroi transformation, FKMC1995 protoplasts were obtained as described previously (10). A suspension of 3 × 10⁸ protoplasts was transformed with 5 μg of lineal pVIO3 according to the method of Proctor et al. (23).
Table 1.
Oligonucleotides used in this study
| Oligonucleotide | Sequence (5′–3′) | Purpose |
|---|---|---|
| fusA-1F | AGGGTGTAGCAGCCATCATG | Sequencing |
| fusA-1R | CCAAGACACTGGAGTACCAC | Sequencing |
| fusA-2F | CCAGAACCCGATCAAGCGTC | Sequencing |
| fusA-2R | CAGAAGCGTTCATGGGGAGC | Sequencing |
| fusA-4F | GCCCGGTACCTATCTCAAGCGTTGGC (KpnI) | Cloning |
| fusA-4R | GCTTGGGCCACTCCACAGACTCGTC (ApaI) | Cloning |
| fusA-5F | GGCCACTAGTGCGATTGTCACCTGATG (SpeI) | Cloning |
| fusA-5R | GCATATGCGGCCGCGAGTTTCTGTATCGAG (NotI) | Cloning |
| RTfusA-1F | TTGATATGTCGCTTACGCAGATG | qRT-PCR |
| RTfusA-1R | TCTCACTGGATGCAACGATCAG | qRT-PCR |
| tub2-F | CCGGTGCTGGAAACAACTG | qRT-PCR |
| tub2-R | CGAGGACCTGGTCGACAAGT | qRT-PCR |
Fig 4.

Simplified representation of the CLUSTAL alignment of 15 predicted PKS proteins encoded in the F. graminearum genome. Conservation of consensus positions is displayed below. PKS10 is the enzyme responsible for fusarin production in F. graminearum. The two conserved segments cloned from fusA, pksF1 and pksF2, are shown as bars on the upper part of the PKS10 scheme. Domains displayed below the PKS10 scheme were identified with the Simple Modular Architecture Research Tool (SMART): KAS (β-ketoacyl synhtase), AT (acyl transferase), DH (dehydratase), MeT (methyltransferase), KR (β-ketoacyl reductase), PP (phosphopantetheine attachment site), C (condensation), AMP (AMP binding), and NAD (NAD binding). The domains located in the long PKS10 carboxy extension, exclusively found in this enzyme, are typical domains of NRPS.
Molecular techniques.
Genomic DNA for PCR and Southern blot analyses was isolated from mycelium as described by Weinkove et al. (39). PCR analyses were performed with ca. 50 ng of genomic DNA, 0.2 mM deoxynucleoside triphosphates, 1 μM forward and reverse primers, and 0.2 U of the polymerase Ecotaq (Bioline)/μl. Reaction mixtures were heated at 94°C for 2 min, followed by 35 cycles of denaturation (94°C for 30 s), annealing (48 to 55°C for 30 s, according to the melting temperature of the primers), and polymerization (72°C for 1 to 2 min, depending on the length of the expected product) and by a final polymerization step at 72°C for 5 min. Amplified DNA fragments were purified using GFX PCR DNA and gel band purification kits (GE Healthcare, United Kingdom) and cloned into pGEM-T Easy vector (Promega).
Southern blot hybridization was performed using standard protocols (28). Fragment pksF2 was radioactively labeled and used as a probe.
Gene expression analysis.
For isolation of total RNA, mycelia were lysed in a Fast-Prep-24 homogenizer prior to using an RNeasy plant minikit (Qiagen). The total RNA concentration was estimated with a NanoDrop ND-1000 spectrophotometer (NanoDrop Technologies, Wilmington, DE). Real-time quantitative reverse transcription-PCR (qRT-PCR) expression analyses were performed on total RNA samples as a template using the 7500 real-time PCR system (Applied Biosystems) as previously described (26). The primer sets for qRT-PCRs, designed with Primer Express v2.0.0 software (Applied Biosystems), were RTfusA-1F/RTfusA-1R for the fusA gene and tub-2F/tub-2R for the β-tubulin gene, used as a control for constitutive expression. Relative gene expression was calculated with the 2−ΔΔCT method with Sequence Detection Software v1.2.2 (Applied Biosystems). Samples from two independent experiments were assayed in duplicate to ensure statistical accuracy.
Cellophane and virulence assays.
For cellophane penetration assays, DGasn plates were covered with sterile cellophane discs (Scotch, Cergy Pontoise, France) and inoculated into the center of the plate with 5-mm-diammeter mycelial discs of each strain. After the plates were incubated at 30°C in the dark for 9 days, the cellophane discs were removed, and the mycelia were separated from them. The discs were observed under a stereoscopic microscope (Nikon, Japan) and photographed with a digital camera. Invasive growth assays on tomato fruit (cv. Daniela) and apple slices (cv. Granny Smith) were carried out as previously described (9, 20) using at least three replicates.
Sequence analysis.
BLAST analysis was done through the National Center for Biotechnology Information server (www.ncbi.nlm.nih.gov/blast). BLASTP searches were carried out against the nonredundant Swiss-Prot database. Alignments were achieved with CLUSTAL W program (EMBL-EBI European Bioinformatics Institute [http://www.ebi.ac.uk/clustalw/]). DNA sequences for protein alignments were obtained through the server of the Broad Institute (Cambridge, MA [www.broad.mit.edu/annotation/fungi]).
A draft sequence of the F. fusarium IMI58289 genome was obtained with a Roche 454 Genome Sequencing System (454 Life Sciences Corp., Branford, CT) at the Unitat de Genòmica (CCiT, Universitat de Barcelona, Barcelona, Spain). Genome assembly was done by S. Beltrán (Unitat de Bioinformática, Serveis Cientificotecnics, University of Barcelona) based in 339 Mb of total reads, with an average read size of 287 bp.
Nucleotide sequence accession number.
The DNA sequence of fusA gene was submitted to the GenBank database under accession no. JX308619.
RESULTS AND DISCUSSION
Effect of nitrogen on fusarin production.
To confirm the dependence of fusarin production on nitrogen availability, we analyzed the effect of nitrogen source and concentration on the accumulation of fusarins in the mycelia and in the medium in the wild-type strain FKMC1995. We tested the nitrogen sources: NaNO3, NH4NO3, Asn, Gln, and Ala at excess (high-N) and limiting (low-N) concentrations under dark conditions. Fusarin content was enhanced in high-N medium in most of the cases, with the higher productions with organic N sources, i.e., Asn, Gln, or Ala (Fig. 1A). Fusarin production was much lower in mycelia grown in low-N medium, except with NH4NO3, in which the levels of fusarin were not significantly affected by the concentration of this salt (Fig. 1B). Similar results were obtained upon analysis of fusarin secreted to the media (Fig. 1A). In this case, however, the differences in fusarin content between cultures with organic and inorganic N sources were less pronounced than those observed in the mycelia; again, the fusarin levels with low NH4NO3 concentrations were significantly higher than those with low amounts of other nitrogen sources.
Fig 1.
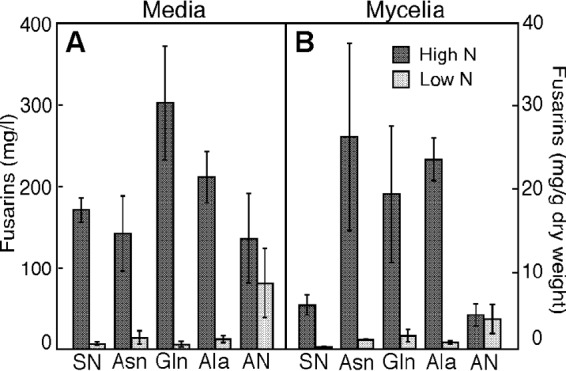
Effect of the nitrogen source and its concentration on fusarin production. F. fujikuroi FKMC1995 cultures were grown in liquid minimal DG in the dark at 30°C for 7 days. High nitrogen concentrations: 35.3 mM NaNO3, 25 mM NH4NO3, 20 mM Asn, 20.5 mM Gln, 33.7 mM Ala. Low nitrogen concentration: 7.4 mM NaNO3, 3.75 mM NH4NO3, 4.2 mM Asn, 4.31 mM Gln, 7.08 mM Ala. SN, sodium nitrate; AN, NH4NO3. The data show averages and standard deviations from two independent experiments.
To learn more of the effect of nitrogen on fusarin production, time course experiments were performed in high-N and low-N media, using Asn as the nitrogen source. In this case, the production was also assayed with a second wild-type strain, IMI58289. As expected, the amounts of fusarin in the medium were higher in high-N medium than in low-N medium. The fusarin content increased in the first days of incubation, to reach a maximum at about 1 week, and decreased afterward. The IMI58289 strain produced ∼2-fold less fusarin than FKMC1995, but it exhibited similar production kinetics (Fig. 2A). In addition, FKMC1995 and IMI58289 differed in their production in low-N medium: whereas the FKMC1995 strain was still able to secrete up to 25% of the fusarins produced in high-N conditions, this mycotoxin was hardly detected in the low-N IMI58289 cultures (Fig. 2A). Thus, the difference in fusarin production between high-N and low-N medium was from 3- to 5-fold in FKMC1995 compared to >10-fold in the case of IMI58289.
Fig 2.

Effect of nitrogen concentration and illumination on fusarin production by the wild-type strains FKMC1995 (△) and IMI58289 (□). Mycelia were grown in liquid DGasn medium at two asparagine concentrations—20 mM (high-N medium, continuous lines) or 4.2 mM asparagine (low-N medium, dashed lines)—and incubated in the dark (A and B) or under white light at 3 W/m2 (C and D). Fusarins were measured in the culture medium (A and C) and in mycelia (B and D) at different times during 14-day incubations. The data show averages and standard deviations from two independent experiments.
In agreement with the fusarin concentrations found in culture filtrates, the FKMC1995 hyphae contained more fusarins in high-N medium than in low-N medium. In this case, the increase in high-N medium was more remarkable, becoming up to 8-fold higher compared to the fusarin content in the low-N filtrates. The highest fusarin concentration in the FKMC1995 mycelia was found after a 9-day incubation (Fig. 2B) and remained high over time. However, in contrast to FKMC1995, very low levels of fusarin could be detected in the IMI58289 cells for the 2-week incubation, either in high or low-N medium (Fig. 2B). A rough calculation of the fusarin distribution in FKMC1995 cultures after 9 days of growth indicates that ca. 62% of the total fusarin content was inside the cell and 38% was in the culture medium. This ratio was inversed in the IMI58289 cultures, with 5% in the mycelium and 95% in the culture medium. However, total production was lower in the latter (18.6 mg/g [dry weight]) than in FKMC1995 (29.3 mg/g [dry weight]). Thus, the two wild-type strains differed in their fusarin distribution patterns: while FKMC1995 accumulated significant amounts of fusarin in the cells, IMI58289 seemed to secrete them actively, suggesting a more efficient fusarin efflux system in this strain.
The stimulation of fusarin synthesis by F. fujikuroi by the presence of nitrogen fits former observations (41) and differs from the predominant rule in the regulation of secondary metabolism in this fungus, usually associated with nitrogen starvation (discussed below). Consistent with the need of nitrogen, fusarins were already found in the younger culture samples, indicating that they are produced by actively growing mycelia. The production kept active for ∼1 week but went down in more advanced culture stages, with predictably lower nitrogen concentrations.
Effect of light on fusarin production.
Light is a key environmental signal that affects many metabolic pathways in fungi (36). Fusarin production in F. fujikuroi is affected by mutations in proteins putatively involved in light regulation, WcoA (11) and FfVel1 (41). For this reason, we also checked the effect of light on fusarin production in the time course experiments. Under illumination, significant amounts of fusarin were only detected in the cultures of the FKMC1995 strain in high-N conditions, either in the mycelia or in the medium. In contrast, only minor concentrations were found in the cultures of the IMI58289 strain irrespective of the nitrogen concentration (Fig. 2C and D). Moreover, after 2 weeks of incubation, fusarins totally disappeared from the medium and the mycelia of the illuminated FKMC1995 cultures.
The differences between illuminated and dark-grown cultures may be explained either by a regulatory mechanism or by light sensitivity of the fusarins. To gain insight into the basis of this effect, a fusarin-containing sample was obtained by filtration of a dark-grown high-N culture of the FKMC1995 strain and kept in the dark or exposed to white light up to 78 h (same conditions that in the time course). The amount of fusarin, determined from its absorbance peak at 350 nm, remained approximately unaltered during this time in the dark but decreased rapidly in the light, disappearing totally after 40 h of illumination (Fig. 3). Similar results were obtained in samples from IMI58289 cultures (Fig. 3, inset) or if the fusarins were extracted from the medium and illuminated in a methanol solution (data not shown). We conclude that the lower fusarin amounts in the illuminated cultures are the result of a high sensitivity to light of these compounds. Interestingly, in contrast to the FKMC1995 control, no fusarins were detected in the mycelia of mutants for the White collar gene wcoA after 1-week incubation under light on high-N agar (14), suggesting a WcoA-mediated stimulatory mechanism in FKMC1995 to compensate for fusarin degradation.
Fig 3.

Stability of fusarin in media from batch cultures of the wild-type strain FKMC1995 grown for 7 days at 30°C in the dark. Cultures were filtered and centrifuged, and the supernatants were incubated at 30°C and 150 rpm either in the dark (black symbols) or under white light at 3 W/m2 (open symbols). Samples were filtered and centrifuged again, and diluted in water if needed, before measurement at 350 nm. Comparison with data obtained with a similar sample from a wild-type IMI58289 culture is shown in the inset box.
Taking into account the degradation rate (ca. 0.84/day and 0.63/day for FKMC1995 and IMI5828 filtered samples, respectively), we can estimate the expected fusarin amounts in the light in the absence of degradation. In the most productive period, between days 3 and 5 (Fig. 2A and C), the fusarin content in the FKMC1995 cultures increased ca. 62 and 54 mg/liter per day in the dark and under illumination, respectively. If we correct the production in the light with the degradation rate, the real production would reach 332 mg/liter per day, i.e., 5-fold higher than in the dark. This is probably an overestimate, since the fusarins may be partially protected against light by the mycelia in the culture by a shading effect. However, it seems very likely that the real production by FKMC1995 is higher in the light than in the dark, at least in the early stages of the culture. This was not the case of IMI58289, whose production rates during the same time period were 24 mg/liter/day in the dark and 1 mg/liter per day in the light. The correction with the degradation rate would elevate the value in the light to ca. 5 mg/liter per day, still below the 34 mg/liter per day of the dark-grown culture. Thus, both strains differed in their fusarin productions in response to light.
Identification of the fusarin polyketide synthase gene fusA.
The PKS gene responsible for fusarin biosynthesis was identified and confirmed by targeted disruption in Fusarium moniliforme and Fusarium venenatum (fusA [32]), and in F. graminearum (GzFUS1 [12]). In the latter case, the analysis was extended to 14 additional PKS genes, many of them with unidentified function. A CLUSTAL alignment of the 15 putative PKS protein sequences of F. graminearum investigated by Gaffoor et al. (12) revealed the occurrence in all of them of conserved typical domains for PKS activity, extending along 2,000- to 2,500-amino-acid (aa) sequences (Fig. 4). The highest similarity to PKS10 is exhibited by PKS9, which is involved in the synthesis of fusarielins and is not related to fusarins (33). The analysis of the predicted GzFUS1 (PKS10) polypeptide with the Simple Modular Architecture Research Tool (SMART [see Materials and Methods]) revealed 10 protein domains: KS, AT, DH, MeT, KR, PP, C, AMP, PP, and NAD (see the legend to Fig. 4 for domain descriptions). The first six domains are characteristic of PKS enzymes, while the four additional ones, located in a carboxy extension absent in other F. graminearum PKS enzymes, are conserved in nonribosomal peptide synthase (NRPS) enzymes. The combination of PKS domains with predictable NRPS domains makes this PKS enzyme the largest from this family known to date. The NRPS module was suggested to be involved in specific biosynthetic steps for amino acid modifications to produce the pyrrolidone ring of fusarin (25). The specific presence of this module in fusarin PKS genes could be used for the detection of putative fusarin-producing fungi in food and cereal grains.
BLAST analyses of the GzFUS1 sequence against other publicly available Fusarium genomes revealed the occurrence of a clear orthologous in F. verticillioides, but not in F. oxysporum. The capacity of F. fujikuroi to produce fusarins implies the occurrence of a highly similar orthologous gene in its genome, which we refer to as fusA. The availability of the GzFUS1/fusA Fusarium sequences allows designing primers from highly conserved protein and DNA segments. Because of the unusually large size of GzFUS1 in F. graminearum (11,859 bp, 3,920 aa, annotation code FGSG_07798), or its orthologue in F. verticillioides (12,189 bp, 3,855 aa, annotation code FVEG_11086), we based our cloning strategy in two distant conserved open reading frame segments, which we called pksF1 and pksF2 (see Fig. 4 and Materials and Methods). The corresponding PCR products were sequenced and confirmed to be the predicted fusA fragments.
In a late stage of this work, a draft of the F. fujikuroi genome was obtained by massive sequencing techniques (see Materials and Methods). A BLAST search against the genomic sequence database provided the complete fusA gene sequence, containing the same PKS and NRPS domains found in PKS10 (Fig. 4B). The sequence available from the predicted F. fujikuroi fusA product showed a higher degree of identity with the F. verticillioides orthologue (92.1%, FVEG_11086) than with GzFUS1 (72.2%, FGSG_07798).
Regulation of the gene fusA.
The identification of fusA as a key structural gene of fusarin biosynthesis allows the analysis of its transcriptional regulation. The fusA mRNA levels were determined by qRT-PCR in mycelia from the two wild-type strains in time course experiments, either in high-N or low-N medium and either in darkness or under illumination. In agreement with the fusarin production (Fig. 2), the amount of fusA mRNA increased severalfold between 5 and 7 days of incubation in high-N medium (Fig. 5), whereas such an increase was not apparent in low-N medium. Upon aging, i.e., after 10 days of incubation or longer, the fusA mRNA content in high-N medium decreased to reach similar concentrations as in low-N medium, or even lower. Similar results were obtained with both strains either in the dark or under illumination, except that the induction in high-N medium was somewhat slower in IMI58289 (Fig. 5C and D) than in FKMC1995 (Fig. 5A and B). In addition, the induction in high-N medium was apparently less prominent in the light than in the dark for both strains.
Fig 5.

Effect of nitrogen and light on fusA mRNA levels in WT strains FKMC1995 (A and B) and IMI58289 (C and D). Mycelia were grown in liquid DGasn media with two asparagine concentrations: 20 mM (high-N medium, continuous lines) or 4.2 mM asparagine (low-N medium, dashed lines), incubated in the dark (A and C) or under white light at 3 W/m2 (B and D). Total RNA was extracted from mycelial samples collected at different times during 14-day incubations. The data are averages and standard deviations of four measurements from two independent experiments.
Nitrogen is available at the start of the incubation in low-N medium. Therefore, we might expect a certain level of fusA induction at a very early growth stage under these culture conditions. This might explain the high fusA mRNA content in the 3-day-old FKMC1995 mycelia in low-N medium. However, such an effect was not apparent in the light or in the IMI58289 strain.
The positive correlation between fusarin production and fusA mRNA levels indicates that the nitrogen activation is most probably achieved through transcriptional induction of the structural genes. This regulatory pattern is opposite to the mRNA regulation of the structural genes for the gibberellin, bikaverin, and fusarubin biosynthetic pathways in the same species, which are induced by nitrogen starvation (27, 35, 37, 42). On the other hand, light had only minor effects on the fusA mRNA levels. These results do not fit our estimates of real fusarin amounts in the illuminated cultures, which suggested up- and downregulatory effects of light on FKMC1995 and IMI58289, respectively. These presumed differences are not reflected in the observed mRNA patterns, suggesting the mediation of other regulatory mechanisms.
The activation of fusA in high-N medium is transient, suggesting that nitrogen availability is not sufficient to keep the induction. Probably, fusA expression is also controlled by other regulatory signals, possibly linked to the growth stage of the cell. On the other hand, the decrease in fusA mRNA to basal levels in aging cultures fits with the cessation of fusarin accumulation after 1 week. The fusarin amounts actually decrease, what implies further metabolizing or chemical instability of the product. A similar decay was formerly observed in an IMI58289-derived mutant under different culture conditions (2). However, compared to the high instability in the light, our results indicated that fusarins were relatively stable under darkness, which is in agreement with recent data (18).
Targeted mutation of fusA.
The cloned pksF1 and pksF2 segments of F. fujikuroi fusA were used to construct the disruption plasmid pVIO3, in which both fusA segments surround a hygromycin resistance cassette (Fig. 6A). FKMC1995 protoplasts were incubated with linearized pVIO3 and regenerated under hygromycin selection. After 1 week of incubation, 11 transformants were obtained. Five of them lacked the characteristic wild-type orange pigmentation. Five representative transformants, three of them from the latter class (T3, T4, and T6 [Fig. 6C]), were passed through single conidia and subcultured under hygromycin selection. Genomic DNA from the wild type and the five transformants were analyzed by Southern blot using the pksF2 fragment as a probe. The sizes of the expected hybridizing bands, 1.6 kb for the wild-type fusA gene and 3.6 kb for the Hygr disruption version (Fig. 6A), showed the occurrence of wild-type fusA genes in T5 and T7 and truncated fusA genes in T3, T4, and T6 (Fig. 6B), indicating that the latter have undergone the expected homologous recombination events. T3 and T4 exhibited a second band hybridizing with fusA, in addition to that from the disruption event, suggesting an additional ectopic integration of the cassette.
Fig 6.

(A) Map of the genomic wild-type fusA sequence showing the cloned PCR fragments, pksF1 and pksF2 (primers are represented by red arrows). Below is a map of ΔfusA genome after integration of the disruption construction. The probe for the Southern blot is indicated. At the bottom, domains present in FusA are indicated, and the shaded area represents the truncated protein expected in the mutants. Yellow boxes represent the fusA open reading frames. E, EcoRI. (B) Southern blot of genomic DNA of the wild-type and transformants T3 to T7 hybridized with the probe indicated in the upper panel. (C) Absorption spectra of samples extracted from colonies of the wild type and two representative ΔfusA mutants (T4 and T6) grown on minimal DG medium for 5 days at 30°C in darkness. The 350-nm absorption peak of fusarin is observed in the wild type but not in the mutants. The inset image shows the appearance of the colonies from the back of the petri dish. (D) Pigmentation of mycelia grown in DG liquid medium for 7 days in the dark at 30°C and 150 rpm. WT, wild type.
The T3, T4, and T6 disruption strains, referred to hereafter as ΔfusA mutants, were grown under different culture conditions for detailed phenotypic characterization. Mycelia of these three strains grown in high-N media, either in surface or submerged conditions, did not exhibit the characteristic orange pigmentation of the wild type (Fig. 6C and D). This must be attributed to the lack of fusarin accumulation, as indicated by the absence of the typical 350-nm absorption peak for these compounds (Fig. 6C). This result is consistent with the occurrence of a truncated PKS protein in the mutants containing only the β-ketoacyl synthase domain and a partial acyl-transferase domain (Fig. 6A). It is still possible that these mutants produce an intermediary compound through the activity of these domains. However, the lack of fusarins in the ΔfusA mutants strongly supports the view that the fusA gene identified in F. fujikuroi encodes the PKS-NRPS enzyme responsible for fusarin biosynthesis in this fungus.
Growth characteristics and virulence of ΔfusA mutants.
Mycelial development of the three ΔfusA mutants, measured as the radial growth of 7-day-old agar colonies on high-N medium, did not show significant differences with the wild-type strain, either at 22 or 30°C, under illumination or darkness. Also, no significant difference could be observed in these mutants compared to the control in colony morphology or in the number of conidia produced under the same culture conditions.
In order to test whether ΔfusA mutants are affected in virulence, we performed different assays. The capacity to penetrate a cellophane membrane on agar medium correlates with major virulence functions in F. oxysporum (21). Former observations showed that F. fujikuroi IMI58289 degraded cellophane covering DG agar (J. Avalos, unpublished). In our tests, FKMC1995 penetrated across the cellophane on DGasn agar and reached the agar surface after 5 days of incubation at 30°C. Unexpectedly, the ΔfusA mutants were unable to cross the cellophane discs after 9 days of growth (Fig. 7A), although some penetration could be observed after longer incubation periods. In these experiments the pigmentation due to fusarin secretion was quite noticeable in the wild-type cultures, but not in those of the ΔfusA mutants. The difference in the capacity to penetrate cellophane was also noticeable when the mycelia were removed from the cellophane sheet: while it was difficult to detach the wild-type mycelia from the cellophane surface, those of the ΔfusA mutants were readily separated (Fig. 7B and C). In F. oxysporum, the ability to cross cellophane membranes on agar cultures varied with the N sources: cellophane penetration was efficient in the presence of nitrate but not with ammonium (21), a result confirmed with other pathogenic fungi, such as F. oxysporum or the rice blast Magnaporthe oryzae (6). In our case, FKMC1995 exhibited a similar degrading ability on minimal agar supplemented either with asparagine or with NH4NO3 (results not shown).
Fig 7.
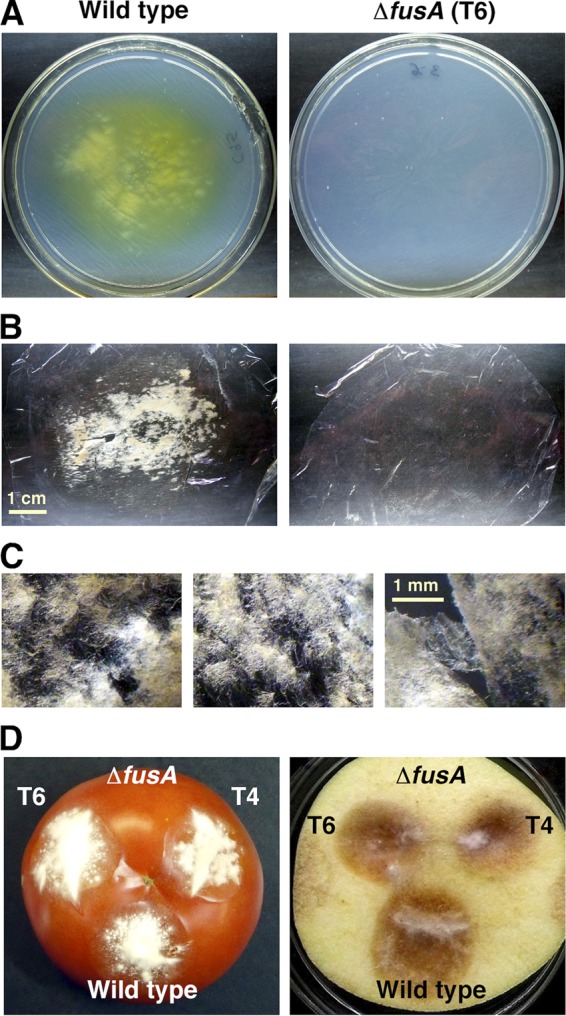
Invasive growth assays. (A to C) Cellophane penetration. Plugs of WT and ΔfusA mutants were inoculated onto plates with DGasn medium covered by a cellophane disc and grown for 9 days at 30°C in the dark. (A) Plates after removal of the cellophane membranes from plates of the wild type and the mutant T6. Similar results were obtained with other ΔfusA mutants tested. (B) Cellophane membranes after separation of wild-type (left) and T6 (right) mycelia. (C) Magnification of three different sectors with wild-type mycelia attached to the cellophane sheet. (D) Tomato fruits and apple slices were point-inoculated with 106 conidia of wild type and the ΔfusA mutants, T4 and T6, followed by incubation at 30°C for 10 or 7 days, respectively. Representative images are shown.
The biological function of fusarins remains unknown. These compounds might help the fungus to counteract competitor microorganisms or might play a role in the natural infection process. The correlation of cellophane degradation with pathogenicity on tomato plants by F. oxysporum (21) and the loss of this ability by F. fujikuroi ΔfusA mutants led us to carry out plant invasion tests with our strains. The ΔfusA mutants invaded two different classes of plant tissues in a similar way than the wild type (representative results in Fig. 7D), suggesting that fusarin production plays no role in this trait. Cellophane degradation should imply the activity of extracellular hydrolytic enzymes, such as cellulases. The phenotype of the ΔfusA mutants suggests that fusarin, or a fusarin degradation product, could play a regulatory role on the activity of cellulases or other hydrolytic enzymes, either on gene expression or enzymatic activity. A connection between cellulase induction and the expression of a cytochrome P450-monooxygenase gene involved in mycotoxin biosynthesis was found in Trichoderma reseei (29). The occurrence of regulatory relations between cellulase production and secondary metabolism has been poorly investigated; our results provide a new model system for future investigations of such regulatory relations.
ACKNOWLEDGMENTS
This research was supported by the European Union (European Regional Development Fund); the Spanish Government, projects BIO2003-01548 and BIO2006-01323 from Ministerio de Educación y Ciencia; and the Andalusian Government, project P07-CVI-02813. V.D.-S. was supported by a grant from Plan Propio of the University of Seville.
Footnotes
Published ahead of print 3 August 2012
REFERENCES
- 1. Avalos J, Casadesús J, Cerdá-Olmedo E. 1985. Gibberella fujikuroi mutants obtained with UV radiation and N-methyl-N′-nitro-N-nitrosoguanidine. Appl. Environ. Microbiol. 49:187–191 [DOI] [PMC free article] [PubMed] [Google Scholar]
- 2. Barrero AF, et al. 1991. Fusarin C and 8Z-fusarin C from Gibberella fujikuroi. Phytochemistry 30:2259–2263 [Google Scholar]
- 3. Brown DW, Butchko RA, Busman M, Proctor RH. 2012. Identification of gene clusters associated with fusaric acid, fusarin, and perithecial pigment production in Fusarium verticillioides. Fungal Genet. Biol. 49:521–532 [DOI] [PubMed] [Google Scholar]
- 4. Candau R, Avalos J, Cerdá-Olmedo E. 1992. Regulation of gibberellin biosynthesis in Gibberella fujikuroi. Plant Physiol. 100:1184–1188 [DOI] [PMC free article] [PubMed] [Google Scholar]
- 5. Cheng SJ, Jiang YZ, Li MH, Lo HZ. 1985. A mutagenic metabolite produced by Fusarium moniliforme isolated from Linxian county, China. Carcinogenesis 6:903–905 [DOI] [PubMed] [Google Scholar]
- 6. Collemare J, Billard A, Bohnert HU, Lebrun MH. 2008. Biosynthesis of secondary metabolites in the rice blast fungus Magnaporthe grisea: the role of hybrid PKS-NRPS in pathogenicity. Mycol. Res. 112:207–215 [DOI] [PubMed] [Google Scholar]
- 7. Demain AL, Fang A. 2000. The natural functions of secondary metabolites. Adv. Biochem. Eng. Biotechnol. 69:1–39 [DOI] [PubMed] [Google Scholar]
- 8. Desjardins AE. 2006. Fusarium mycotoxins: chemistry, genetics, and biology. APS Press, St. Paul, MN [Google Scholar]
- 9. Di Pietro A, García-Maceira FI, Meglecz E, Roncero MI. 2001. A MAP kinase of the vascular wilt fungus Fusarium oxysporum is essential for root penetration and pathogenesis. Mol. Microbiol. 39:1140–1152 [PubMed] [Google Scholar]
- 10. Estrada AF, Avalos J. 2009. Regulation and targeted mutation of opsA, coding for the NOP-1 opsin orthologue in Fusarium fujikuroi. J. Mol. Biol. 387:59–73 [DOI] [PubMed] [Google Scholar]
- 11. Estrada AF, Avalos J. 2008. The White Collar protein WcoA of Fusarium fujikuroi is not essential for photocarotenogenesis, but is involved in the regulation of secondary metabolism and conidiation. Fungal Genet. Biol. 45:705–718 [DOI] [PubMed] [Google Scholar]
- 12. Gaffoor I, et al. 2005. Functional analysis of the polyketide synthase genes in the filamentous fungus Gibberella zeae (anamorph Fusarium graminearum). Eukaryot. Cell 4:1926–1933 [DOI] [PMC free article] [PubMed] [Google Scholar]
- 13. Gelderblom WCA, et al. 1984. Natural occurrence of fusarin C, a mutagen produced by Fusarium moniliforme, in corn. J. Agric. Food Chem. 32:1064–1067 [Google Scholar]
- 14. Gelderblom WCA, Thiel PG, van der Merwe KJ, Marasas WFO, Spies HSC. 1983. A mutagen produced by Fusarium moniliforme. Toxicon 21:467–473 [DOI] [PubMed] [Google Scholar]
- 15. Giordano W, Domenech CE. 1999. Aeration affects acetate destination in Gibberella fujikuroi. FEMS Microbiol. Lett. 180:111–116 [DOI] [PubMed] [Google Scholar]
- 16. Jackson MA, Freer SN. 1991. The influence of carbon and nitrogen nutrition on fusarin C biosynthesis by Fusarium moniliforme. FEMS Microbiol. Lett. 82:323–328 [DOI] [PubMed] [Google Scholar]
- 17. Jackson MA, Slininger PJ, Bothast RJ. 1989. Effects of zinc, iron, cobalt, and manganese on Fusarium moniliforme NRRL 13616 growth and fusarin C biosynthesis in submerged cultures. Appl. Environ. Microbiol. 55:649–655 [DOI] [PMC free article] [PubMed] [Google Scholar]
- 18. Kleigrewe K, Sohnel AC, Humpf HU. 2011. A new high-performance liquid chromatography-tandem mass spectrometry method based on dispersive solid phase extraction for the determination of the mycotoxin fusarin C in corn ears and processed corn samples. J. Agric. Food Chem. 59:10470–10476 [DOI] [PubMed] [Google Scholar]
- 19. Limón MC, Rodríguez-Ortiz R, Avalos J. 2010. Bikaverin production and applications Appl. Microbiol. Biotechnol. 87:21–29 [DOI] [PubMed] [Google Scholar]
- 20. López-Berges MS, et al. 2009. Identification of virulence genes in Fusarium oxysporum f. sp. lycopersici by large-scale transposon tagging. Mol. Plant Pathol. 10:95–107 [DOI] [PMC free article] [PubMed] [Google Scholar]
- 21. López-Berges MS, Rispail N, Prados-Rosales RC, Di Pietro A. 2010. A nitrogen response pathway regulates virulence functions in Fusarium oxysporum via the protein kinase TOR and the bZIP protein MeaB. Plant Cell 22:2459–2475 [DOI] [PMC free article] [PubMed] [Google Scholar]
- 22. O'Donnell K, Cigelnik E, Niremberg HI. 1998. Molecular systematics and phylogeography of the Gibberella fujikuroi species complex. Mycologia 90:465–493 [Google Scholar]
- 23. Proctor RH, Hohn TM, McCormick SP. 1997. Restoration of wild-type virulence to Tri5 disruption mutants of Gibberella zeae via gene reversion and mutant complementation. Microbiology 143:2583–2591 [DOI] [PubMed] [Google Scholar]
- 24. Punt PJ, Oliver RP, Dingemanse MA, Pouwels PH, van den Hondel CA. 1987. Transformation of Aspergillus based on the hygromycin B resistance marker from Escherichia coli. Gene 56:117–124 [DOI] [PubMed] [Google Scholar]
- 25. Rees DO, et al. 2007. Synthesis of [1,2-13C2,15N]-l-homoserine and its incorporation by the PKS-NRPS system of Fusarium moniliforme into the mycotoxin fusarin C. Chembiochem 8:46–50 [DOI] [PubMed] [Google Scholar]
- 26. Rodríguez-Ortiz R, Limón MC, Avalos J. 2009. Regulation of carotenogenesis and secondary metabolism by nitrogen in wild-type Fusarium fujikuroi and carotenoid-overproducing mutants. Appl. Environ. Microbiol. 75:405–413 [DOI] [PMC free article] [PubMed] [Google Scholar]
- 27. Rodríguez-Ortiz R, Mehta BJ, Avalos J, Limón MC. 2010. Stimulation of bikaverin production by sucrose and by salt starvation in Fusarium fujikuroi. Appl. Microbiol. Biotechnol. 85:1991–2000 [DOI] [PubMed] [Google Scholar]
- 28. Sambrook J, Russell DW. 2001. Molecular cloning: a laboratory manual, 3rd ed Cold Spring Harbor Laboratory Press, New York, NY [Google Scholar]
- 29. Schmoll M, Zeilinger S, Mach RL, Kubicek CP. 2004. Cloning of genes expressed early during cellulase induction in Hypocrea jecorina by a rapid subtraction hybridization approach. Fungal Genet. Biol. 41:877–887 [DOI] [PubMed] [Google Scholar]
- 30. Shibata S, Morishita E, Takeda T, Sakata K. 1966. The structure of aurofusarin. Tetrahedron Lett. 7:4855–4860 [Google Scholar]
- 31. Smith S, Tsai SC. 2007. The type I fatty acid and polyketide synthases: a tale of two megasynthases. Nat. Prod. Rep. 24:1041–1072 [DOI] [PMC free article] [PubMed] [Google Scholar]
- 32. Song Z, Cox RJ, Lazarus CM, Simpson TJ. 2004. Fusarin C biosynthesis in Fusarium moniliforme and Fusarium venenatum. Chembiochem 5:1196–1203 [DOI] [PubMed] [Google Scholar]
- 33. Sorensen JL, et al. 2012. Production of novel fusarielins by ectopic activation of the polyketide synthase 9 cluster in Fusarium graminearum. Environ. Microbiol. 14:1159–1170 [DOI] [PubMed] [Google Scholar]
- 34. Staunton J, Weissman KJ. 2001. Polyketide biosynthesis: a millennium review. Nat. Prod. Rep. 18:380–416 [DOI] [PubMed] [Google Scholar]
- 35. Studt L, Wiemann P, Kleigrewe K, Humpf HU, Tudzynski B. 2012. Biosynthesis of fusarubins accounts for pigmentation of Fusarium fujikuroi perithecia. Appl. Environ. Microbiol. 78:4468–4480 [DOI] [PMC free article] [PubMed] [Google Scholar]
- 36. Tisch D, Schmoll M. 2010. Light regulation of metabolic pathways in fungi. Appl. Microbiol. Biotechnol. 85:1259–1277 [DOI] [PMC free article] [PubMed] [Google Scholar]
- 37. Tudzynski B. 2005. Gibberellin biosynthesis in fungi: genes, enzymes, evolution, and impact on biotechnology. Appl. Microbiol. Biotechnol. 66:597–611 [DOI] [PubMed] [Google Scholar]
- 38. Urry WH, Wehrmeister HL, Hodge EB, Hidy PH. 1966. The structure of zearalenone. Tetrahedron Lett. 7:3109–3114 [Google Scholar]
- 39. Weinkove D, et al. 1998. Mutants of Phycomyces with decreased gallic acid content. Fungal Genet. Biol. 25:196–203 [DOI] [PubMed] [Google Scholar]
- 40. Wiebe LA, Bjeldanes LF. 1981. Fusarin C, a mutagen from Fusarium moniliforme grown on corn. J. Food Sci. 46:1424–1426 [Google Scholar]
- 41. Wiemann P, et al. 2010. FfVel1 and FfLae1, components of a velvet-like complex in Fusarium fujikuroi, affect differentiation, secondary metabolism and virulence. Mol. Microbiol. 77:972–994 [DOI] [PMC free article] [PubMed] [Google Scholar]
- 42. Wiemann P, et al. 2009. Biosynthesis of the red pigment bikaverin in Fusarium fujikuroi: genes, their function, and regulation. Mol. Microbiol. 72:931–946 [DOI] [PubMed] [Google Scholar]