

Abstract
Rubella virus is the only member of the Rubivirus genus within the Togaviridae family and is the causative agent of the childhood disease known as rubella or German measles. Here, we report the use of cryo-electron tomography to examine the three-dimensional structure of rubella virions and compare their structure to that of Ross River virus, a togavirus belonging the genus Alphavirus. The ectodomains of the rubella virus glycoproteins, E1 and E2, are shown to be organized into extended rows of density, separated by 9 nm on the viral surface. We also show that the rubella virus nucleocapsid structure often forms a roughly spherical shell which lacks high density at its center. While many rubella virions are approximately spherical and have dimensions similar to that of the icosahedral Ross River virus, the present results indicate that rubella exhibits a large degree of pleomorphy. In addition, we used rotation function calculations and other analyses to show that approximately spherical rubella virions lack the icosahedral organization which characterizes Ross River and other alphaviruses. The present results indicate that the assembly mechanism of rubella virus, which has previously been shown to differ from that of the alphavirus assembly pathway, leads to an organization of the rubella virus structural proteins that is different from that of alphaviruses.
INTRODUCTION
The Rubivirus and Alphavirus genera, which together comprise the togavirus family, have a similar gene organization (12) and, according to previous electron microscopy studies (42), somewhat similar structural morphologies. Humans are the only known host for rubella virus, which is the only member of the Rubivirus genus (21). The virus is transmitted by aerosols emitted from the upper respiratory tract of infected individuals. In contrast, alphaviruses can infect various vertebrates, including humans, and are usually transmitted by arthropods (17). Rubella virus typically causes a mild childhood disease, sometimes called German measles, associated with a rash and low-grade fever. However, infections during the first trimester of pregnancy can cause a distinctive set of severe birth defects known as congenital rubella syndrome (46).
Whereas alphaviruses have T=4 icosahedral symmetry and an external diameter of about 70 nm (6, 32), rubella virions are somewhat pleomorphic and have a diameter that varies from about 55 to 90 nm (42). Like alphaviruses, rubella virions are enveloped and possess a nonsegmented, positive-sense, single-stranded RNA genome. The rubella virus genome has a 70% G+C content, the highest of all sequenced RNA viruses (13). Rubella virions enter cells via receptor-mediated endocytosis (33), and myelin oligodendrocyte glycoprotein has been identified as a cellular receptor (9).
The genomes of all togaviruses encode two polyproteins: one structural and one nonstructural. The togavirus nonstructural polyproteins are cleaved by viral proteases into the products necessary for viral replication (11, 18, 19, 31). The rubella virus and alphavirus structural polyproteins are each processed into three proteins: a capsid protein (C) and a pair of glycoproteins (E1 and E2). Although the rubella virus and alphavirus structural proteins share nomenclature and some degree of functional similarity, no significant sequence similarities have been detected (14). In alphavirus virions, all of the structural proteins adhere to T=4 icosahedral symmetry. The alphavirus glycoproteins are arranged into trimeric spikes formed by E1-E2 heterodimers, which make one-to-one associations with pentameric and hexameric clusters of capsid proteins across the lipid bilayer (6, 32). Little is known regarding the structure and organization of the rubella virus E1, E2, and capsid proteins.
The 58-kDa E1 and 42- to 54-kDa E2 rubella virus glycoproteins are both class I membrane proteins that, like the alphavirus glycoproteins, form heterodimers (5). Whereas E2 is more accessible than E1 for alphaviruses (32), rubella virus E2 is not readily accessible to glycosidases (25), trypsin (24), and monoclonal antibodies (44). Fusion activity has been attributed to the E1 glycoprotein (48) for rubella virus as well as the alphaviruses. The carboxy-terminal cytoplasmic tail of the rubella E2 is rich in arginine and is thought to interact with negatively charged amino acids of the capsid protein (15).
The 32-kDa rubella virus capsid protein, forms disulfide-linked homodimers (5, 45) and interacts with the genomic RNA through a basic N-terminal region (13) to form the nucleocapsid. Whereas the alphavirus capsid protein possesses autocatalytic activity in order to cleave itself from the structural polyprotein (2), the capsid protein of rubella virus requires a host cell signal peptidase for cleavage (8). As a result, the rubella virus capsid protein retains the E2 signal peptide and the nucleocapsids assemble in association with membranes (22, 40) during the process of virion budding into the Golgi complex (3, 4, 23, 43). In contrast, the alphavirus nucleocapsids assemble in the cytoplasm of infected cells and capsid interactions with the E1 and E2 glycoproteins drive the budding process at the plasma membrane (16).
We have used cryo-electron tomography to compare the structures of rubella and Ross River virions. Parallel rows of density at least 50 nm long, spaced 9 nm apart on the viral surface, are formed by the rubella virus glycoproteins, a feature inconsistent with icosahedral symmetry. The distance between symmetric repeats on an icosahedral virus of this size would need to be much smaller than the length of the observed rows. Unlike Ross River virus, the rubella virus genome is concentrated in a shell near the inner leaflet of the viral membrane. Rotation function analysis showed no indication of icosahedral symmetry for rubella virus.
MATERIALS AND METHODS
Virus propagation and purification.
The F-Therien strain of rubella virus was propagated in Vero cells using Dulbecco modified Eagle medium supplemented with 5% fetal bovine serum and 2 mM l-glutamine. Cells were infected at a multiplicity of infection of 0.1 to 0.5 and incubated for 2 days in a 35°C, 5% CO2 incubator. Cell culture supernatants were collected and clarified by centrifugation for 10 min at 6,400 × g. Polyethylene glycol (PEG) precipitation was performed by the addition of PEG 8000 to a final concentration of 8%. After stirring overnight at 4°C, precipitates were collected by centrifugation for 50 min at 16,000 × g. Pellets were resuspended in NTE buffer (0.02 M Tris, 0.12 M NaCl, 0.001 M EDTA [pH 8.0]), layered onto a 0 to 54% Opti-prep-NTE gradient, and centrifuged at 175,000 × g for 2 h. Fractions were collected and buffer exchanged into the NTE solution using a 100-kDa-molecular-mass cutoff Centricon. Ross River virus was propagated and purified as previously described (6).
Cryo-electron tomography and three-dimensional reconstruction.
Small aliquots (∼3.5 μl) of purified rubella or Ross River virus particles were mixed with bovine serum albumin-conjugated 10-nm gold particles (Aurion, Wageningen, Netherlands), applied to holey EM grids (R 2/2 Quantifoil; Micro Tools GmbH, Jena, Germany), and vitrified in liquid ethane. Virions were imaged under low-dose conditions at 120 kV with a Tecnai-12 electron microscope (FEI, Hillsboro, OR) equipped with a Gatan (Pleasanton, CA) energy filter (GIF 2002) or at 300 kV with an FEI Titan Krios microscope equipped with a Gatan Tridiem energy filter (GIF 863). Tilt series images for tomographic reconstructions were typically obtained over a range of ±66° at 1.5° or 2.0° intervals at a magnification of ×20,000 to ×40,000. The total electron dose for a particular tilt series was kept in the range of 50 to 150 electrons/Å2, as measured on the detector in the absence of a sample. Images were acquired at a defocus between 4 and 6 μm for the 120 kV instrument and near 7 μm underfocus for the 300 kV instrument. Pixels of the tilt series images were bin averaged to yield a final pixel size near 1.5 nm. Tilt-series images were aligned using the colloidal gold particles as fiducial markers and reconstructed using the weighted back-projection method as implemented in the IMOD software package (29). The tomographic reconstructions were low-pass filtered to a resolution of 4.5 nm. The resultant map was of sufficient quality to be able to resolve 9-nm separated spikes on the viral surface. Thus, the in-plane resolution of the map was at best 4.5 nm and certainly better than 9 nm. For display purposes, volumes were denoised with a bilateral filter as implemented in EMAN (26).
Phased self-rotation function analysis.
Subtomographic volumes corresponding to Ross River and rubella virions were extracted from the reconstructions using the IMOD trimvol command (29). Using the EMAN proc3d module (30), the subtomographic volumes were centered according to the center of mass of the map. Pixels beyond a radius of 50 nm were set to the averaged density for the map by application of a spherical mask. The maps were then Fourier transformed using the sfall program in the CCP4 suite (1). The structure factors were used to calculate phased self-rotation functions for κ = 72°, 120°, and 180° with the program GLRF (41). The polar angles ψ and φ were searched in 3° increments over the 0° to 180° range. The radius of integration was chosen to be 50.0 nm, and the calculations included only information in the 5.0- to 10.0-nm resolution range.
Icosahedral averaging procedures.
The rubella and Ross River subtomograms were placed into a standard orientation by searching for the set of Eulerian angles that gave the maximum real-space correlation coefficient between the subtomogram and a 60-fold symmetrized subtomogram (see Results and Discussion, “Orientation search enforcing icosahedral symmetry”).
The extracted subtomograms were translated and rotated using the proc3d module in the EMAN package (30), and the icosahedral symmetry was applied using the EMAN standard orientation, with a 5-fold symmetry axis along the z-axis, and the y axis along an icosahedral 2-fold symmetry axis. The correlation coefficient between the symmetrized and nonsymmetrized map was calculated in real space using the AVE program (27) in the Uppsala Software Factory (28) package. The Uppsala Software Factory program MAMA was used to generate spherical masks, which defined the volume over which the correlation coefficient was calculated. The symmetrized maps were inspected using the Chimera visualization tool (34).
Examination of parallel glycoprotein structures.
Tomographic x-y sections tangential to the rubella virion surface were examined. Three consecutive planes of voxels, representing a thickness of ∼4.5 nm, were averaged to reduce noise. The separation of high density features resulting from the organization of the E1-E2 glycoproteins into rows, could then be measured directly or through Fourier inversion. The IMOD (29) graph function was used to plot the variations in density height across the glycoprotein rows. IMOD and the program ROBEM (47) were used for two-dimensional Fourier analysis of tomographic sections.
Calculation of radial density distributions and analysis of nucleocapsid volumes.
Radial density distributions were calculated using the bradial function in the BSOFT package (20). In order to generate radial density distribution plots with reduced noise levels, the Ross River and rubella radial density distributions were calculated from an average of five virions. The virions were centered using the procedure described in Results and Discussion (“Orientation search enforcing icosahedral symmetry”).
The mass of the Ross River and rubella virus RNA genomes were estimated from their respective RNA sequences using the EnCor molecular weight calculator (Encorbio Molecular Weight Calculator [www.encorbio.com/protocols/Nuc-MW.htm]).
RESULTS AND DISCUSSION
Morphological description of rubella virions.
Tomographic reconstructions of rubella virus showed that the virions are variable in shape (Fig. 1A). About half of the virions were approximately round with diameters varying between 57 and 86 nm (Fig. 1B), although the majority of spherical virions have a diameter near 70 nm, approximately the same as Ross River virus. The distribution of diameters is approximately normal about a single central peak, suggesting that the polymorphic nature of the rubella virions is not due to variations in quasi-symmetry or T number, as has been reported for some icosahedral viruses and bacteriophage (7, 10, 49). The nonspherical virions included nearly cylindrical elongated virions which can be as long as 150 nm (Fig. 1A, inset), as well as tear-drop-shaped virus particles (Fig. 1A, white arrow). The rubella virions described here had been purified by density gradient procedures similar to those used for Ross River virus (see Materials and Methods). In order to alleviate forces on the particles, minor modifications of the purification process were tested, including replacing the PEG precipitation step with a membrane filtration procedure. These did not significantly alter the polymorphic nature of the virions. Similarly, chemical cross-linking of surface exposed proteins after the initial clarification step did not improve the homogeneity of the particles. Nevertheless, it is possible that rubella virus is more fragile than Ross River virus and more susceptible to morphological changes during purification.
Fig 1.
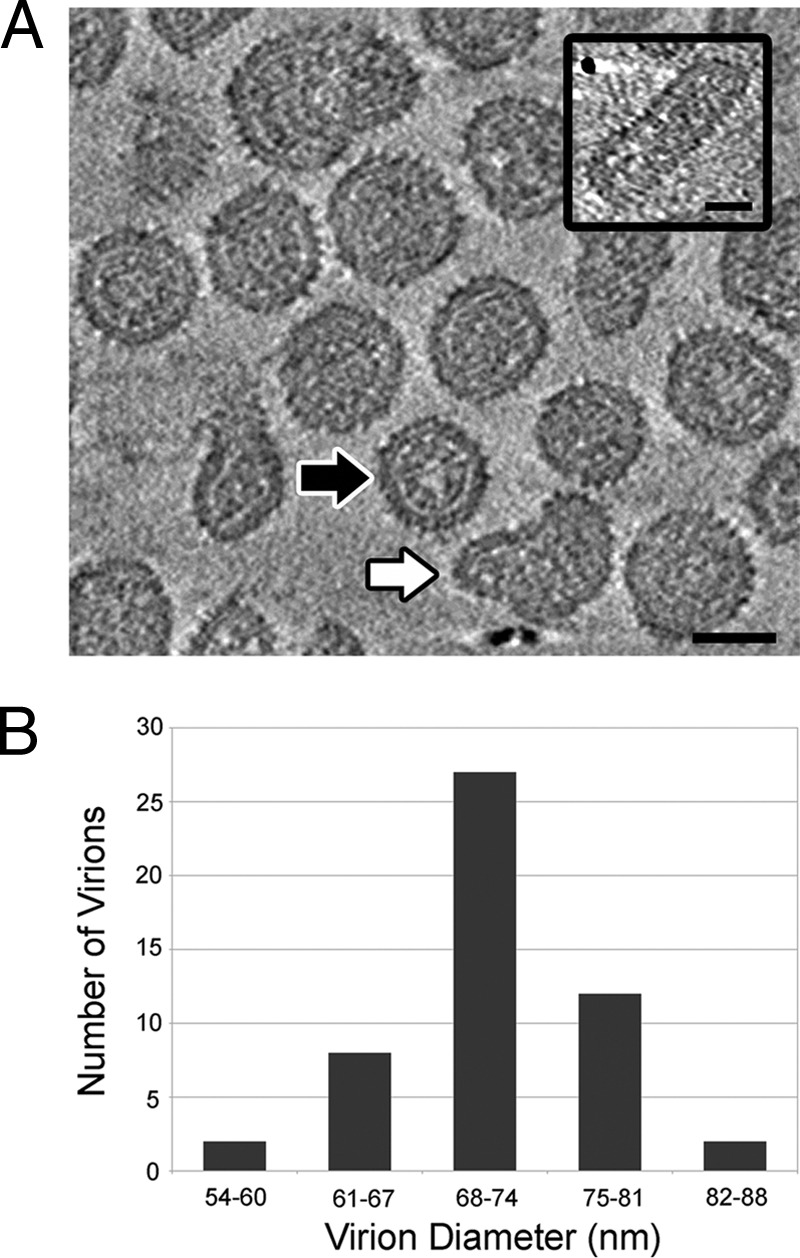
Pleomorphic nature of rubella virus. (A) A tomographic reconstruction showing the cross-section of several rubella virions near their center. The virions are variable in size and shape. The black arrow indicates an approximately spherical virion and the white arrow indicates a tear-drop-shaped virion. A nearly cylindrical virion is also shown (inset right). The images were generated by averaging four planes of voxels and represent a thickness of 6.0 nm. High density is black, and the scale bar represents 50 nm. (B) The diameters of 51 spherical virions range from 57 to 86 nm and follow a normal distribution, with the largest fraction of virions having a diameter close to 70 nm.
Tomographic sections and radially averaged density distributions (Fig. 2A, left, and Fig. 2B, solid line) of individual subtomograms show that the spherical rubella virions consist of two concentric density shells. There is a well-defined region of low density between the inner and outer shells (Fig. 2B, black diamond). A similar gap can be seen between the membrane and genomic RNA of reconstructed alphaviruses (6, 32) (Fig. 2A, right, and Fig. 2B, white diamond). The present tomographic data indicate that this gap is centered at a radius of about 25 nm for rubella virus and about 18 nm for Ross River virus. For the alphaviruses, this radius of low density corresponds to the location of the icosahedral capsid protein shell. The formation of hexamers and pentamers leaves space between the capsid proteins at this radius, giving the appearance of a gap in the averaged density.
Fig 2.
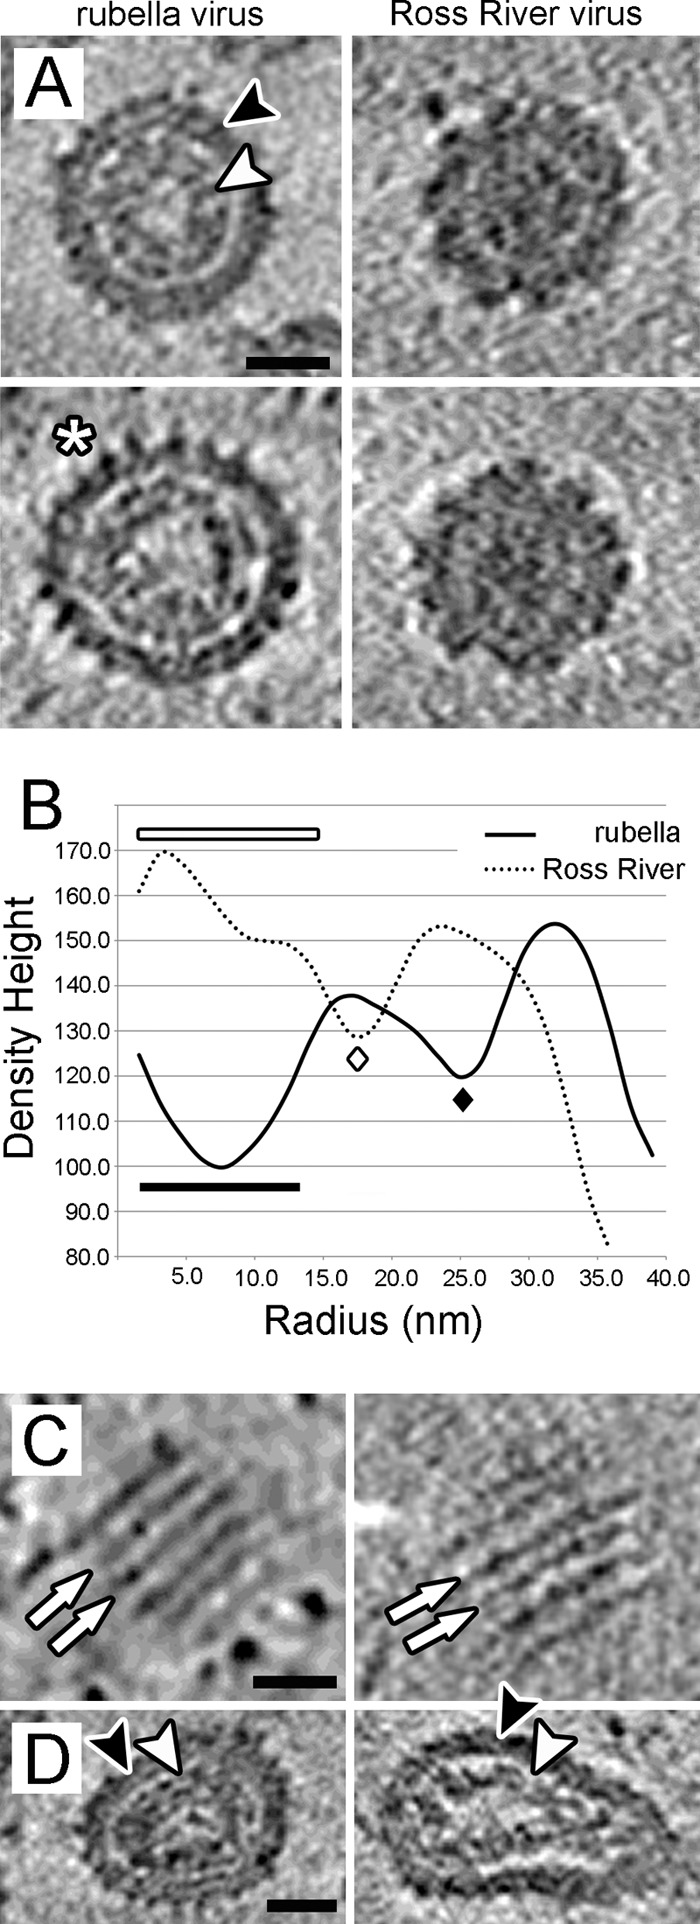
Morphological characteristics. (A) Central sections through two spherical rubella (left panels) and two Ross River (right panels) virions. The black arrowhead indicates an outer shell of density for rubella virus, presumed to consist of the viral membrane with embedded E1 and E2 glycoproteins. The white asterisk indicates spike structures that extend up to 8 nm from the virion surface. The inner shell of density, or nucleocapsid, is indicated by the white arrowhead. The images were generated by averaging three planes of voxels and represent a thickness of 4.5 nm. High density is black, and the scale bar represents 25 nm. (B) Radial density distributions were calculated for the rubella and Ross River virus data. The solid curve represents an average of five spherical rubella virions with a diameter close to 70 nm. The dotted curve represents an average of five Ross River virions. The Ross River data shows a high and continuous density from the virion center out to a radius of about 15 nm (white bar), whereas a region of low density extends from the rubella virion center to the ∼14-nm inner radius of the nucleocapsid structure (black bar). Both rubella and Ross River virions have a gap, or region of low density, between the nucleocapsid and membrane. This gap is located at a radius of about 25 nm for rubella virus (black diamond), and about 18 nm for Ross River virus (white diamond). Densities were scaled such that the rubella and Ross River glycoprotein (outer shell) features would have equivalent density height. The standard errors in the density measurements were about 6 arbitrary units for the Ross River virus data and about 8 arbitrary units for the rubella virus data. The measurements were made with the same charge-coupled device detector at the same magnification. (C) Tomographic sections tangential to the surface of spherical rubella virions show parallel rows of E1-E2 glycoprotein spikes separated by 9.0 nm. The white arrows indicate pairs of equi-spaced rows of spikes. The spike structures are orthogonal to the plane of the page. Images were generated by averaging three planes of voxels and represent a thickness of 4.5 nm. High density is black, and the scale bar represents 25 nm. (D) Central sections through a pair of nonspherical rubella virions. The viral envelope and closely apposed nucleocapsid density are indicated by the black and white arrowheads, respectively. The images were generated by averaging three planes of voxels and represent a thickness of 4.5 nm. High density is black, and the scale bar represents 25 nm.
The outer shell of density for the spherical rubella virions is located between radii of about 27 and 36 nm (Fig. 2A, black arrow). By comparison with alphaviruses, this outer layer consists of the viral membrane and E1-E2 glycoproteins. The rubella glycoproteins formed spikes which extended on occasion up to ∼8 nm from the ∼4-nm-thick membrane (Fig. 2A, white asterisk), although mostly the spikes are only 5 nm long, suggesting that the E1-E2 glycoproteins exist in multiple conformations. On averaging the longer spikes with the shorter spikes, the radially averaged thickness of the outer shell of density appears to be only 9 nm for rubella virus. The membrane and glycoprotein ectodomains of Ross River virus are located between radii of about 20 and 34 nm (Fig. 2A, right, and 2B, dotted line), a finding consistent with previous results (6), indicating a 4-nm-thick viral membrane and E2 glycoproteins that extend 9.5 nm from the membrane. The rubella virus membrane is located at a slightly larger average radius than that of Ross River, although the exact position of the lipid bilayers could not be determined with certainty at the resolution of the cryo-tomography data. In tomographic sections tangential to the virion surface the rubella virus envelope glycoproteins, E1 and E2, form parallel rows on the virion surface separated by 9 nm (Fig. 2C), a feature not seen for Ross River virus. These features were especially obvious for the elongated rubella virions and were occasionally seen for the nearly spherical rubella virions.
A 6-nm-thick inner shell of high density, located between the radii of 14 and 20 nm for spherical rubella virions, was interpreted as the nucleocapsid structure (Fig. 2A, white arrow). A region of low density extends from the rubella virion center to the 14-nm inner radius of the nucleocapsid structure (Fig. 2B, black bar). In contrast, the Ross River subtomograms show a high and continuous density from their centers out to a radius of about 15 nm (Fig. 2A, right, and 2B, white bar), which is consistent with previous alphavirus reconstructions (6, 32).
It has been shown (36) that homogeneously dense immature rubella particles can coexist with mature particles that are less dense at their centers. The less-dense, mature virions were also observed in the supernatant of the infected cells. The low density at the particle center described in our study might correspond to the mature virions described by Risco et al. (36). It is possible that the maturation step results in the loss of an initial symmetric organization of the envelope proteins acquired during budding.
Like rubella virus, porcine respiratory and reproductive syncytial virus (PRRSV), a positive-sense, single-stranded RNA virus in the family Arteriviridae, has a genome that is packaged into a thin shell of density. It has been suggested that the PRRSV capsid protein forms a layer on both the interior and exterior of the viral RNA, leaving a region of low density at the virion center (39).
Although the virion shape is variable, the density profile in the direction normal to the viral membrane is approximately the same for all virions. Regardless of virion shape, a 6-nm-thick layer of high density within the virion envelope can be presumed to be the nucleocapsid and follows the contour of the lipid bilayer (Fig. 2D). This is in agreement with previous data which had shown that the capsid protein is not cleaved from the hydrophobic signal sequence linking the capsid protein to E2 and therefore remains membrane associated (22, 40). Whereas the alphavirus capsid proteins consistently form T=4 icosahedral structures (6, 32), the interactions between neighboring rubella capsid proteins are variable as a result of the capsid protein's attachment to the flexible membrane.
Rotation function analysis.
Seventy-one rubella virion subtomograms, which were approximately spherical with a diameter of about 70 nm, were searched for the presence of icosahedral symmetry using phased self-rotation functions (see Appendix, “Phased rotation functions”). As a positive control, five Ross River subtomograms imaged under similar conditions were analyzed in the same way. The subtomograms were computationally extracted into cubic boxes and then converted to structure factors by Fourier transformation. The center of the subtomogram was initially assumed to be at the center of mass in the defined box. The program GLRF (41) was used to calculate phased self-rotation functions to search for the presence of 5-fold, 3-fold, and 2-fold symmetry, using data in the 5.0- to 10.0-nm resolution range. For the Ross River virus subtomograms, the phased rotation function results showed 5-fold (Fig. 3A), 3-fold, and 2-fold peaks consistent with icosahedral symmetry. The heights of the 3-fold and 5-fold peaks were as great as 7.0 standard deviations above the mean. However, no dominant peaks that could be related by icosahedral symmetry were found for any of the rubella virus subtomograms (Fig. 3B).
Fig 3.
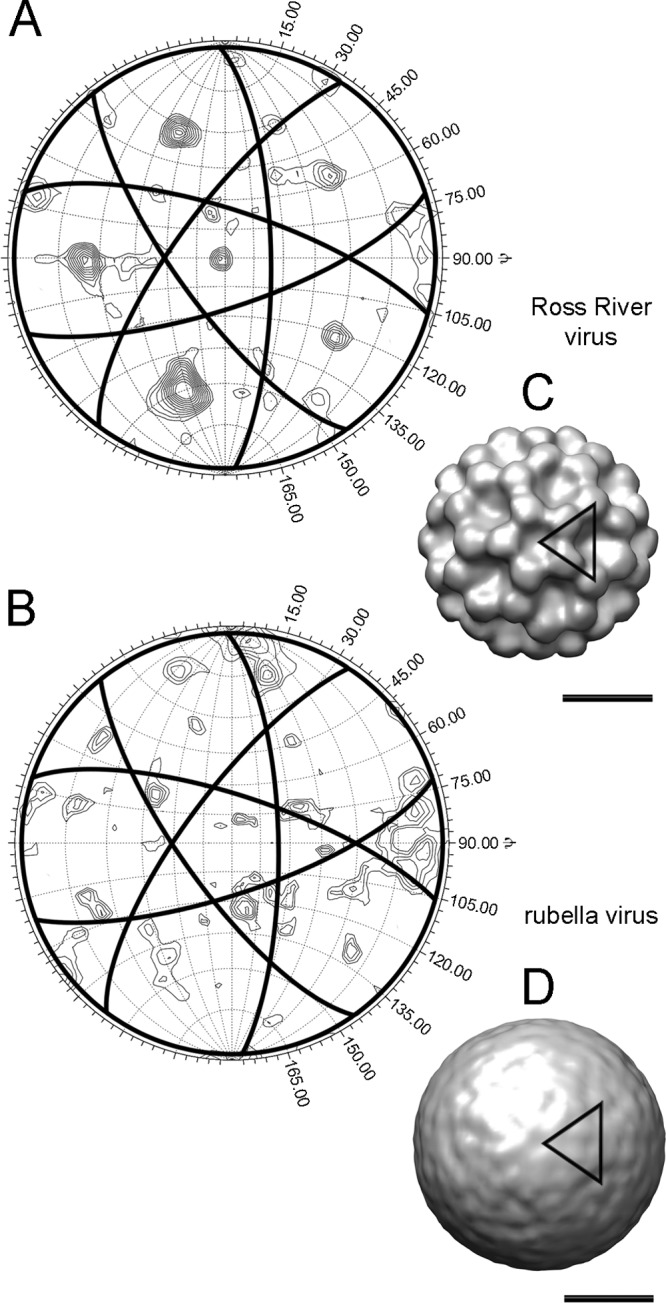
Phased self-rotation function search for 5-fold symmetry. (A) Stereographic projection of the κ = 72° phased self-rotation function search plotted as a function of ψ and φ for a Ross River virus subtomogram. (B) The results of an equivalent search for a rubella virus subtomogram. The virion subtomograms were placed in the most probable standard orientation using the methods described (see Results and Discussion, “Orientation search enforcing icosahedral symmetry”). The great circles meet at the locations of the icosahedral 2-folds and form pentagonal outlines centered at ψ and φ values that coincide with the 5-fold vertices. Values of ψ are indicated on the plot and the longitudinal demarcations represent 15° increments in φ. The contours are drawn in 0.5 standard deviation increments starting from 1.0. (C) The map (ρh, icos) generated by enforcement of icosahedral symmetry for the Ross River virus subtomogram evaluated in A. (D) Map generated by the enforcement of icosahedral symmetry for the rubella virus subtomogram evaluated in panel B. The black triangles indicate the icosahedral asymmetric unit, and the scale bars represent 25 nm. Maps are shown at 2.0 standard deviations above the mean density height.
Orientation search enforcing icosahedral symmetry.
In the absence of any obvious 5-3-2 symmetry for rubella virus using rotation function calculations, a more powerful technique was developed to probe the spherical rubella virions for possible icosahedral symmetry (see Appendix, “Icosahedral orientation search”). The procedure averages the tomographic density assuming icosahedral (5-3-2) symmetry operators. If the orientations of the assumed symmetry operators are consistent with the actual symmetry in the original unaveraged virion subtomogram, then the correlation of the unaveraged map with the icosahedral averaged map should be at a maximum. If the assumed icosahedral symmetry is inconsistent with the symmetry of the virion subtomogram, either because the orientation is incorrect or because the subtomogram lacks this symmetry altogether, a low correlation score will result when comparing the symmetrized and nonsymmetrized maps. In this procedure, the effect of the missing wedge is mitigated by spreading the effect equally over all regions of the tomogram.
A pseudo-six-dimensional search was carried out to determine the rotations and translations which put a particular subtomogram (ρp) into register with the standard icosahedral symmetry axes. The rotated and translated map (ρh) was symmetrized such that the 5-fold, 3-fold, and 2-fold axes were enforced in the standard orientation. The goal of the search was to maximize the correlation coefficient between the rotated and translated subtomogram (ρh) and the symmetrized map (ρh, icos). For each virion subtomogram, three correlation coefficients (CCwhole, CCext, and CCcore) were calculated (Table 1), where CCwhole is the correlation coefficient between ρh and ρh, icos calculated over the volume of an entire virion and CCext and CCcore are the correlation coefficients calculated between the ρh andρh,icos external glycoprotein and internal nucleocapsid regions, respectively. The significance (hmax) of the top rotation solutions was evaluated by determining the number of standard deviations that the highest correlation coefficients stood out above the average correlation coefficient (see Appendix, “Determining the icosahedral nature of each subtomogram”). Large hmax values indicate a strong agreement of the tomogram data with the enforced icosahedral symmetry.
Table 1.
Analysis of correlation coefficients
| Source | No. of particles examined | Annular range for CC (nm) | Mean CC for peak solutions | Mean CC | Mean SD | hmax range; mean (ht/σ) |
|---|---|---|---|---|---|---|
| Rubella virion (CCwhole) | 71 | 0–50 | 0.454 | 0.446 | 0.00381 | 1.12–4.26; 2.06 |
| Rubella glycoprotein (CCext) | 15 | 28–50 | 0.352 | 0.339 | 0.00399 | 1.22–2.68; 1.78 |
| Rubella nucleocapsid (CCcore) | 15 | 0–28 | 0.264 | 0.232 | 0.00614 | 3.35–5.68; 4.26 |
| Ross River virion (CCwhole) | 5 | 0–50 | 0.527 | 0.473 | 0.00534 | 9.03–11.91; 10.06 |
| Ross River glycoprotein (CCext) | 5 | 20–50 | 0.517 | 0.457 | 0.00559 | 9.35–12.25; 10.45 |
| Ross River nucleocapsid (CCcore) | 5 | 0–20 | 0.315 | 0.278 | 0.00890 | 4.12–7.15; 5.16 |
The hmax values regarding CCwhole and CCext for the Ross River virions were well above the average correlation value, ranging from 9.0 to 12.2 standard deviations above the mean. For rubella virus, the hmax values associated with the CCwhole and CCext correlation scores ranged from only 1.1 to 4.8. For any of the five Ross River virions evaluated, the Eulerian angles associated with the maximum values of CCwhole and the maximum values of CCext were in agreement. For the rubella virus data, the Eulerian angles associated with the maximum CCwhole and CCext of a particular virus particle were not in agreement.
The hmax values of the CCcore calculations for the Ross River virions ranged from 4.1 to 7.1. The hmax values regarding CCcore for the rubella virus data were similar and ranged from 2.7 to 5.4. In neither case did the maximum CCcore values stand out above the background and were typically associated with Eulerian angles that did not match the CCwhole or CCext results. The inconsistent results regarding the nucleocapsid structure of Ross River virus may be due to the limited resolution or anisotropy of the tomographic data.
The symmetrized ρh, icos maps which generated the highest correlation score with the nonsymmetrized ρh density for a given subtomogram were visually inspected using Chimera (34). The Ross River virus data, oriented with respect to the whole virions or external glycoprotein regions, generated ρh, icos maps with prominent E1-E2 glycoprotein spikes which were consistent with T=4 quasi-symmetry in all cases (Fig. 3C). Although the rubella virus E1-E2 glycoproteins spikes were obvious in the tomographic data, the surfaces of the rubella virus 5-3-2 symmetrized ρh, icos maps were comparatively flat and featureless (Fig. 3D). Previous single-particle reconstructions have shown that the Ross River virus capsid protein forms a T=4 icosahedral structure in register with the symmetric arrangement of the E1-E2 glycoproteins, but symmetrization of the Ross River nucleocapsid density from tomograms did not consistently produce a T=4 structure, likely due to the inability to resolve capsid features. Similarly, symmetrization of the rubella virus nucleocapsid densities, produced variable results which showed no evidence of quasi-symmetry.
The low hmax values and featureless ρh, icos maps, resulting from the maximization of CCwhole and CCext, indicate a lack of icosahedral symmetry for the spherical rubella virions. The arrangement of the glycoproteins into extended rows of high density is likely to be inconsistent with icosahedral symmetry and explains the present results.
The rubella virus E1-E2 structure.
The tomographic data showed rows of density on the rubella virion surface, formed by the glycoprotein spikes which extend up to ∼8 nm from the membrane. The separation between rows was consistently measured to be a distance of 9 nm. A separation of approximately 4 to 6 nm was sometimes seen for glycoprotein subunits along the rows. The organization of the rubella virus E1-E2 glycoproteins into parallel rows is in contrast with that of the Ross River virus glycoproteins, which are organized into discrete trimeric spikes separated by 11 nm (6, 32).
In some cases, several parallel rows of density were seen on elongated rubella virions (Fig. 4A). The rows typically run in the direction orthogonal to the long axis of the elongated virions, generating several units of repeating structure which are roughly in the same plane. Tomographic sections tangential to the surfaces of the elongated rubella virions were examined and the density height across the repeating E1-E2 rows was plotted. The spaces between rows alternate between higher and lower density (Fig. 4B), indicating that the rows are paired and that the two halves of a pair are more strongly connected than the adjacent unpaired rows. Two-dimensional Fourier analysis of these tomographic sections showed first- and second-order Fourier amplitude peaks corresponding to 9- and 18-nm spacing between rows and pairs of rows. However, no large Fourier amplitudes were seen in the orthogonal direction. In addition, there were no large Fourier peaks in a one-dimensional Fourier analysis of the density along individual rows, indicating a lack of strict regularity for the glycoprotein subunits along the rows. Based on the present data, combined with previous results indicating that the rubella E1 is more accessible than E2 (24, 25, 44), a model for the organization of the rubella virus glycoproteins spikes was drawn (Fig. 4C). E2 might form the connections between the alternating pairs of rows, where it would be somewhat covered by the E1 spikes.
Fig 4.
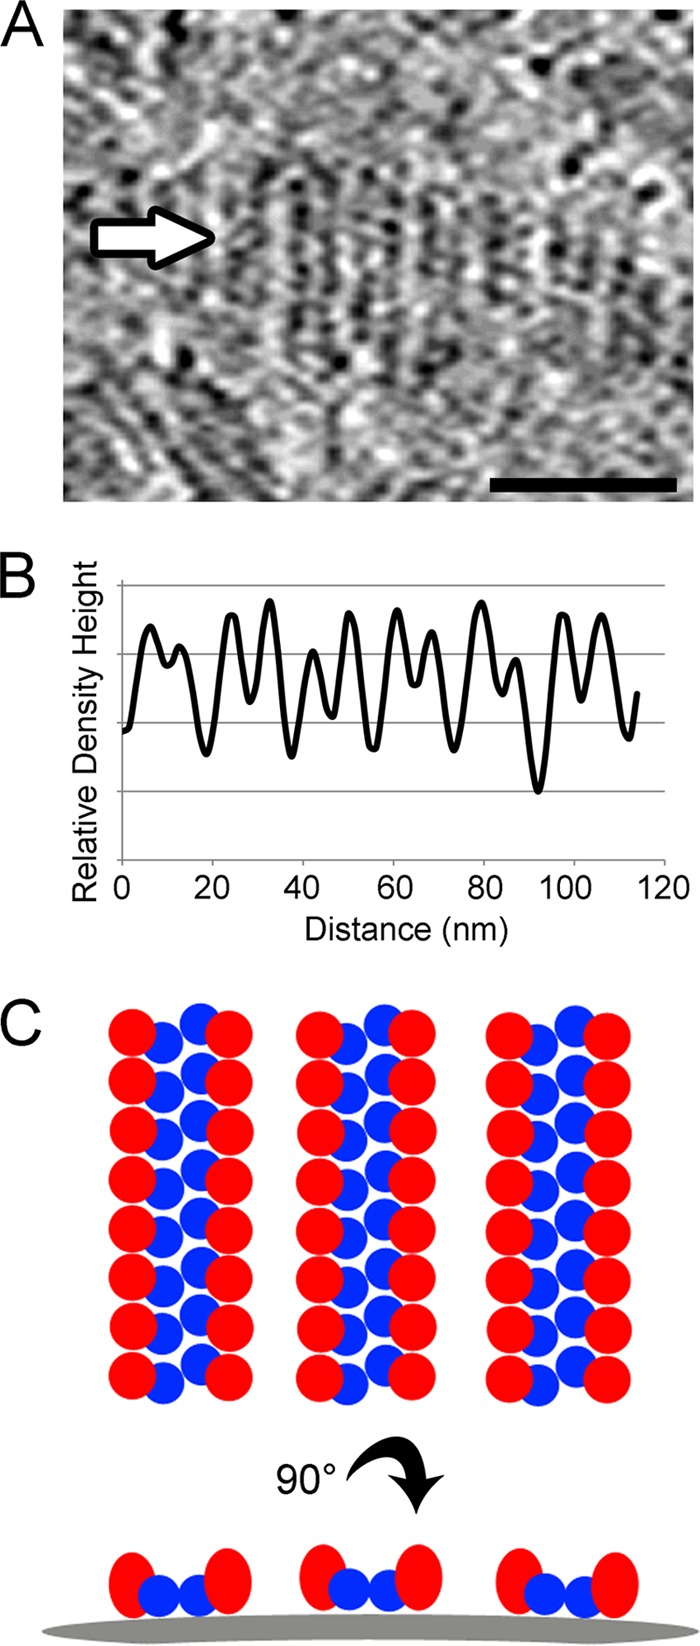
Analysis and interpretation of E1-E2 glycoprotein spikes. (A) Tomographic section tangential to the membrane of an elongated virion showing several parallel rows of glycoprotein structure orthogonal to the long axis of the virion. The density was scanned along a line in the direction of the white arrow, parallel to the length of the virion. The scale bar represents 50 nm, and high density is black. (B) The density height measured across the repeating glycoprotein structure shows a regular 9.0-nm repeat. The spaces between rows alternate between higher and lower density height, indicating that rows of glycoprotein spikes are paired. The two halves of a pair are more strongly connected than the adjacent unpaired rows. (C) Model depicting a possible organization of E1 (red ellipsoids) and E2 (blue spheres). E2 may link paired rows of the more accessible E1 spikes. The top and bottom panels represent orthogonal views, and the curved gray bar represents the viral membrane.
The difference between the morphology of rubella virus, as presented here, and alphaviruses will impact the manner in which these viruses recognize a host and transmit their genome. It is perhaps significant that rubella virus only infects humans by respiratory aerosols, whereas alphaviruses can infect a variety of vertebrates and invertebrates.
Rubella virus nucleocapsid structure.
The average concentration of the RNA genome in simple plus-stranded RNA viruses is typically about 500 mg/cm3 (35). Assuming that the RNA genome of Ross River virus is entirely contained within a radius of 15 nm, the concentration of the RNA was estimated to be about 435 mg/cm3, which is consistent with the above value. Assuming the concentration of RNA in rubella virus is similar to that of Ross River virus and other plus-stranded RNA viruses, and since the mass of the rubella virus genome is 2,800 kDa, the volume occupied by the rubella virus genome would be ∼11,000 nm3. This accounts for only about half of the volume occupied by the 14- to 20-nm inner shell of density seen in the spherical rubella virus subtomograms. Thus, assuming a 1.35-g/cm3 density for the 32-kDa capsid protein, there is space for about 300 monomers or 150 disulfide-linked capsid protein dimers in the nucleocapsid shell.
The number of capsid proteins in a spherical rubella virion was alternatively estimated by recognizing that the rubella capsid protein is not cleaved from the preceding signal sequence in the polyprotein. Thus, the capsid proteins must line the inside of the viral membrane and the maximum number of capsid proteins in a virion would be the number of proteins that could form a hexagonally closed packed array on the inside surface of the viral membrane. Assuming a globular structure and protein density of 1.35 g/cm3, the 64-kDa capsid dimer would have a radius of ∼2.5 nm. Hence, the number of capsid protein dimers that can line the inside of the rubella viral membrane at a radius of 20 nm would be about 230, which is consistent with the previous estimate.
ACKNOWLEDGMENTS
We thank Wen Jiang and Anastasia A. Aksyuk for their helpful suggestions throughout the course of this project. In addition, we are indebted to Paul R. Chipman, Valorie D. Bowman, and Agustin Avila-Sakar for their assistance with the electron microscopy. We also thank Sheryl Kelly for help in the preparation of the manuscript. We thank one of the anonymous reviewers for pointing out the possible significance to our results of the study by Risco et al. (36).
We acknowledge support provided by National Institutes of Health (NIH) grants AI095366 to M.G.R. and AI21389 to T.K.F. and by NIH/General Medicine for the Biophysics training grant T32 GM008296-20 in support of A.J.B. (C.V. Stauffacher, P.I.). Support to M.G.R. was also provided by the National Science Foundation (MCB-1014547) for technical developments. A.C.S. was supported in part by the Intramural Research Program of the National Institute of Arthritis, Musculoskeletal, and Skin Diseases.
We declare we have no conflict of interest.
APPENDIX
Phased rotation functions.
Rotation functions (37, 41) are used in crystallographic analyses to determine the angle of rotation between two similar objects. Since phases cannot be recorded for diffraction data, the comparison is made between Patterson functions. The similarity between the “self-vectors” in each Patterson is measured by superimposing the origin of the functions and searching for the combination of angles that give a good match between the two functions. When comparing reconstructed volumes from electron tomography, phases are known and can be included in the calculation of a “phased rotation function.” Therefore, instead of comparing Patterson functions, phased rotation functions compare the rotated electron density maps. However, phased rotation functions require knowledge of the equivalent origin position in each phased image. This can be found by determining the center of mass of each subtomogram or by conducting a six-dimensional search of three positional and three rotational parameters.
Icosahedral orientation search.
The averaging procedure was implemented by defining the orientation of the icosahedral symmetry axes with respect to a Cartesian axial system (X1, X2, X3) defined in the “h-cell”. The initial subtomogram axial set (Y1, Y2, Y3) was defined with respect to the “p-cell”. This terminology is consistent with that used by Rossmann et al. (38). In order to place the p-cell density (ρp) into the h-cell, a rotation and translation operation was applied, given by:
| (1) |
where [E] is a 3 × 3 rotation matrix that can be defined by Eulerian or polar coordinates and d is a translation vector. The vector d can be determined by assuming that origin of the h-cell is the point of intersection of the assumed symmetry operators in the h-cell (X = 0), and S is the symmetry center of the subtomogram density in the p-cell, initially assumed to be the center of mass of the density in the defined box. Thus, by substituting X = 0 and Y = S into equation 1, we obtain: 0 = [E]S + d. Therefore,
| (2) |
Thus, from equations 1 and 2:
| (3) |
The rotation matrix [E] was determined, and the translational component S was refined through a pseudo-six-dimensional search, the goal of which was to maximize the correlation coefficient, CC, between the symmetrized (ρh, icos) and nonsymmetrized (ρh) maps in the h-cell, given by:
| (4) |
An initial translation search proceeded by stepping through all possible x,y,z combinations over a 7 × 7 × 7 pixel box in 1-pixel increments without any a priori knowledge of the rotational relationship between the assumed symmetry operators and virion symmetry. For this initial translation search, the rotation matrix [E] was assumed to be the unit matrix, and the center point of the search volume represented the center of mass of ρh.
The calculations then proceed by stepping through all Eulerian angles from 0° to 92° in 4° increments. This range ensured that at least one icosahedral asymmetric unit was covered in increments sufficient to sample a 35-nm radius virion to a resolution of 5.0 nm. For each set of rotation angles, the subtomogram density was transferred into the h-cell and averaged assuming icosahedral symmetry. The correlation could then be determined between ρh, icos and ρh. Upon finding the rotation matrix [E] that gives the highest correlation coefficient, the translational component was refined by searching for the optimum value of S in subpixel increments.
Determining the icosahedral nature of each subtomogram.
The height/σ or significance of the highest scoring solution (hmax) for each rotation search (CCwhole, CCext, and CCcore) was evaluated by calculating:
| (5) |
where rmax and ⟨r⟩ are the maximum and average CCwhole, CCext, or CCcore values, respectively, found during the Eulerian search for a specific subtomogram. The denominator represents the standard deviation (σ) of the correlation coefficient values, ri, among the N sets of Eulerian angles tested for the specific subtomogram. This calculation measures the significance of the maximum correlation score value associated with the “correct” orientation of the icosahedral symmetry operators relative to “incorrect” random orientations.
Footnotes
Published ahead of print 1 August 2012
REFERENCES
- 1. Agarwal RC. 1978. A new least-squares refinement technique based on the fast Fourier transform algorithm. Acta Crystallogr. Sect. A 34:791–809 [Google Scholar]
- 2. Aliperti G, Schlesinger MJ. 1978. Evidence for an autoprotease activity of Sindbis virus capsid protein. Virology 90:366–369 [DOI] [PubMed] [Google Scholar]
- 3. Bardeletti G, Gautheron DC. 1976. Phospholipid and cholesterol composition of rubella virus and its host cell BHK 21 grown in suspension cultures. Arch. Virol. 52:19–27 [DOI] [PubMed] [Google Scholar]
- 4. Bardeletti G, Tektoff J, Gautheron D. 1979. Rubella virus maturation and production in two host cell systems. Intervirology 11:97–103 [DOI] [PubMed] [Google Scholar]
- 5. Baron MD, Forsell K. 1991. Oligomerization of the structural proteins of rubella virus. Virology 185:811–819 [DOI] [PubMed] [Google Scholar]
- 6. Cheng RH, et al. 1995. Nucleocapsid and glycoprotein organization in an enveloped virus. Cell 80:621–630 [DOI] [PMC free article] [PubMed] [Google Scholar]
- 7. Choi KH, Morais MC, Anderson DL, Rossmann MG. 2006. Determinants of bacteriophage f29 head morphology. Structure 14:1723–1727 [DOI] [PubMed] [Google Scholar]
- 8. Clarke DM, Loo TW, Hui I, Chong P, Gillam S. 1987. Nucleotide sequence and in vitro expression of rubella virus 24S subgenomic messenger RNA encoding the structural proteins E1, E2, and C. Nucleic Acids Res. 15:3041–3057 [DOI] [PMC free article] [PubMed] [Google Scholar]
- 9. Cong H, Jiang Y, Tien P. 2011. Identification of the myelin oligodendrocyte glycoprotein as a cellular receptor for rubella virus. J. Virol. 85:11038–11047 [DOI] [PMC free article] [PubMed] [Google Scholar]
- 10. Crowther RA, et al. 1994. Three-dimensional structure of hepatitis B virus core particles determined by electron cryomicroscopy. Cell 77:943–950 [DOI] [PubMed] [Google Scholar]
- 11. Ding MX, Schlesinger MJ. 1989. Evidence that Sindbis virus NSP2 is an autoprotease which processes the virus nonstructural polyprotein. Virology 171:280–284 [DOI] [PubMed] [Google Scholar]
- 12. Dominguez G, Wang CY, Frey TK. 1990. Sequence of the genome RNA of rubella virus: evidence for genetic rearrangement during togavirus evolution. Virology 177:225–238 [DOI] [PMC free article] [PubMed] [Google Scholar]
- 13. Frey TK. 1994. Molecular biology of rubella virus. Adv. Virus Res. 44:69–160 [DOI] [PMC free article] [PubMed] [Google Scholar]
- 14. Frey TK, Marr LD. 1988. Sequence of the region coding for virion proteins C and E2 and the carboxy terminus of the nonstructural proteins of rubella virus: comparison with alphaviruses. Gene 62:85–99 [DOI] [PubMed] [Google Scholar]
- 15. Garbutt M, Law LM, Chan H, Hobman TC. 1999. Role of rubella virus glycoprotein domains in assembly of virus-like particles. J. Virol. 73:3524–3533 [DOI] [PMC free article] [PubMed] [Google Scholar]
- 16. Garoff H, Sjoberg M, Cheng RH. 2004. Budding of alphaviruses. Virus Res. 106:103–116 [DOI] [PubMed] [Google Scholar]
- 17. Griffin DE. 2007. Alphaviruses, p 1023–1067 In Knipe DM, Howley PM. (ed), Fields virology, 5th ed Lippincott/The Williams & Wilkins Co, Philadelphia, PA [Google Scholar]
- 18. Gros C, Wengler G. 1996. Identification of an RNA-stimulated NTPase in the predicted helicase sequence of the Rubella virus nonstructural polyprotein. Virology 217:367–372 [DOI] [PubMed] [Google Scholar]
- 19. Hardy WR, Strauss JH. 1989. Processing the nonstructural polyproteins of sindbis virus: nonstructural proteinase is in the C-terminal half of nsP2 and functions both in cis and in trans. J. Virol. 63:4653–4664 [DOI] [PMC free article] [PubMed] [Google Scholar]
- 20. Heymann JB. 2001. Bsoft: image and molecular processing in electron microscopy. J. Struct. Biol. 133:156–169 [DOI] [PubMed] [Google Scholar]
- 21. Hobman TC, Chantler J. 2007. Rubella virus, p 1069–1100 In Knipe DM, Howley PM. (ed), Fields virology, 5th ed Lippincott/The Williams & Wilkins Co, Philadelphia, PA [Google Scholar]
- 22. Hobman TC, Gillam S. 1989. In vitro and in vivo expression of rubella virus glycoprotein E2: the signal peptide is contained in the C-terminal region of capsid protein. Virology 173:241–250 [DOI] [PubMed] [Google Scholar]
- 23. Hobman TC, Woodward L, Farquhar MG. 1995. Targeting of a heterodimeric membrane protein complex to the Golgi: rubella virus E2 glycoprotein contains a transmembrane Golgi retention signal. Mol. Biol. Cell 6:7–20 [DOI] [PMC free article] [PubMed] [Google Scholar]
- 24. Ho-Terry L, Cohen A. 1980. Degradation of rubella virus envelope components. Arch. Virol. 65:1–13 [DOI] [PubMed] [Google Scholar]
- 25. Ho-Terry L, Cohen A. 1984. The role of glycosylation on haemagglutination and immunological reactivity of rubella virus. Arch. Virol. 79:139–146 [DOI] [PubMed] [Google Scholar]
- 26. Jiang W, Baker ML, Wu Q, Bajaj C, Chiu W. 2003. Applications of a bilateral denoising filter in biological electron microscopy. J. Struct. Biol. 144:114–122 [DOI] [PubMed] [Google Scholar]
- 27. Jones TA. 1992. A set of averaging programs, p 91–105 In Dodson EJ, Gover S, Wolf W. (ed), Molecular replacement. SERC Daresbury Laboratory, Warrington, United Kingdom [Google Scholar]
- 28. Kleywegt GJ, Jones TA. 1994. Halloween. masks and bones, p 59–66 In Bailey S, Hubbard R, Waller D. (ed), From first map to final model. SERC Daresbury Laboratory, Warrington, United Kingdom [Google Scholar]
- 29. Kremer JR, Mastronarde DN, McIntosh JR. 1996. Computer visualization of three-dimensional image data using IMOD. J. Struct. Biol. 116:71–76 [DOI] [PubMed] [Google Scholar]
- 30. Ludtke SJ, Baldwin PR, Chiu W. 1999. EMAN: semiautomated software for high-resolution single-particle reconstructions. J. Struct. Biol. 128:82–97 [DOI] [PubMed] [Google Scholar]
- 31. Marr LD, Wang CY, Frey TK. 1994. Expression of the rubella virus nonstructural protein ORF and demonstration of proteolytic processing. Virology 198:586–592 [DOI] [PubMed] [Google Scholar]
- 32. Mukhopadhyay S, et al. 2006. Mapping the structure and function of the E1 and E2 glycoproteins in alphaviruses. Structure 14:63–73 [DOI] [PMC free article] [PubMed] [Google Scholar]
- 33. Petruzziello R, et al. 1996. Pathway of rubella virus infectious entry into Vero cells. J. Gen. Virol. 77:303–308 [DOI] [PubMed] [Google Scholar]
- 34. Pettersen EF, et al. 2004. UCSF Chimera-a visualization system for exploratory research and analysis. J. Computat. Chem. 25:1605–1612 [DOI] [PubMed] [Google Scholar]
- 35. Plevka P, et al. 2007. The three-dimensional structure of ryegrass mottle virus at 2.9 Å resolution. Virology 369:364–374 [DOI] [PubMed] [Google Scholar]
- 36. Risco C, Carrascosa JL, Frey TK. 2003. Structural maturation of rubella virus in the Golgi complex. Virology 312:261–269 [DOI] [PMC free article] [PubMed] [Google Scholar]
- 37. Rossmann MG, Blow DM. 1962. The detection of subunits within the crystallographic asymmetric unit. Acta Crystallogr. 15:24–31 [Google Scholar]
- 38. Rossmann MG, et al. 1992. Molecular replacement real-space averaging. J. Appl. Crystallogr. 25:166–180 [Google Scholar]
- 39. Spilman MS, Welbon C, Nelson E, Dokland T. 2009. Cryo-electron tomography of porcine reproductive and respiratory syndrome virus: organization of the nucleocapsid. J. Gen. Virol. 90:527–535 [DOI] [PubMed] [Google Scholar]
- 40. Suomalainen M, Garoff H, Baron MD. 1990. The E2 signal sequence of rubella virus remains part of the capsid protein and confers membrane association in vitro. J. Virol. 64:5500–5509 [DOI] [PMC free article] [PubMed] [Google Scholar]
- 41. Tong L, Rossmann MG. 1997. Rotation function calculations with GLRF program. Methods Enzymol. 276:594–611 [PubMed] [Google Scholar]
- 42. Vaheri A, von Bonsdorff CH, Vesikari T, Hovi T, Vaananen P. 1969. Purification of rubella virus particles. J. Gen. Virol. 5:39–46 [DOI] [PubMed] [Google Scholar]
- 43. von Bonsdorff CH, Vaheri A. 1969. Growth of rubella virus in BHK21 cells: electron microscopy of morphogenesis. J. Gen. Virol. 5:47–51 [DOI] [PubMed] [Google Scholar]
- 44. Waxham MN, Wolinsky JS. 1985. Detailed immunologic analysis of the structural polypeptides of rubella virus using monoclonal antibodies. Virology 143:153–165 [DOI] [PubMed] [Google Scholar]
- 45. Waxham MN, Wolinsky JS. 1985. A model of the structural organization of rubella virions. Rev. Infect. Dis. 7(Suppl 1):S133–S139 [DOI] [PubMed] [Google Scholar]
- 46. Webster WS. 1998. Teratogen update: congenital rubella. Teratology 58:13–23 [DOI] [PubMed] [Google Scholar]
- 47. Yan X, Sinkovits RS, Baker TS. 2007. AUTO3DEM: an automated and high throughput program for image reconstruction of icosahedral particles. J. Struct. Biol. 157:73–82 [DOI] [PMC free article] [PubMed] [Google Scholar]
- 48. Yang D, Hwang D, Qiu Z, Gillam S. 1998. Effects of mutations in the rubella virus E1 glycoprotein on E1–E2 interaction and membrane fusion activity. J. Virol. 72:8747–8755 [DOI] [PMC free article] [PubMed] [Google Scholar]
- 49. Zlotnick A, et al. 1996. Dimorphism of hepatitis B virus capsids is strongly influenced by the C terminus of the capsid protein. Biochemistry 35:7412–7421 [DOI] [PubMed] [Google Scholar]