Abstract
We present a simple computational model of measurement accuracy for single-copy sensitivity assays (SCA) of HIV RNA that was developed from first principles. The model shows that the SCA is significantly right-skewed. Measured virus concentrations of 1 and 10 virions/ml had overlapping 95% confidence intervals and were statistically indistinguishable.
TEXT
Single-copy sensitivity assays (SCA) have revealed residual HIV viremia below the standard limit of detection 50 virions/ml in almost every patient on successful antiviral therapy (4). The quantitative accuracy of these assays is theoretically limited by sampling variance and copy number-dependent log-normal variance.
The number of particles in a plasma sample varies according to a Poisson distribution. This can significantly contribute to the measurement error when the expected number of particles is small. The viral RNA is then isolated, and a reverse transcriptase process creates a sample of viral DNA. These processes can result in a net loss in copy number that follows a binomial distribution. The DNA sample is then amplified using a standard real-time PCR assay, with normal uncertainty in the PCR efficiency and threshold time resulting in a log-normal uncertainty in the estimate of the sample size. This uncertainty increases as the expected sample size decreases, due to small-number effects on the approximately exponential growth. These processes create theoretical lower bounds on the uncertainty in the SCA measurement. We explored the theoretical limits of measurement accuracy for SCA by using probability theory and computation.
A low sampling volume means that the number of virus particles in a given sample will follow a Poisson distribution with a probability mass function:
where c is the virus concentration in the blood, v is the volume of the sample, and i is the number of viruses present in the sample. If i = 0, then the measured value will also be 0 (assuming no false positives in the PCR process, i.e., from sample contamination), but if i ≠ 0, then the measured value will be the output of a quantitative PCR growth process, which is known to exhibit log-normal noise (1). If the presence of a virus particle in the PCR process guarantees a nonzero measurement, then the sensitivity of this measurement technique is given by the following equation:
For a true concentration of 1 virus/ml and a sample size of at least 3 ml, the sensitivity is >95%, consistent with the claims reported in reference 4.
Given a particular number of viruses in a sample, the measured virus concentration will have a cumulative density function (CDF) given by the following equation:
| (1) |
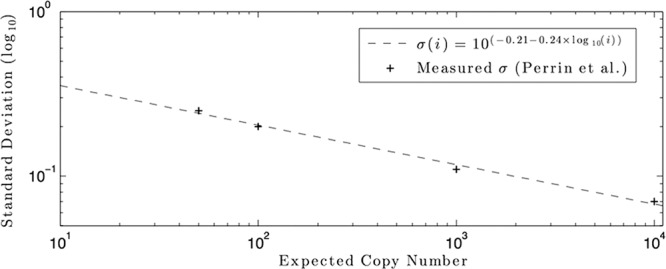
where Φ is the normal CDF and u(*) is the unit step function. The log-normal variance in the PCR results has been shown to vary with the expected copy number, with low-concentration samples showing more variation than high-concentration samples (5). This has been shown to theoretically obey a linear relationship between the log of the expected copy number and the log of the log-normal variance (1). The intersample variance for the Cobas TaqMan quantitative PCR assay was analyzed in reference 5 in a three-site trial with six replicate measurements for each of a standard eight-member HIV RNA panel, with concentrations from 1.5 log10 to 6.7 log10, showing a log-normal standard deviation of 0.07 log10 at the virus concentration 104 virions/ml, increasing to 0.11 log10 at 103 virions/ml, 0.20 log10 at 102 virions/ml, and 0.25 log10 at 50 virions/ml. For concentrations above 104 virions/ml, the standard deviation increases due to cycle number uncertainty, which is not modeled here. The average coefficient of variation as reported in reference 4 for the internal virion standard corresponds to a log-normal standard deviation of 0.08 log10 at virus concentrations of approximately 4.4 log10, which corresponds exactly with the experimental results reported in reference 5, indicating that the process was similar between the experiments. Fitting the data from reference 5 for measured concentrations between 1.5 log10 and 4 log10 to the log-log linear model from reference 1, we arrived at the following equation for the log-normal standard deviation as a function of viral concentration:
This equation fits the data from reference 5, with an R2 value of 0.99928, as shown in Fig. 1. This would imply a σ of 0.38 log10 for a measured value of 1 virion/ml, given a 7-ml sample size. The probability density function of a measured virus concentration, m, given a blood concentration of c, is given by the following composite function:
| (2) |
where ϕ is the normal PDF and δ(*) is the Dirac delta function. If we assume no prior knowledge of the a priori likelihood of the virus concentration in the blood, then the probability of a blood concentration given a measured concentration is given by the equation
following Bayes' theorem. Although this equation has no closed-form solution, it is possible to compute this distribution numerically and obtain marginal probability densities and confidence intervals (CI) for true blood measurements given a particular measured virus concentration. The contribution of Poisson variance to this uncertainty is fixed by the size of the blood sample, described as 7 ml in reference 4.
Fig 1.

Standard deviation versus nominal copy number model fit (R2 = 0.9928).
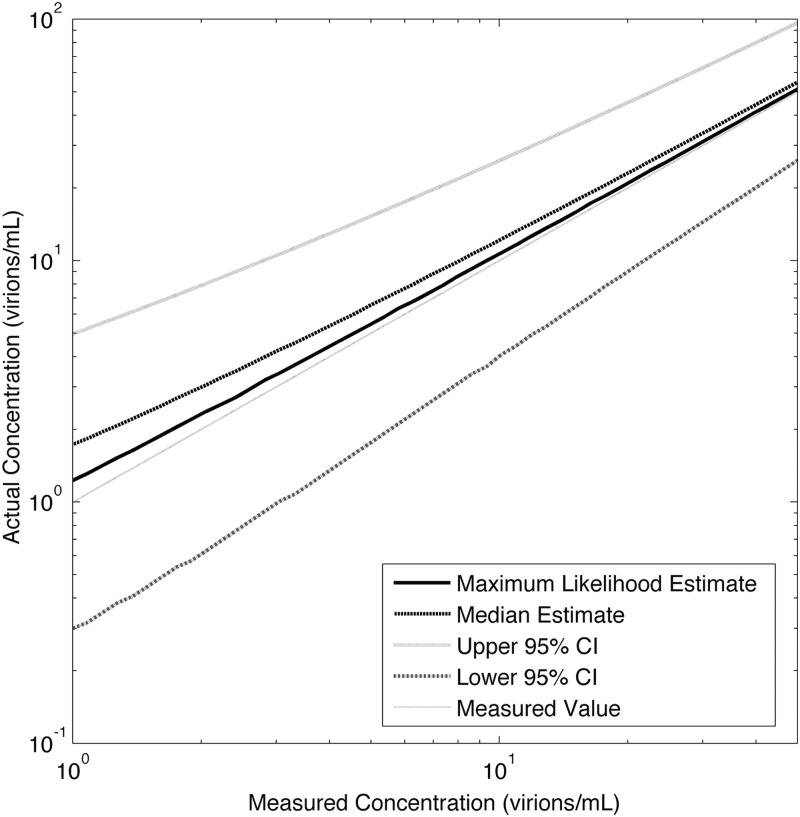
The posterior distributions for measured virus loads between 1 and 50 virions/ml were computed using MATLAB and are shown in Fig. 2 for a sample size of 7 ml. The 95% CI, maximum likelihood estimate (MLE), and posterior median (PM) results were as follows for the 1-, 5-, and 10-virions/ml viral loads, respectively: at 1 virion/ml, MLE of 1.2, PM of 1.7, and 95% CI of 0.3 to 4.9; at 5 virions/ml, MLE of 5.4, PM of 6.5, and 95% CI of 1.6 to 15.2; for 10 virions/ml, MLE of 10.8, PM of 12.1, and 95% CI of 4.0 to 25.9.
Fig 2.
Actual versus measured virus concentrations for SCA, assuming a 7-ml sample size.
The 95% confidence intervals of measured values for the results for 1, 5, and 10 virions/ml overlapped, and a measured value of 1 virion/ml can be said to be indistinguishable from a measured value of 10 virions/ml. The distributions are right-skewed, with maximum likelihood and median estimates of viral load that are considerably larger than the measured values. We neglected the binomial loss during the reverse transcription; including this effect would increase the right skew and the total measurement uncertainty.
An understanding of the persistence of HIV at levels below the standard limit of detection is of critical importance, and single-copy assays have provided significant insight (2). However, the limitations of the assay must be understood. As a detection assay, SCA is sensitive and reliable. As a quantification assay, SCA is subject to large uncertainties and biases, due to the processes described here. Precise estimates of viral loads in the 1- to 50-virions/ml range would require a large number of replicate samples. If this is infeasible, then Bayesian regression techniques (such as those employed in the studies described in references 3 and 6) that can explicitly account for the uncertainty in the SCA should be used, to avoid overinterpreting the experimental results.
ACKNOWLEDGMENT
This work was partially supported by NIH grant number R21AI078842.
Footnotes
Published ahead of print 25 July 2012
REFERENCES
- 1. Bengtsson M, Hemberg M, Rorsman P, Ståhlberg A. 2008. Quantification of mRNA in single cells and modelling of RT-qPCR induced noise. BMC Mol. Biol. 9:63 doi:10.1186/1471-2199-9-63 [DOI] [PMC free article] [PubMed] [Google Scholar]
- 2. Hilldorfer BB, Cillo AR, Besson GJ, Bedison MA, Mellors JW. 2012. New tools for quantifying HIV-1 reservoirs: plasma RNA single copy assays and beyond. Curr. HIV AIDS Rep. 9:91–100 [DOI] [PMC free article] [PubMed] [Google Scholar]
- 3. Luo R, Piovoso MJ, Martinez-Picado J, Zurakowski R. 2012. HIV model parameter estimates from interruption trial data including drug efficacy and reservoir dynamics. PLoS One 7:e40198 doi:10.1371/journal.pone.0040198 [DOI] [PMC free article] [PubMed] [Google Scholar]
- 4. Palmer S, et al. 2003. New real-time reverse transcriptase-initiated PCR assay with single-copy sensitivity for human immunodeficiency virus type 1 RNA in plasma. J. Clin. Microbiol. 41:4531–4536 [DOI] [PMC free article] [PubMed] [Google Scholar]
- 5. Perrin L, et al. 2006. Multicenter performance evaluation of a new TaqMan PCR assay for monitoring human immunodeficiency virus RNA load. J. Clin. Microbiol. 44:4371–4375 [DOI] [PMC free article] [PubMed] [Google Scholar]
- 6. Putter H, Heisterkamp SH, Lange JMA, de Wolf F. 2002. A Bayesian approach to parameter estimation in HIV dynamical models. Stat. Med. 21:2199–2214 [DOI] [PubMed] [Google Scholar]


