

Abstract
Uropathogenic Escherichia coli (UPEC) is the predominant cause of urinary tract infection in both hospital and community settings. The recent emergence of multidrug-resistant clones like the O25b:H4-ST131 lineage represents a significant threat to health, and numerous studies have explored the virulence potential of these organisms. Members of the ST131 clone have been described as having variable carriage of key virulence factors, and it has been suggested that additional unidentified factors contribute to virulence. Here we demonstrated that ST131 isolates have high metabolic potential and biochemical profiles that distinguish them from isolates of many other sequence types (STs). A collection of 300 UPEC isolates recovered in 2007 and 2009 in the Northwest region of England were subjected to metabolic profiling using the Vitek2 Advanced Expert System (AES). Of the 47 tests carried out, 30 gave a positive result with at least one of the 300 isolates examined. ST131 isolates demonstrated significant association with eight tests, including those for peptidase, decarboxylase, and alkalinization activity. Metabolic activity also correlated with antibiotic susceptibility profiles, with resistant organisms displaying the highest metabolic potential. This is the first comprehensive study of metabolic potential in the ST131 lineage, and we suggest that high metabolic potential may have contributed to the fitness of members of the ST131 clone, which are able to exploit the available nutrients in both the intestinal and urinary tract environments.
INTRODUCTION
Escherichia coli is a very diverse member of the normal intestinal flora of humans and other mammals. Some E. coli bacteria are considered uropathogenic (UPEC), and this subset differs substantially from the majority of enteric E. coli in terms of virulence profiles, phylogenetic grouping, and serotype (31).
Urinary tract infection (UTI) usually occurs following the movement of UPEC from the intestinal tract to the periurethral area (13). In a study of urovirulence characteristics of fecal E. coli, it was demonstrated that the phylogenetic groups B2 and D, which are strongly associated with UPEC, tend to dominate, leading to low clonal diversity, suggesting the presence of unknown bacterial factors that contribute to fitness within the intestine prior to transfer to the urinary tract (20).
Generally, the ability of UPEC to colonize and cause infection in the urinary tract results from the cumulative action of specific virulence factors (VFs). These include determinants that aid resistance to host defenses, mediate adhesion, increase iron acquisition, or paralyze ureteric peristalsis (10); however, these VFs are not sufficient to explain the success of UPEC clones like ST131 (14, 21), which shows moderate VF profiles compared to other successful sequence types (STs), such as ST69 and ST127 (8). It has recently been suggested that bacterial metabolic capability enhances fitness and contributes to pathogenesis, which could provide an alternative explanation for the success of prevalent UPEC clones (16), and previous reports have shown that certain metabolic enzymes may also enhance virulence (22). For example, the ability of UPEC to catabolize the amino acid d-serine during UTI supports bacterial growth and acts as a signaling mechanism to trigger virulence gene expression (2, 24).
Biotyping, like most phenotypic methods, is considered to be an unreliable epidemiological tool because of its modest reproducibility and poor discriminatory power, though this depends greatly on the pathogen in question. Indeed, E. coli strains can have considerable biochemical variability (9), and biotyping can be a dependable method for their characterization (3, 12, 17).
Recent advances in automated biotyping methods provide more reliable tools that rely on a variety of novel substrates and precise interpretation techniques that increase reproducibility and discriminatory power (27). In this study, we examined the metabolic potential of UPEC and demonstrated an association between members of the ST131 clone and certain metabolic profiles.
MATERIALS AND METHODS
Bacterial strains.
300 UPEC isolates were included in this study, 150 isolates being collected in June 2007 and 150 in June 2009. Isolates were recovered from nonduplicate, consecutive urine samples received by the microbiology laboratories at hospitals in Manchester (200 isolates) and Preston (100 isolates), United Kingdom. The multilocus sequence typing (MLST) of isolates and identification of virulence capacity and antibiotic susceptibility profiles have been previously described (8).
Metabolic profiling.
The Vitek 2 compact Automated Expert System (AES) (bioMérieux) was used for metabolic profiling. Using the Vitek 2 ID-GNB card (bioMérieux), identification of Gram-negative bacilli occurs through testing the organism's metabolic activity in 47 biochemical tests designed to measure carbon source utilization and enzymatic activity.
Correlation analyses.
The metabolic profiles of the isolates were compared in a pairwise fashion, and the similarity matrix obtained was clustered according to the unweighted pair group method using average linkages (UPGMA). Associations between different parameters were analyzed by using Fisher's exact or Mann-Whitney U tests, and the threshold for statistical significance was a P value of ≤0.05. Where appropriate, more stringent criteria for statistical significance were used.
Aggregate scores for metabolic activities (Bio) and antimicrobial resistance (AST) were calculated for each isolate as the sum of all parameters for which the isolates tested positive divided by the total number of parameters tested. Correlation analysis between Bio and AST scores were analyzed using Pearson's correlation coefficients. Correlation analysis was also used to describe the association of different STs with the aggregate scores calculated for metabolic activities and the resistance to different antimicrobial drugs.
RESULTS
Although the MLST data relating to the isolate collection have been previously described, a summary is given here. Among the 100 STs identified, 9 (ST73, ST131, ST69, ST95, ST10, ST127, ST14, ST88, and ST405) accounted for 59% of the collection (50, 37, 27, 19, 13, 11, 8, 6, and 5 isolates, respectively). Of the 37 ST131 isolates identified, 11 belonged to the O25b-CTX-M-15 subclone, all of which been characterized as multidrug resistant (resistant to at least three antibiotic groups), and the remaining 26 were non-O25b-CTX-M-15 ST131, of which only seven were considered multidrug resistant (8).
ST131 UPEC demonstrate higher metabolic capabilities than those of other STs.
Of the 47 tests employed by the Vitek AES, 30 gave a positive result with at least 1 of the 300 isolates examined. These tests were included in the following analyses for differentiation between UPEC isolates (Table 1). Tests that were found to be negative for all strains tested are shown in Table S1 in the supplemental material.
Table 1.
Biochemical tests used to differentiate between UPEC isolates
| Test | Abbrev.a |
|---|---|
| Adonitol | ADO |
| Beta-galactosidase | BGAL |
| d-Glucose | dGLU |
| Gamma-glutamyl-transferase | GGT |
| Fermentation/glucose | OFF |
| d-Maltose | dMAL |
| d-Mannitol | dMAN |
| d-Mannose | dMNE |
| l-Proline arylamidase | ProA |
| Tyrosine arylamidase | TyrA |
| Urease | URE |
| d-Sorbitol | dSOR |
| Saccharose/sucrose | SAC |
| d-Tagatose | dTAG |
| d-Trehalose | dTRE |
| Malonate | MNT |
| 5-Keto-d-gluconate | 5KG |
| l-Lactate alkalinization | ILATk |
| Succinate alkalinization | SUCT |
| Alpha-galactosidase | AGAL |
| Phosphatase | PHOS |
| Glycine arylamidase | GlyA |
| Ornithine decarboxylase | ODC |
| Lysine decarboxylase | LDC |
| Coumarate | CMT |
| Beta-glucoronidase | BGUR |
| O/129 resistance | O129R |
| l-Malate assimilation | IMLTa |
| Ellman | ELLM |
| l-Lactate assimilation | ILATa |
Abbreviation.
To assess whether isolates of certain STs share specific metabolic characteristics, two analytical approaches were used. First, a nonparametric comparison analysis using the Mann-Whitney U test was used to compare the aggregate Bio scores generated for each ST against all others. Isolates of ST131were significantly more likely to have a higher Bio score than isolates of all other STs (P ≤ 0.0001), and ST127 isolates showed a significant association with low Bio scores (P ≤ 0.003) (Table 2).
Table 2.
Aggregate Bio scores in relation to STs
| ST | Median (range) aggregate Bio score | P valuea |
|---|---|---|
| ST10 | 0.55 (0.48–0.65) | 0.670 |
| ST14 | 0.59 (0.55–0.72) | 0.145 |
| ST69 | 0.55 (0.48–0.72) | 0.967 |
| ST73 | 0.59 (0.45–0.65) | 0.770 |
| ST88 | 0.52 (0.51–0.58) | 0.216 |
| ST95 | 0.55 (0.45–0.62) | 0.973 |
| ST127 | 0.52 (0.45–0.55) | 0.003 |
| ST131 | 0.62 (0.48–0.76) | 0.0001 |
| ST405 | 0.55 (0.41–0.69) | 0.771 |
P values (Mann-Whitney U test) show the significance of the different Bio scores of each ST compared to the other STs. Bold indicates a significant result.
Second, the statistical association of activity in individual metabolic tests with STs was assessed using Fisher's exact test. Of the 30 metabolic activities tested, isolates of common STs were significantly associated with 11 tests. Remarkably, ST131 exhibited significant associations (six positive and two negative) with eight tests, indicating distinctive biochemical characteristics (Table 3), and ST73 had a significant association with four tests. In contrast, isolates of ST14 and ST405 showed no difference in their metabolic activity compared to the rest of the tested isolates.
Table 3.
Statistical analysis of association between STs and individual metabolic testsa
| ST |
P value for biochemical testb |
||||||||||
|---|---|---|---|---|---|---|---|---|---|---|---|
| ADO | AGAL | BGUR | ILATa | ILATk | 5KG | ODC | O129R | PHOS | ProA | SAC | |
| ST10 | 0.0012 | 0.0001 | |||||||||
| ST14 | |||||||||||
| ST69 | 0.0017 | 0.0001 | 0.0001 | ||||||||
| ST73 | 0.0001 | 0.0001 | 0.0014 | 0.0001 | |||||||
| ST88 | |||||||||||
| ST95 | 0.0001 | 0.0001 | |||||||||
| ST127 | |||||||||||
| ST131 | 0.0041 | 0.0002 | 0.0017 | 0.0041 | 0.0001 | 0.0034 | 0.0001 | 0.0001 | |||
| ST405 | |||||||||||
P values (by Fisher's exact test) were calculated for each ST compared to the rest of the population, shown only where P ≤ 0.005. Bold P values indicate negative associations. For abbreviations, see Table 1.
No. (%) of positive isolates is as follows: for ADO, 6 (2); for AGAL, 208 (69); for BGUR, 275 (92); for ILATa, 3 (1); for ILATk, 120 (40); for 5KG, 123 (41); for ODC, 227 (76); for O129R, 175 (58); for PHOS, 36 (12); for ProA, 28 (9); for SAC, 167 (56).
In ST131, metabolic potential is correlated with antibiotic susceptibility.
UPGMA cluster analysis based on the biochemical profiles of isolates from the major STs revealed a large cluster comprised almost entirely of ST131 (19/21 cluster members) and included 51% of the total ST131 isolates (Fig. 1). The cluster was defined at the 70% similarity level and contained isolates previously identified as being resistant to multiple antibiotics (8). The remaining ST131 isolates were found scattered through the dendrogram. Although there was a tendency for isolates with the same ST to cluster together, only ST73 and ST69 gathered in clusters consisting primarily of their respective STs. Other than ST131, no correlation was found between the defined clusters and antibiotic resistance profiles (Fig. 1).
Fig 1.
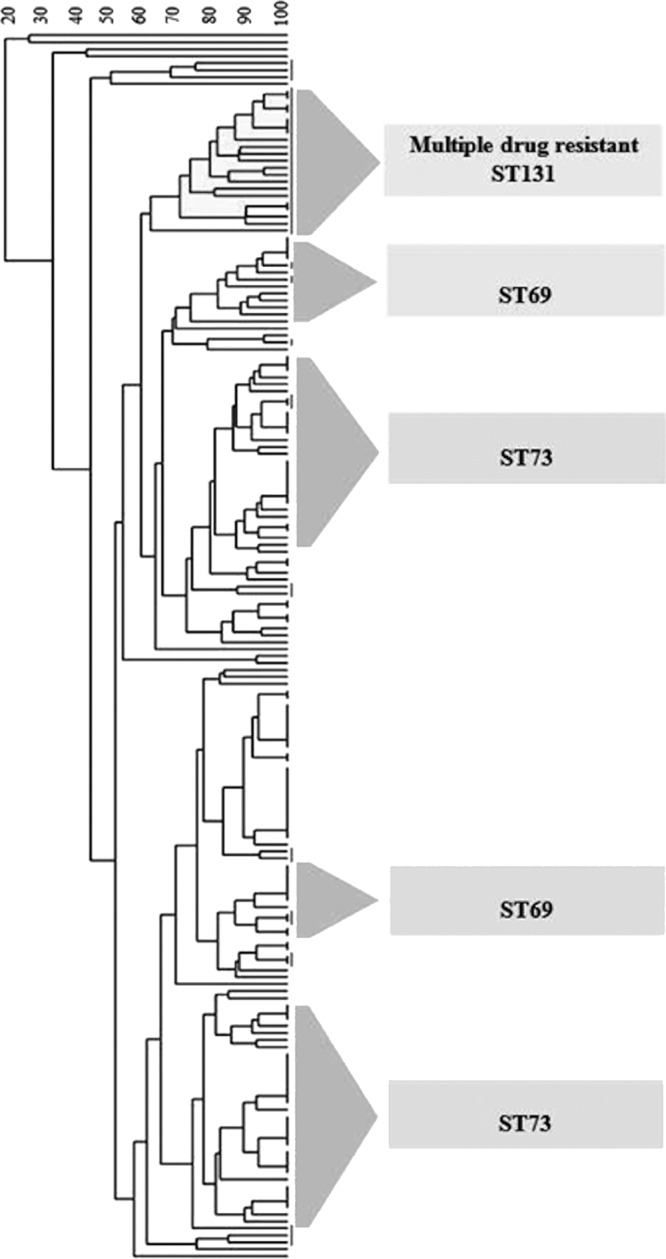
UPGMA cluster analysis based on the biochemical profiles of major sequence types.
No significant correlation was observed when Pearson's correlation coefficient was determined between Bio and AST scores (r2 = 0.1476). However, the comparison revealed an appreciable correlation coefficient that justified further investigation.
Subsequent examination of the correlations at the level of each ST revealed a weak but significant positive association between Bio and AST scores (P ≤ 0.01) among ST131 isolates, which could explain the correlation observed between Bio and AST scores in the general population (Table 4).
Table 4.
Correlation between different phenotypic characteristics and different STsa
| ST | Correlation coefficient (r2), Bio vs. AST |
P value, Bio vs. AST |
|
|---|---|---|---|
| Statistical difference | Correlation significance | ||
| ST10 | 0.0000 | — | — |
| ST14 | 0.1123 | — | — |
| ST69 | 0.0041 | — | — |
| ST73 | 0.0018 | — | — |
| ST88 | 0.0132 | — | — |
| ST95 | 0.0325 | — | — |
| ST127 | 0.1032 | — | — |
| ST131 | 0.3689 | < 0.0001 | < 0.01 |
| ST405 | 0.0608 | — | — |
P values (by Fisher's exact test) are shown only where P ≤ 0.05. Bold indicates positive correlation.
Cluster analysis of a simple matching coefficient based on the metabolic profiles was used to generate a dendrogram describing the association of ST131 and antibiogram profiles. This revealed a large ST131 cluster defined at the 88% similarity level and comprised of 22 (60%) isolates that were characterized as having a multiple resistance antibiogram (Fig. 2).
Fig 2.

Biotype profiling of ST131 isolates: cluster analysis based on metabolic profiles.
A nine-digit numerical code (three tests per digit) was generated using the results of 27 biochemical tests (3 tests being positive for all isolates) to yield the Bio score, with a high score indicating increased metabolic potential. A total of 149 different profiles were detected, of which 19 were solely associated with ST131 isolates. Figure 3 shows the distribution of isolates on the basis of biochemical profiles. Interestingly, isolates of ST131 were divided into 2 groups, susceptible and multidrug resistant, where multidrug-resistant isolates and those of CTX-M-15 O25b were significantly associated with high Bio scores.
Fig 3.

Distribution of metabolic profiles of UPEC isolates. ST131 isolates displayed at the left side of the x axis (left of the black line crossing the x axis) were predominantly susceptible, and those on the right side were resistant (as projected earlier by cluster analysis).
To investigate whether the observed distinctive characteristics of ST131 are general characteristics of the clone or are only the result of O25b-CTX-M-15 ST131 clonal spread, a comparative analysis of incidence of these characteristics in O25b-CTX-M-15 ST131 and non-O25b-CTX-M-15 ST131 isolates compared with non-ST131 isolates was carried out. Although numbers of representative strains are small in some cases and most of the characteristics are general features of the ST131 clone, some biochemical traits were significantly associated with O25b-CTX-M-15 ST131, such as tyrosine arylamidase, l-lactate alkalinization, phosphatase, and succinate alkalinization (P < 0.005) (Table 5).
Table 5.
Characteristics of E. coli ST131 isolates compared to non-ST131 isolatesa
| Biochemical test | No. of ST131 isolates with traitb |
P value | No. of non-ST131 isolates with traitc | P value | |
|---|---|---|---|---|---|
| O25b-CTX-M-15 | Non-O25b-CTX-M-15 | ||||
| AGAL | 11 | 22 | 175 | 0.0042 | |
| BGUR | 7 | 20 | 248 | 0.0001 | |
| ILATa | 2 | 1 | 0 | 0.0018 | |
| ILATk | 11 | 12 | 0.0022 | 97 | 0.0042 |
| 5KG | 0 | 4 | 119 | 0.0001 | |
| ODC | 10 | 25 | 192 | 0.0034 | |
| PHOS | 7 | 1 | 0.0002 | 28 | |
| ProA | 4 | 9 | 15 | 0.0001 | |
| SAC | 10 | 24 | 133 | 0.0001 | |
| SUCT | 10 | 10 | 0.0043 | 108 | |
| TyrA | 11 | 13 | 0.0032 | 138 | |
P values (Fisher's exact test) are shown where P < 0.005 for metabolic reactions. For abbreviations, see Table 1.
For O25b-CTX-M-15, n = 11; for non-O25b-CTX-M-15, n = 26.
n = 263.
DISCUSSION
UPEC bacteria have long been recognized as distinct clones of E. coli, which exhibit specific characteristics, such as virulence-associated traits, distinctive O antigens, selected genotypes, and multidrug resistance phenotypes (31). This is the first report of metabolic profiling being used to describe the globally disseminated ST131 clone. The isolates examined were collected at time points 2 years apart and represent UPEC from community- and hospital-associated infections in patients living in rural and urban areas.
In our collection, UPEC isolates showed biochemical profiles similar to those of the general E. coli population with one exception: α-galactosidase was observed in 69% of UPEC isolates compared to 99% of the general E. coli population, as reported by other groups (5, 6, 17). The reason for the discrepancy in the relatively low incidences of α-galactosidase among UPEC reported in the current study is not clear. However, the low pH and low glucose concentration of urine could present a different environmental selective pressure regulating metabolic pathway expression (19).
Some inferences could also be drawn regarding the correlation between biochemical tests and STs. Although production of ornithine decarboxylase and assimilation of sucrose appeared to be key characteristic in many successful STs, ST131 showed significant correlations with three types of metabolic reactions: peptidase (proline arylamidase), decarboxylase (ornithine decarboxylase), and alkalinization (l-lactate). Among ST131 isolates, the O25b-CTX-M-15 isolates showed a significant correlation with two other metabolic reactions, tyrosine arylamidase and succinate alkalinization. Proline and tyrosine arylamidase are specific peptidase enzymes that hydrolyze proline- and tyrosine-rich proteins (7). Similarly, ornithine decarboxylase is also involved in protein metabolism.
During growth in human urine, E. coli scavenges amino acids and peptides, and disruption of peptide import in UPEC significantly compromises fitness, suggesting that short peptides taken up by UPEC are degraded to amino acids and catabolized as intermediates for the tricarboxylic acid (TCA) cycle and a substrate for the gluconeogenesis pathway (1). The other metabolic reactions, such as alkalinization of lactate and succinate, observed with an elevated incidence could be related to bacterial efforts to relieve acid stress generated by amino acid metabolism.
We suggest that the high metabolic capacity of ST131 compared to that of other STs allows isolates to compensate for their relatively low virulence capacity and explains the apparent virulence reported for members of ST131 (8). In contrast, ST127 showed the lowest metabolic capacity, but we have previously shown that members of this clone have a high virulence potential (8). The association of clonal groups with specific biochemical profiles was previously reported for the O157:H7 clone (17) and the O15:K52:H1 and O25:H4-ST131 clones (4) using API 20E tests, though we cannot compare our data with the findings of these studies.
Although no significant association was observed between the Bio and AST scores in the entire UPEC collection, reexamining the correlation at the ST level revealed an appreciable positive correlation between metabolic scores and the antibiotic resistance scores of members of the ST131 clone. Cluster analysis based on biochemical profiles demonstrated that more than half of the ST131 isolates shared 70% similarity, forming a single large cluster that was also characterized by multiple antibiotic resistances, compared to the rest of the ST131 isolates. This suggests ongoing subclonal variation and spread of ST131 in the Northwest region of England.
Several factors may play a role in the success of the ST131 clone; in 2010, Peirano and Pitout suggested a combination of a phylogenetic group B2 background with certain virulence factors and fluoroquinolone resistance as important factors in the success of the ST131 clone in causing UTI, whereas the acquisition of CTX-M-15-carrying plasmids has facilitated the rapid global spread of the clone (23). Lavigne and colleagues recently suggested that members of the ST131 clone may represent pathogens with an optimal balance of limited virulence and antibiotic resistance (15). Johnson suggested that undefined phylogenetic group B2-associated factors provide fitness advantages to ST131, independent of its virulence traits (11). Recent draft genome sequence determination for ST131 strain EC958 revealed that the chromosomal backbone is most similar to that of the commensal E. coli O150:H5 strain SE15 (28, 29). SE15 is a B2 strain lacking several important genomic islands and prophage elements seen in EC958. The similarity between EC958 and a commensal strain supports our suggestion that metabolic potential is important for the fitness of ST131 strains with respect to gut colonization. Previous reports have also highlighted high levels of intestinal carriage of ST131, indicating fitness for this environment (18, 25, 30). In a similar manner, Roos et al. attributed the ability of ABU isolates to become established in the human bladder to their metabolic fitness (26).
We suggest that further investigation of the metabolic potential of ST131 isolates, using additional phenotypic assays and genome sequence determination, will provide new perspectives in understanding the success of this and other clones (16). It may also be relevant to examine the metabolic potential of ST131 isolates from other infection sites and non-UPEC E. coli to investigate the specificity of the profiles identified in the current study.
The high metabolic potential may facilitate adaptation of strains to different host environments, taking advantage of available nutrients present in the gut or in urine, such as amino acids and small peptides, promoting colonization and increasing pathogenic potential (16). In a diagnostic sense, it may also be possible to exploit specific metabolic traits in the development of differential media for recovery and presumptive identification of ST131 isolates.
In conclusion, this study determined the metabolic capacity of members of successful STs among a well-defined UPEC population. Several correlations were observed between the successful STs and key traits, and these patterns could help to explain why isolates from certain STs, including ST131, are successful extraintestinal pathogenic E. coli clones.
Supplementary Material
ACKNOWLEDGMENTS
We acknowledge the assistance of laboratory staff in the bacteriology laboratories in Manchester and Preston, who were invaluable in provision of the isolates included in this study.
This study was supported by a studentship granted to T.M.G. from the Libyan government. No other funding was required.
All authors have no conflict of interest to declare.
Footnotes
Published ahead of print 18 July 2012
Supplemental material for this article may be found at http://jcm.asm.org/.
REFERENCES
- 1. Alteri CJ, Smith SN, Mobley HL. 2009. Fitness of Escherichia coli during urinary tract infection requires gluconeogenesis and the TCA cycle. PLoS Pathog. 5:e1000448 doi:10.1371/journal.ppat.1000448 [DOI] [PMC free article] [PubMed] [Google Scholar]
- 2. Anfora AT, Haugen BJ, Roesch P, Redford P, Welch RA. 2007. Roles of serine accumulation and catabolism in the colonization of the murine urinary tract by Escherichia coli CFT073. Infect. Immun. 75:5298–5304 [DOI] [PMC free article] [PubMed] [Google Scholar]
- 3. Brauner A, et al. 1987. The use of biochemical markers, serotype and fimbriation in the detection of Escherichia coli clones. J. Gen. Microbiol. 133:2825–2834 [DOI] [PubMed] [Google Scholar]
- 4. Cagnacci S, Gualco L, Debbia E, Schito GC, Marchese A. 2008. European emergence of ciprofloxacin-resistant Escherichia coli clonal groups O25:H4-ST 131 and O15:K52:H1 causing community-acquired uncomplicated cystitis. J. Clin. Microbiol. 46:2605–2612 [DOI] [PMC free article] [PubMed] [Google Scholar]
- 5. Ewing W, Edwards PR. 1986. The genus Escherichia, p 67–107 In Identification of Enterobacteriacae, 4th ed Burgess, Minneapolis, MN [Google Scholar]
- 6. Farmer JJ, III, et al. 1985. Biochemical identification of new species and biogroups of Enterobacteriaceae isolated from clinical specimens. J. Clin. Microbiol. 21:46–76 [DOI] [PMC free article] [PubMed] [Google Scholar]
- 7. Fukasawa K, Hiraoka BY, Fukasawa KM, Harada M. 1982. Arylamidase activities specific for proline, tyrosine, and basic amino acid residues in some oral bacteria. J. Dent. Res. 61:818–820 [DOI] [PubMed] [Google Scholar]
- 8. Gibreel TM, et al. 2012. Population structure, virulence potential and antibiotic susceptibility of uropathogenic Escherichia coli from Northwest England. J. Antimicrob. Chemother. 67:346–356 [DOI] [PubMed] [Google Scholar]
- 9. Godbout-DeLasalle F, Higgins R. 1986. Biotyping of clinical isolates of Escherichia coli of animal origin, using the Analytab API 20E system. Can. J. Vet. Res. 50:418–421 [PMC free article] [PubMed] [Google Scholar]
- 10. Johnson JR. 1991. Virulence factors in Escherichia coli urinary tract infection. Clin. Microbiol. Rev. 4:80–128 [DOI] [PMC free article] [PubMed] [Google Scholar]
- 11. Johnson JR, Johnston B, Clabots C, Kuskowski MA, Castanheira M. 2010. Escherichia coli sequence type ST131 as the major cause of serious multidrug-resistant E. coli infections in the United States. Clin. Infect. Dis. 51:286–294 [DOI] [PubMed] [Google Scholar]
- 12. Katouli M, Kuhn I, Mollby R. 1990. Evaluation of the stability of biochemical phenotypes of Escherichia coli upon subculturing and storage. J. Gen. Microbiol. 136:1681–1688 [DOI] [PubMed] [Google Scholar]
- 13. Kuhnert P, Boerlin P, Frey J. 2000. Target genes for virulence assessment of Escherichia coli isolates from water, food and the environment. FEMS Microbiol. Rev. 24:107–117 [DOI] [PubMed] [Google Scholar]
- 14. Lau SH, et al. 2008. Major uropathogenic Escherichia coli strain isolated in the northwest of England identified by multilocus sequence typing. J. Clin. Microbiol. 46:1076–1080 [DOI] [PMC free article] [PubMed] [Google Scholar]
- 15. Lavigne JP, et al. 2012. Virulence potential and genomic mapping of the worldwide clone Escherichia coli ST131. PLoS One 7:e34294 doi:10.1371/journal.pone.0034294 [DOI] [PMC free article] [PubMed] [Google Scholar]
- 16. Le Bouguenec C, Schouler C. 2011. Sugar metabolism, an additional virulence factor in enterobacteria. Int. J. Med. Microbiol. 301:1–6 [DOI] [PMC free article] [PubMed] [Google Scholar]
- 17. Leclercq A, Lambert B, Pierard D, Mahillon J. 2001. Particular biochemical profiles for enterohemorrhagic Escherichia coli O157:H7 isolates on the ID 32E system. J. Clin. Microbiol. 39:1161–1164 [DOI] [PMC free article] [PubMed] [Google Scholar]
- 18. Leflon-Guibout V, et al. 2008. Absence of CTX-M enzymes but high prevalence of clones, including clone ST131, among fecal Escherichia coli isolates from healthy subjects living in the area of Paris, France. J. Clin. Microbiol. 46:3900–3905 [DOI] [PMC free article] [PubMed] [Google Scholar]
- 19. Liljestrom PL, Liljestrom P. 1987. Nucleotide sequence of the melA gene, coding for alpha-galactosidase in Escherichia coli K-12. Nucleic Acids Res. 15:2213–2220 [DOI] [PMC free article] [PubMed] [Google Scholar]
- 20. Moreno E, et al. 2009. Structure and urovirulence characteristics of the fecal Escherichia coli population among healthy women. Microbes Infect. 11:274–280 [DOI] [PubMed] [Google Scholar]
- 21. Nicolas-Chanoine MH, et al. 2008. Intercontinental emergence of Escherichia coli clone O25:H4-ST131 producing CTX-M-15. J. Antimicrob. Chemother. 61:273–281 [DOI] [PubMed] [Google Scholar]
- 22. Pancholi V, Chhatwal GS. 2003. Housekeeping enzymes as virulence factors for pathogens. Int. J. Med. Microbiol. 293:391–401 [DOI] [PubMed] [Google Scholar]
- 23. Peirano G, Pitout JD. 2010. Molecular epidemiology of Escherichia coli producing CTX-M beta-lactamases: the worldwide emergence of clone ST131 O25:H4. Int. J. Antimicrob. Agents 35:316–321 [DOI] [PubMed] [Google Scholar]
- 24. Roesch PL, et al. 2003. Uropathogenic Escherichia coli use d-serine deaminase to modulate infection of the murine urinary tract. Mol. Microbiol. 49:55–67 [DOI] [PubMed] [Google Scholar]
- 25. Rooney PJ, et al. 2009. Nursing homes as a reservoir of extended-spectrum beta-lactamase (ESBL)-producing ciprofloxacin-resistant Escherichia coli. J. Antimicrob. Chemother. 64:635–641 [DOI] [PubMed] [Google Scholar]
- 26. Roos V, Schembri MA, Ulett GC, Klemm P. 2006. Asymptomatic bacteriuria Escherichia coli strain 83972 carries mutations in the foc locus and is unable to express F1C fimbriae. Microbiology 152:1799–1806 [DOI] [PubMed] [Google Scholar]
- 27. Tenover FC, Arbeit RD, Goering RV. 1997. How to select and interpret molecular strain typing methods for epidemiological studies of bacterial infections: a review for healthcare epidemiologists. Molecular Typing Working Group of the Society for Healthcare Epidemiology of America. Infect. Control Hosp. Epidemiol. 18:426–439 [DOI] [PubMed] [Google Scholar]
- 28. Toh H, et al. 2010. Complete genome sequence of the wild-type commensal Escherichia coli strain SE15, belonging to phylogenetic group B2. J. Bacteriol. 192:1165–1166 [DOI] [PMC free article] [PubMed] [Google Scholar]
- 29. Totsika M, et al. 2011. Insights into a multidrug resistant Escherichia coli pathogen of the globally disseminated ST131 lineage: genome analysis and virulence mechanisms. PLoS One 6:e26578 doi:10.1371/journal.pone.0026578 [DOI] [PMC free article] [PubMed] [Google Scholar]
- 30. Vidal-Navarro L, Pfeiffer C, Bouziges N, Sotto A, Lavigne JP. 2010. Faecal carriage of multidrug-resistant Gram-negative bacilli during a non-outbreak situation in a French university hospital. J. Antimicrob. Chemother. 65:2455–2458 [DOI] [PubMed] [Google Scholar]
- 31. Zhang L, Foxman B, Manning SD, Tallman P, Marrs CF. 2000. Molecular epidemiologic approaches to urinary tract infection gene discovery in uropathogenic Escherichia coli. Infect. Immun. 68:2009–2015 [DOI] [PMC free article] [PubMed] [Google Scholar]
Associated Data
This section collects any data citations, data availability statements, or supplementary materials included in this article.