

Abstract
Hepatitis B virus (HBV) is one of the major viruses transmissible by blood that causes chronic infection in immunocompromised individuals. The study of 61 HBV carrier blood donors from Lebanon revealed multiple patterns of spliced HBV DNA. HBV DNA splicing was examined and quantified in samples of five genotypes and in seroconversion panels. The Lebanese sample median viral load was 1.5 ×10² IU/ml. All strains were genotype D, serotype ayw; 35 clustered as subgenotype D1 and 7 clustered as subgenotype D2. Three splice variants (SP1, SP1A, and Pol/S) were observed in 12 high-viral-load samples. Twenty samples of each genotype, A to E, were tested for the presence of HBV spliced DNA and SP1-specific splice variant. An unspliced HBV genome was dominant, but 100% of strains with a viral load of ≥105 copies/ml contained various proportions of spliced DNA. SP1 was detected in 56/100 (56%) samples in levels that correlated with the overall viral load. HBV DNA quantification with S (unspliced) and X (total DNA) regions provided different levels of viral load, with the difference corresponding to spliced DNA. During the highly infectious window period, the SP1 variant became detectable shortly after the hepatitis B surface antigen (HBsAg), suggesting a correlation between the initiation of splicing and the production of detectable levels of HBsAg. The quantification of HBV DNA with primers located outside and inside the spliced region might provide different estimations of viral load and differentiate between infectious and defective viral genomes. The role of splicing neoproteins in HBV replication and interaction with the host remains to be determined.
INTRODUCTION
Hepatitis B virus (HBV) is one of the major viruses transmissible by blood that causes chronic infection in immunocompromised individuals. HBV replicates by reverse transcription of pregenomic RNA (pgRNA). HBV proteins (large, middle, and small surface proteins, core, polymerase, hepatitis B e antigen [HBeAg], and X proteins) are translated from four major unspliced transcripts: 3.5 kb pgRNA and 2.4 kb, 2.1 kb, and 0.8 kb mRNA. Single- and double-spliced HBV transcripts from pgRNA and pre-S2/S mRNA have been identified in HBV-infected liver tissues and serum and HBV-infected hepatoma cell lines (5, 14, 32).
By analyzing the complete genome sequence of HBV, eight genotypes were identified (A to H). These genotypes are defined by an intergroup divergence of more than 7.5% in the complete genome sequence and more than 4% at the S gene level (22, 23). In addition, multiple subgenotypes were identified and differ from each other by 2.5 to 7.5% (23).
Lebanon is a Middle East country with low seroprevalence of hepatitis B virus (HBV). Among the Lebanese blood donor population, 0.9 to 1.6% are hepatitis B surface antigen (HBsAg) carriers (9, 26), a lower percentage than in other Mediterranean and Middle Eastern countries (7, 12, 21). A previous study conducted by restriction fragment length polymorphism patterns showed the predominance of HBV genotype D (29). Little is known about the molecular diversity of HBV in Lebanon.
The initial aim of this study was to characterize HBV strains obtained from asymptomatic blood donors' HBsAg-positive plasma samples collected in Beirut. Subsequently, the identification of spliced viral DNA led to further study of spliced and unspliced HBV genomes. This observation triggered an expansion of studies of spliced HBV DNA to strains of five genotypes and seroconversion panels.
MATERIALS AND METHODS
Samples.
Plasma samples from asymptomatic blood donors (n = 61) were collected in two major Beirut hospitals and by the Lebanese Red Cross between July 2009 and January 2011. Ethical approval for HBV studies was obtained from appropriate bodies. The commercially available seroconversion panels were obtained from SeraCare (Milford, MA) and generously given by T. Luu, Diagnostics for the Real World, Sunnyvale, CA. HBsAg was quantified with Architect (Abbott Laboratories, Delkenheim, Germany).
Viral load and genotyping.
DNA was extracted from 500 μl of plasma using the High Pure viral nucleic acid kit (Roche Diagnostics, Mannheim Germany) according to the manufacturer's instructions. Viral DNA was quantified by real-time quantitative PCR (qPCR) using an MX 3000 TaqMan-based methodology (Stratagene, La Jolla, CA) as described previously (1). The WHO international standard plasma sample (NIBSC, Potters' Bar, United Kingdom; 97/746) was serially diluted, tested in duplicate, and used to construct a reference curve for quantification of viral load (VL), expressed in IU/ml. The HBV full genome was obtained by amplifying two regions by nested PCR, purifying amplicons with the E.Z.N.A. Cycle-Pure kit (Omega Bio-tek, Norcross, GA), and sequencing as described previously (39).
Sequence analysis was performed using the SeqMan Pro program from the Lasergene package version 7.1 (DNAStar, Madison, WI) and MacVector 10.6 (MacVector, Inc., Cary, CA) under the neighbor-joining algorithm based on Kimura 2-parameter distances, ignoring gaps in pairwise comparisons. Sequence diversity between subgenotype D1 strains was calculated using PAUP* as described previously (20).
Methods to quantify HBV core/polymerase splicing.
A seminested PCR was used to screen for the splice variants occurring in the core and polymerase open reading frames, as described previously (7). Total HBV DNA (spliced and unspliced) was quantified with the MX 3000P quantitative real-time PCR system (Stratagene). HBV X and S region primers and probes were designed from conserved regions (Table 1). Specific primers and probe were designed to quantify SP1 variants (Mir SP1 F and R and SP1 probe). The fluorogenic probes were labeled with Cy5 dye and black hole quencher 2 (BHQ2) (Sigma, Haverhill, United Kingdom). A quantitative PCR with a mixture containing 10 μl of 2× brilliant III ultra-Fast qPCR master mix, 0.5 μM each primer, 0.2 μM fluorogenic probe, 3 × 10⁻⁴ μM reference dye (carboxy-X-rhodamine), and 5 μl template DNA preparation per 20 μl reaction mixture was performed. For each run, duplicates of a 10-fold serial dilution of full-genome HBV DNA and spliced HBV DNA were tested alongside the samples. Vectors enclosing a full HBV genome and a splice variant genome were used as positive controls to validate the efficiency of the primers. A single reference material was designed in order to quantify spliced and unspliced HBV DNA with the same standard. A plasmid containing the full HBV genome was carefully quantified and used as previously described (18). Values were expressed in copies/ml.
Table 1.
Primers designed for detection of unspliced and spliced HBV DNA
| Primer name | Sequence (5′–3′) |
|---|---|
| Mir X Fwd | CACGGGCGCACCTCTCTT |
| Mir X Rv | AGTGCACACGGTCCGGCA |
| HBV-1 | CAACCTCCAATCACTCACCAAC |
| HBV-2 | ATATGATAAAACGCCGCAGACAC |
| X probe | CY5-GACTCCCCGTCTGTGCCTTCTCATC-BHQ2 |
| BS-1 | CY5-TCCTCCAATTTGTCCTGGTTATCGCT-BHQ2 |
| SP1 mir Fwd | ATC GCC GCG TCG CAG AAG |
| SP1 mir RV | TYC TGC ATG GTC CCR YGC |
| SP1 mir probe | Cy5-ATC TCG GGA AYC TCA ATG ATC DTC RAC-BHQ2 |
Statistical analysis.
Comparison between groups was done using the Fisher exact test. Phylogenetic analysis considered bootstrap values of >70% statistically significant. The statistical analysis was performed using Microsoft Excel and Prism (version 4).
Nucleotide sequence accession numbers.
Complete genome sequences were submitted to GenBank under accession numbers JN642126 to JN642167.
RESULTS
All HBsAg-positive plasma samples were from Lebanese male donors. Age ranged between 18 and 60 years (median, 35 years). VL and HBsAg were successfully quantified in 58/61 (95%) plasma samples. VL ranged from 1 IU/ml to 2.9 × 10⁸ IU/ml (median of 1.5 × 10² IU/ml). The median HBsAg level was 1.9 × 10³ IU/ml (range, 2 to 3.6 × 10⁵ IU/ml). Full-genome and pre-SS sequences were obtained for 42 samples (69%) and 10 samples (16%), respectively. Phylogenetic analysis identified all strains as belonging to genotype D; 43 sequences (83%) clustered as subgenotype D1 and 9 (17%) clustered as subgenotype D2 (Fig. 1). The amino acid (aa) sequence analysis of the S gene (52 samples) predicted that all samples were serotype ayw.
Fig 1.

Neighbor-joining phylogenetic tree of HBV complete-genome sequences from 5 countries where genotype D is prevalent. Turkey is indicated as TK, Iran as I, and Lebanon as Leb. Reference strains from GenBank are identified by accession number, country of origin, and subgenotype. Accession numbers of the Tunisian, Iranian, and Turkish sequences can be found in references 11 and 20. The 42 Lebanese strains are identified in bold. Bootstrap support values obtained from 1,000 replicates are indicated. The bar corresponds to 0.02 substitutions per site.
Molecular analysis of full HBV genomes.
Full-genome analysis of 42 Lebanese strains showed a 3% nucleotide divergence (range, 0.1 to 5%). The median divergence in pre-S/S, core, polymerase, and X proteins ranged from 3 to 6%. In 57 BCP/PC sequences, two strains had a mutation at position 1814 or 1816, disrupting the start codon of the precore protein. A stop codon was present at position 1896 in 34 strains (60%). Point mutations at nucleotides (nt) A1752C and G1764A and the double mutation A1762T/G1764A were found in 2 (3%), 11 (19%), and 9 (16%) strains, respectively. The point mutation G1986T/A, affecting the secondary structure of the encapsidation signal, was observed in five strains (9%). Two coexisting amino acid substitutions of the X protein that are putatively associated with a risk of hepatocellular carcinoma (K130M and V131I) were observed in nine samples (21%). In pre-S2, 3/52 strains (5%) had no start codon and one sample had a premature stop codon at W183, truncating the S protein. Other potential escape mutations were observed in the major hydrophilic region (MHR) (aa 100 to 169): 7/49 samples had dual substitutions at aa T118 and P127. P120T, T123N, P127T, M133S, and T140I were observed in single samples. The Leb 15 strain presented multiple aa substitutions (P120A, C121G, G145N, and C149Y) known to affect HBsAg detection assays. This low-viral-load sample (3.7 IU/ml) was clearly positive with Monolisa HBsAg Ultra (sample over cutoff [S/CO] = 13) and Murex HBsAg (S/CO > 20) assays but was low positive with the Architect HBsAg assay (3 IU/ml).
Splice variants and defective HBV genomes in Lebanese genotype D HBV strains.
The presence of splice variants was suspected by examination of the molecular weight of full-genome amplicon gel electrophoresis. Multiple bands were purified and sequenced to verify their HBV origin. Twelve of 61 samples (20%) presented one or more HBV bands smaller than expected; 5/5 samples (100%) had a viral load of ≥105 IU/ml and 7/56 (12%) samples had a viral load of ≤105 IU/ml. Three different splice variants were identified (Fig. 2). The 5′ donor site of splice protein 1 (SP1) was located at nt 2447, spanning the last codon of the core antigen; the 3′ acceptor splice site was at nt 489 (middle of the surface protein open reading frame [ORF]), resulting in a deletion of 1,223 nt. This spliced DNA encoded the first 46 aa of the polymerase and a new ORF encoding 64 aa downstream from the splice site, as previously reported, that was named HBV splice-generated protein (HBSP) (30, 31). SP1 was found in 11 of 12 samples with multiple amplicons. SP1A was spliced between nt 2471, on the polymerase ORF, and nt 489 (Fig. 2b), resulting in a deletion of 1,151 nt. It encoded the first 54 aa of the polymerase and the new ORF generated by SP1. SP1A was seen in a single sample as the only detectable splice variant (Fig. 2a, lane 8, Leb 27). The third splice variant occurred in the polymerase ORF between nt 2985 and 489, resulting in a polymerase-surface fusion protein (Pol/S) including the first 227 aa of polymerase and the last 114 aa of S protein. Pol/S was present in a single sample along with the SP1 splice variant (Fig. 2a, lane 7, Leb 36).
Fig 2.

Patterns of core/pol splicing in subgenotype D1 strains from Lebanese blood donors and cartoons explanatory of the data generated. (a) Representative gel of spliced DNA screening. The full-length unspliced product was 1,802 bp, whereas the spliced HBV product (1,223-bp deletion) was 570 bp. Amplicons were purified and sequenced. Lanes 1 to 13 are Leb 9, 16, 17, 35, 41, 11, 36, 49, 27, 55, 48, 52, and 58, respectively. Lane 7 (Leb 36) has two splice variants, SP1 and Pol/S (686-bp deletion), generating 570- and 1,116-bp products, respectively, plus the unspliced product. Lane 8 (Leb 27) contains SP1A (651-bp amplicon; 1,151-bp deletion). SP1 and SP1A were poorly differentiated by gel electrophoresis but confirmed by sequencing. Lane 11 (Leb 48) does not present a splicing product confirmed by qPCR. Lane 10, Leb 55 presents mostly spliced products, as an unspliced band is not visible. (b) Cartoon summarizing the various types of defective HBV genomes observed in the Lebanese samples and their putative translated proteins. The bar graph on top represents the HBV proteins produced. Three splice variants are shown. SP1 encodes a fusion protein (HBSP) of part of polymerase and a new ORF. SP1A encodes a shorter version of HBSP. The third variant creates a frameshift coding for 331 amino acids of a putative fusion Pol/S protein. nuc, nucleotides. (c) Location of splice variants on the HBV genome map. The gray large circular arrows represent the HBV open reading frames. The black circular arrows indicate the areas of deletion of the splice variants. SP1 and SP1A have a common 3′ splice site but different 5′ splicing sites. In order to quantify the total HBV DNA, primers and probes located on the X genes were used. Quantification of unspliced HBV DNA was measured using primers and probes located on the pre-S/S ORF.
Core/polymerase splicing in genotypes A to E.
The presence of spliced HBV DNA in strains of five genotypes was next examined. In addition to gel visualization of amplicons and sequencing, several methods to quantify spliced and unspliced genomes were developed and utilized (see Materials and Methods). Twenty selected samples with a viral load of ≥1.0 × 101 to 1.0 × 10⁹ copies/ml from each of genotypes A, B, C, D, and E were tested for splice variants by nested PCR. Fifty-three of 100 (53%) samples showed spliced bands in the full-genome amplicon gel (between 45 and 60% depending on genotype). The SP1 band alone (42/100) or associated with either SP1A (8/100) or the core/pol splice pattern (1/100) was the most frequent. In three strains, the SP1A band alone was observed, confirming the initial Lebanese data. New assays were developed to quantify unspliced (infectious) and total viral DNA in circulation in the S and X regions, respectively. The difference between the two qPCRs was assumed to correspond to the defective, spliced HBV DNA. The concentration of unspliced HBV DNA was correlated with the concentration of total HBV viral DNA from all genotypes (Fig. 3a). The regression line crosses the ordinate axis (total HBV DNA) at approximately 0.2 logs, suggesting a low level of spliced DNA in circulation. To confirm the presence of SP1 splice variants, specific qualitative and quantitative assays were performed. The qualitative SP1-specific nested PCR product was positive in samples with a VL of ≥105 IU/ml. A new system of SP1 quantification was optimized using a calibrated plasmid containing spliced HBV DNA as a reference and expressed in copies/ml (limit of detection, 100 copies/ml). With this assay, 55/100 (55%; including five samples negative for spliced DNA bands) of the tested samples had circulating SP1 DNA: 11/20 samples of genotype D, 10/20 samples of genotype E, 10/20 samples of genotype B, 14/20 samples of genotype A, and 10/20 samples of genotype C. Among the three methods used for spliced DNA detection, the X versus S DNA quantification, the gel electrophoresis of amplicons, and the specific SP1 quantification, 46.6%, 91.4%, and 94.8% of the 55 splice-containing samples were detected, respectively. The percentage of detectable spliced DNA according to viral load is shown in Fig. 4. Above 104 copies/ml of HBV DNA, all samples contained detectable spliced DNA. Samples of genotypes D and B contained more splice variants than samples of genotypes A, C, and E, irrespective of viral load (Table 2). Out of the 55 spliced samples, 16 (29%) had ≥50% of spliced DNA or defective HBV virions and eight (53%) of these 15 samples were genotype D. SP1 was found with similar frequencies in the different genotypes but with a significantly higher concentration in genotype D (median SP1 level, 6 × 10⁴ copies/ml) than in genotypes B and E (median, 4.6 × 10³ and 2 × 10³ copies/ml, respectively) (P < 0.05), although the difference was not significant when genotype D was compared to genotypes A and C (median, 9 × 10³ and 1.3 × 10⁴ copies/ml, respectively; P value, 0.115 and 0.074, respectively). In addition, SP1 was present in the WHO International Standard for hepatitis B virus DNA at a low concentration (<200 copies/ml). This standard originates from plasma of a genotype A2 chronically infected individual, assigned to contain 105 copies/ml of HBV DNA.
Fig 3.
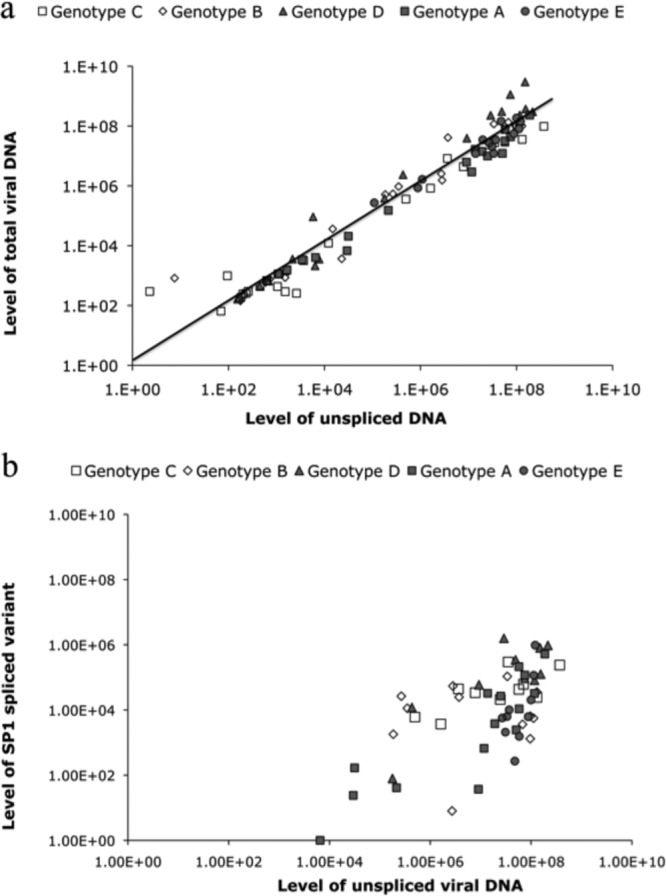
Distribution of HBV viral load of 100 samples with all genotypes. (a) The graph represents the level of unspliced and total HBV viral DNA (infectious particles) by quantifying the S and X genes, respectively. The regression line crosses the ordinate axis (total HBV DNA) at approximately 0.2 logs, suggesting that a low level of spliced DNA is in circulation. (b) Representative graph of the level of SP1-specific truncated genome in samples positive for splicing. The samples were quantified by designing a specific probe that can detect only the spliced product. Spliced product (SP1) was present in high-viral-load samples (>105 copies/ml).
Fig 4.

Distribution of spliced HBV DNA according to viral load in 100 samples of genotypes A to E. Fifty-eight out of 100 samples of genotypes A to E presented evidence of splicing with one or more of three assays: a difference between qPCRs with S and X region primers, a smaller band than those of full-genome amplicons in gel electrophoresis, and a specific SP1 qPCR (see Materials and Methods).
Table 2.
Percentages and ranges of samples with spliced HBV DNA and SP1 across genotypes A to Ea
| Genotype | Median viral load (IU/ml) | Mean % with total spliced DNA | % range with total spliced DNA | Mean % with SP1 | % range with SP1 |
|---|---|---|---|---|---|
| A | 1.0 × 10⁷ | 5.6 | 0–24 | 0.15 | 0.01–1.0 |
| B | 3.1 × 10⁵ | 36.7 | 0–91 | 1.7 | 0.01–9.9 |
| C | 2.5 × 10⁵ | 6.2 | 0–56 | 0.43 | 0.1–1.2 |
| D | 9.3 × 10⁴ | 55.9 | 0–95 | 10.3 | 6.1–91.4 |
| E | 2.3 × 10⁷ | 16.9 | 0–67 | 0.1 | 0.01–0.8 |
% total spliced DNA was calculated as the difference between qPCRs with X primers (total HBV DNA) and S primers (unspliced DNA). SP1 was quantified with a specific qPCR as described in Materials and Methods. For each genotype, 20 samples were tested. Of a total of 55/100 samples with evidence of splicing with any of the three methods used, X/S qPCR detected 49%, SP1 qPCR detected 94.5%, and HBV DNA amplicon gel electrophoresis detected 96.4%.
In summary, from a total of 55 samples with evidence of spliced DNA from any of the three methods used, SP1-specific qPCR was the most sensitive and detected splice variants in 94.8% of samples. Gel electrophoresis of amplicons was only slightly less sensitive (91.4%) but needed sequencing for confirmation. However, the gel method identified a few samples with SP1A only. The concordance between the two methods was 86.2%. Calculating the difference of viral load between X and S primer qPCRs was the least sensitive (46.6%) considering the limited accuracy of each assay.
Screening of spliced DNA in seroconversion panels.
Studies of early stages of HBV infection in both humans and chimpanzees showed that during the preseroconversion window period (WP), a VL of 1 × 10³ to 5 × 10⁵ copies/ml can be reached without HBsAg being detectable (3, 17). It was also shown that the infectivity of HBV was high during the WP and 100 times less in the later stages when HBsAg becomes detectable (17). We formulated the hypothesis that HBsAg detection and the decrease in infectivity were, in part, related to the initiation of HBV DNA splicing. In order to test this hypothesis, eight seroconversion panels of HBV genotype A2 were tested for spliced HBV DNA. An alternative hypothesis is the binding of undetectable anti-HBs to HBsAg, forming complexes. As shown in Table 3, SP1 was detectable simultaneously on gel and at low levels (24 to 98 copies/ml) within 1 to 24 days of HBsAg becoming detectable. During the WP ramp-up phase (HBsAg negative), SP1 was undetectable, although three samples contained a VL ranging from 1.0 × 10³ to 6.8 × 10³ copies/ml. In HBsAg-positive samples with a viral load ranging between 1.2 × 10³ and 8.0 × 10³ copies/ml, four contained detectable spliced HBV DNA, and in 26 samples with a viral load of >1.0 × 10³ copies/ml, six samples (40%) contained spliced DNA.
Table 3.
Quantification of SP1 in 8 seroconversion panels
| Panel no. | Time from 1st sample (h) | Viral load (copies/ml)a | Total spliced (%)b | SP1 (copies/ml)c | SP1 gel resultd | HBsAg (IU/ml)e |
|---|---|---|---|---|---|---|
| 912 | 0 | 1.54E+02 | 0 | 0 | − | <1 |
| 5 | 2.95E+02 | 0 | 0 | − | <1 | |
| 7 | 3.64E+02 | 0 | 0 | − | <1 | |
| 12 | 4.06E+02 | 0 | 0 | − | <1 | |
| 17 | 1.03E+03 | 0 | 0 | − | <1 | |
| 24 | 2.12E+03 | 0 | 0 | − | <1 | |
| 42 | 7.42E+03 | 0 | 0 | − | 21 | |
| 47 | 1.15E+04 | 0 | 0 | − | 88 | |
| 906 | 0 | 4.20E+01 | 0 | 0 | − | <1 |
| 137 | 1.60E+03 | 0 | 0 | − | 2.4 | |
| 150 | 3.70E+03 | 0 | 0 | − | 9.5 | |
| 154 | 7.95E+03 | 0 | 43 | + | 17 | |
| 157 | 5.95E+03 | 0 | 36 | + | 38 | |
| 927 | 0 | 1.83E+00 | 0 | 0 | − | <1 |
| 4 | 9.54E+02 | 0 | 0 | − | 1.3 | |
| 7 | 2.54E+03 | 0 | 0 | − | 3.1 | |
| 11 | 2.79E+03 | 31 | 0 | − | 11 | |
| 14 | 5.17E+03 | 25 | 0 | − | 25 | |
| 18 | 1.25E+04 | 67 | 0 | + | 78 | |
| 928 | 0 | 2.02E+02 | 0 | 0 | − | − |
| 2 | 3.41E+02 | 0 | 0 | − | − | |
| 7 | 4.82E+02 | 0 | 0 | − | − | |
| 9 | 2.57E+03 | 0 | 0 | − | − | |
| 14 | 3.85E+03 | 0 | 0 | − | + | |
| 16 | 2.00E+04 | 0 | 0 | − | + | |
| 21 | 3.63E+04 | 0 | 26 | + | + | |
| 933 | 2 | 1.00E+01 | 0 | 0 | − | − |
| 7 | 8.30E+02 | 0 | 0 | − | − | |
| 9 | 1.20E+03 | 0 | 0 | − | − | |
| 16 | 6.80E+03 | 0 | 0 | − | − | |
| 144 | 1.30E+07 | 0 | 6.00E+03 | + | + | |
| 921 | 0 | 4.06E+02 | 0 | 0 | − | 3.5 |
| 5 | 4.89E+03 | 0 | 0 | − | 7 | |
| 7 | 5.86E+03 | 0 | 0 | − | 17 | |
| 12 | 1.97E+04 | 70 | 24 | + | 70 | |
| 14 | 2.83E+04 | 83 | 43 | + | 156 | |
| 19 | 3.37E+05 | 84 | 98 | + | >400 | |
| 932 | 0 | 3.31E+00 | 0 | 0 | − | − |
| 25 | 7.00E+00 | 0 | 0 | − | − | |
| 27 | 1.30E+01 | 0 | 0 | − | − | |
| 34 | 3.20E+01 | 0 | 0 | − | − | |
| 41 | 1.56E+02 | 0 | 0 | − | − | |
| 43 | 1.02E+02 | 0 | 0 | − | − | |
| 48 | 2.64E+02 | 0 | 0 | − | − | |
| 50 | 5.10E+02 | 0 | 0 | − | − | |
| 61 | 1.09E+02 | 0 | 0 | − | + | |
| 63 | 9.46E+02 | 0 | 0 | − | + | |
| 69 | 3.66E+03 | 0 | 0 | − | + | |
| 71 | 1.29E+04 | 0 | 0 | − | + | |
| 76 | 1.35E+04 | 0 | 0 | − | + | |
| 83 | 1.60E+04 | 0 | 0 | − | + | |
| 85 | 8.72E+04 | 0 | 0 | − | + | |
| 926 | 0 | 6.00E+01 | 0 | 0 | − | <1 |
| 2 | 3.90E+01 | 0 | 0 | − | <1 | |
| 9 | 2.62E+02 | 0 | 0 | − | <1 | |
| 13 | 4.22E+02 | 0 | 0 | − | 1 | |
| 15 | 8.46E+02 | 0 | 0 | − | 1.9 | |
| 20 | 1.09E+04 | 0 | 0 | − | 3.6 | |
| 23 | 1.17E+04 | 0 | 0 | − | 5 | |
| 27 | 3.89E+04 | 0 | 0 | − | 14 |
HBV DNA viral load was obtained with qPCR as previously described (18).
Total spliced DNA is calculated by subtracting viral load by qPCR with primers from the X region from values obtained with the primers from the spliced S region.
SP1 quantification was obtained with primers outside the core/pol spliced region and a specific probe. In both systems, the standard is a calibrated plasmid containing the full HBV genome.
The gel method consists of amplification of the full HBV genome as described previously (19). Amplicons of different lengths are separated in a polyacrylamide gel, and individual bands are confirmed by sequencing to identify the HBV genome.
HBsAg levels were quantified by microparticle enzyme immunoassay with the Architect instrument (Abbott). A − or + is given where no exact value is available.
DISCUSSION
The present study analyzes the first full genome of 42 HBV strains circulating in Lebanese asymptomatic blood donors. They were genotype D, serotype ayw, with 83% having the dominant subgenotype D1 and 17% in the minority with subgenotype D2 (Fig. 1). Genotype D1 was prevalent in more than 80% of Western Asian strains (Lebanon, Turkey, and Iran) and less than 50% of the North African sequences (Tunisia and Sudan, where the D7 and E genotypes were dominant, respectively) but not in Egypt (7, 12, 20, 21). The G1896A (60%) mutation was common, as reported in Mediterranean countries (10). In Iran, Turkey, and Tunisia, the prevalence of the mutated 1896 nucleotide was 85%, 66%, and 85%, respectively (7, 12, 21). In HBsAg-positive donors, the vast majority of strains were essentially wild type, with only strain Leb 15 showing significant mutations in the MHR. This Leb 15 strain carried mutated cysteines 121 and 149 in addition to P120A and G145N substitutions known to affect the antigenicity of the S protein and possibly alter the MHR conformation (4, 36). This might explain the discrepancies observed between assays (8).
The results presented here provide evidence for the existence of at least three patterns of spliced HBV DNA in circulating defective viral genomes. Three different 5′ splicing sites and a single 3′ acceptor site were found (Fig. 2). The 5′ sites at nt 2447, 2471, and 2985 and the 3′ site at nt 489 are highly conserved and were reported as pregenomic RNA splicing sites by several investigators (19, 33). Spliced defective viral DNA was infrequently detected in samples with a viral load of <104 IU/ml (12%) but was detected in 100% of samples with a viral load above 104 IU/ml (5 × 10⁴copies/ml). This suggests that HBSP splicing is a relatively frequent if not obligatory occurrence in HBV chronic infection with high VL. The absence of spliced DNA in low-VL samples may reflect either an inhibitory role of splicing products in viral replication or insufficient sensitivity of the detection methods. It may also reflect an increased activity of the polymerase that makes mistakes related to its lack of proofreading. The latter hypothesis is supported by the high level of conservation of the sequences in all regions involved in the splicing mechanism, suggesting that virtually all strains have full capacity of splicing.
All splice variants included the core gene and the regulatory sequences required for genome replication but lacked the pre-S/S gene promoter regions. The strong bands of spliced DNA (Fig. 2a) presumably corresponded to a high number of defective viral particles in chronic HBV infections of all genotypes (SP1 median level, 2 × 10⁴ copies/ml) (Fig. 3a). In contrast, samples with a VL of ≤104 IU/ml, except Leb 36, which contains a majority of splice variants, including both SP1 and Pol/S, have a higher percentage of unspliced DNA (>70%). Unspliced DNA was present at low concentrations, as confirmed by nested PCR (Fig. 2a). Another sample (Leb 55) had only SP1 spliced product present. In most of the samples, the level of total unspliced DNA was correlated with the total concentration of HBV DNA in the sample, confirming that unspliced HBV DNA was the predominant species in circulation (Fig. 3). Amplifying a conserved region not affected by the splicing showed that in samples with a VL of ≥104 IU/ml, core/pol splicing was always present (Fig. 4).
SP1 was previously shown to be ubiquitously present in asymptomatic blood donors with HBV genotype D and high VL (7) and in 100% of patients with hepatocellular carcinoma (19). Differences in the proportions of infectious and defective viral particles in various individuals may explain the difficulties in correlating viral DNA levels and infectivity (17). SP1 is one splice variant detected. However, other less-prevalent splice variant DNAs, such as SP1A or others, may be present although not detected (13). The impact of splice variants other than SP1 might explain the discrepancies observed between the quantification by subtracting unspliced DNA from total DNA and the direct quantification of SP1 (Fig. 3a and b). This indirect quantification is relatively ineffective since detection is limited by the intrinsic variability of each qPCR assay (Table 2). The SP1 qPCR assay has the advantage of specificity and excellent sensitivity but is limited to detecting only the main variant. Only amplicon gel electrophoresis associated with sequencing can identify the relatively infrequent SP1A and pol/S splice variants.
The importance of the core/pol splicing of pgRNA leading to the identification of two types of genomic DNA in chronic HBV infection as being either infectious when unspliced or noninfectious and defective when spliced is considerable. It affects the methods of HBV DNA quantification depending on the location of the primers used. It also affects the precision of quantification of viral load that seems to vary between genotypes and between individual samples within the same genotype. The issue is further complicated by the fact that the WHO standard contains a mixture of predominant unspliced viral genome and low levels of SP1 and potentially other splice variants. Figure 3a clearly shows that the estimation of unspliced (infectious) VL against an unspliced plasmid taken as a reference is significantly lower than the total viral DNA quantified with primers selected in unspliced X or core regions of the genome (data not shown). The proportion of spliced DNA is variable between individuals, reaching 25% in some cases, particularly in genotype D strain-containing samples (Fig. 3a). As shown in Fig. 3b, SP1 appears to be the predominant splice variant that may reach a concentration of 106 copies/ml, irrespective of genotype. It also shows that at <103 copies/ml of unspliced HBV DNA, SP1 is poorly or no longer quantifiable. The lack of SP1 detection below 1,000 to 10,000 copies of HBV DNA might be related to either a lack of sensitivity of the SP1-specific quantitative assay or an absent or low level of splicing in low-VL samples. The first hypothesis does not seem to stand, since the assay sensitivity was approximately 100 copies/ml.
Selecting a genome region in which splicing does or does not take place to detect or quantify HBV DNA may provide considerably different sensitivity and accuracy of viral load quantification. Amplifying a region such as the S gene in which splicing takes place provides an estimate of the level of infectious (unspliced) VL in samples. These data indicate that the 702-nucleotide pol/S region (nt 2983 to 485) appears most suitable to detect unspliced HBV DNA and that several commercial HBV DNA assays utilize primers in this region either exclusively or in combination with primers from other regions. Such diversity of regions in which primers are selected might be reflected in the bimodal aspect of the data compiled from 22 laboratories participating in the calibration of the WHO standard (6, 27). Such calibration was performed on the basis of data from commercial and in-house qualitative and quantitative assays utilizing different but unspecified primers from various regions of the genome. The current WHO HBV DNA standard containing a low level of spliced DNA appears suitable for quantification. However, since the standard originates from an individual, there is no guarantee that the next one will not be different in that respect.
In the article by Hsia et al. (15), three human serum samples containing genotype A2, D, and C HBV from chronically infected individuals with known chimpanzee infectivity were quantified by qPCR and limiting dilutions using both a core region primer pair able to quantify total HBV DNA and S region primers spanning nucleotides 321 to 401 for qPCR and 203 to 443 for the nested PCR, both within the spliced region determined above. With the genotype C sample, all three estimations gave closely related results, while for genotype A and D samples, a two-log difference was found between the chimpanzee infectivity titer and the DNA level, expressed in genome equivalents (geq)/ml. Unfortunately, the authors did not compare HBV DNA quantifications with core and S primers or indicate which pair of primers was used for quantification. It is, however, possible that the genotype A and D samples contained a substantial amount of spliced, defective virions not infectious in chimpanzees.
Several recent articles compared results of HBV DNA quantification between the Versant branched DNA (bDNA) assay, using hybridization with multiple regions of the genome and presumably detecting both spliced and unspliced DNA (total DNA), and other quantitative assays using primers from the S region (Abbott RealTime HBV DNA and an in-house assay) (24, 38) or the Roche Cobas TaqMan HBV DNA quantitative assay assumed to use S primers (detect only unspliced HBV DNA) (2, 11, 25) and another in-house assay using X region primers detecting both spliced and unspliced total HBV DNA (37). For the Abbott assay, the viral load was overall lower than it was with the bDNA assay but more so in 26% of sample pairs of genotypes C and A but not E (24) and lower by 0.67 log in Taiwanese samples mostly of genotype B (38). Similarly, the Roche assay provided a viral load lower than that with the bDNA assay by 0.35 log10 (11), and 18% of samples had lower VL than that in the bDNA assay by >0.5 log in another study (25). Although the differences were globally significant, it was variable between samples and a substantial minority was clearly underquantified with the Abbott and Roche assays (35). In contrast, an in-house assay utilizing X region primers correlated well (R = 0.93) with the quantification obtained with the bDNA assay. These data suggest that overall, but particularly in a minority of samples, quantitative assays based on S primers provided significantly lower viral load than bDNA because only unspliced HBV DNA was amplified. It also shows that when taking the bDNA assay as a standard, an X region qPCR provided similar viral load results. These data corroborate our prediction that assays measuring spliced HBV DNA with S primers and using the current, little-spliced WHO standard underestimate the viral load of groups of samples of different genotypes with considerable sample-to-sample differences compared to other assays targeting spliced and unspliced regions of the HBV genome.
The next aspect of HBV DNA quantification is the correlation of molecular quantification of circulating DNA and infectivity of blood products. Data from Japan on humans, chimpanzees, and chimeric mice carrying human hepatocytes strongly suggested a higher level of infectivity of blood products collected during the preseroconversion WP than in postacute or late stages of HBV infection (28, 34). In order to examine the hypothesis that lower infectivity might be, in part, related to the initiation of core/pol splicing after HBsAg seroconversion, we studied several seroconversion panels for the presence of spliced DNA and specific SP1 genomes (3). The data shown in Table 3 suggested that SP1 detection coincided with or shortly followed the detectability of HBsAg, irrespective of viral load as soon as it was above 103 copies/ml. Splicing seems to become detectable concomitantly with HBsAg and to be present in only some individuals (5/8 or 63%), not unlike the 58% spliced DNA found in chronically infected individuals (Table 2). In three individuals, no spliced DNA was detected despite a viral load of ≥1 × 10⁴ copies/ml. The data comparing the dynamics and infectivity of WP HBV DNA of HBV genotypes A and C in chimpanzees infected with human sera collected at the peak of DNA and HBsAg (early seroconversion) showed an apparently shorter WP and shorter doubling time but similar maximum viral load in genotype C compared to genotype A strains. Conversely, the level of HBsAg was considerably lower with genotype C infection (17). Previously published data suggest that mRNA splicing in the S region of HBV correlated with excess production of HBsAg becoming detectable in circulation (14). It is possible that both viral fitness and HBsAg production might be, in part, dependent on the occurrence and level of splicing. The data presented support the concept that both lower infectivity and detectability of HBsAg during WP are related to the initiation of pgRNA and/or S region mRNA splicing. When determining the infectious dose of HBV (16, 17), the existence and extent of the spliced HBV genome should be considered. Identifying the factors apparently responsible to determine why and how a given strain starts splicing and at which level remains a challenging scientific question.
In summary, this study confirms the dominance of genotype D, mostly subgenotype D1, in Lebanon. SP1 of pgRNA is frequently detectable in most of the samples, whether during seroconversion or in chronic infection, affecting the infectivity of the plasma samples. In addition to SP1, other splice variants affecting the infectious dose remain to be fully characterized.
ACKNOWLEDGMENTS
We are grateful to Ahmad Ibrahim from Makassed General Hospital and Rita Feghali from Rafik Hariri University Hospital for their collaboration. We also want to thank Hala Jaber from the Lebanese Red Cross and Ghina Rawas, Iman Shmaliyeh, and Zeina Fanous from the Makassed General Hospital for collecting and testing donor samples. We are also grateful to B. Foglieni for performing the HBsAg quantification and D. Candotti and L. Cox for their help in this study.
We thank P. Garrett and her colleagues of Seracare for graciously quantifying HBsAg in the seroconversion panels.
This project was supported in part by a grant from Novartis Vaccines and Diagnostics.
We report no conflict of interest.
Footnotes
Published ahead of print 11 July 2012
REFERENCES
- 1. Allain JP, et al. 2003. The risk of hepatitis B virus infection by transfusion in Kumasi, Ghana. Blood 101:2419–2425 [DOI] [PubMed] [Google Scholar]
- 2. Allice T, et al. 2008. Comparison of the Cobas Ampliprep/Cobas TaqMan HBV Test versus the Cobas Amplicor HBV monitor for HBV-DNA detection and quantification during antiviral therapy. New Microbiol. 31:27–35 [PubMed] [Google Scholar]
- 3. Biswas R, et al. 2003. Comparative sensitivity of HBV NATs and HBsAg assays for detection of acute HBV infection. Transfusion 43:788–798 [DOI] [PubMed] [Google Scholar]
- 4. Carman WF, et al. 1990. Vaccine-induced escape mutant of hepatitis B virus. Lancet 336:325–329 [DOI] [PubMed] [Google Scholar]
- 5. Chen PJ, Chen CR, Sung JL, Chen DS. 1989. Identification of a doubly spliced viral transcript joining the separated domains for putative protease and reverse transcriptase of hepatitis B virus. J. Virol. 63:4165–4171 [DOI] [PMC free article] [PubMed] [Google Scholar]
- 6. Chudy M, Hanschmann K-M, Kreß J, Gerlich W, Nübling CM. 2009. Collaborative study to establish a World Health Organization international genotype panel for hepatitis B virus nucleic acid amplification technique (NAT)-based assays. http://whqlibdoc.who.int/hq/2009/WHO_BS_09.2121_eng.pdf
- 7. Cox LE, Arslan O, Allain JP. 2011. Characterization of hepatitis B virus in Turkish blood donors, and the prevalence of the SP1 splice variant. J. Med. Virol. 83:1321–1325 [DOI] [PubMed] [Google Scholar]
- 8. El Chaar M, Candotti D, Crowther RA, Allain JP. 2010. Impact of hepatitis B virus surface protein mutations on the diagnosis of occult hepatitis B virus infection. Hepatology 52:1600–1610 [DOI] [PubMed] [Google Scholar]
- 9. El-Zaatari M, et al. 2007. Hepatitis B virus DNA in serum of ‘anti-HBc only’-positive healthy Lebanese blood donors: significance and possible implications. J. Hosp. Infect. 66:278–282 [DOI] [PubMed] [Google Scholar]
- 10. Funk ML, Rosenberg DM, Lok AS. 2002. World-wide epidemiology of HBeAg-negative chronic hepatitis B and associated precore and core promoter variants. J. Viral Hepat. 9:52–61 [DOI] [PubMed] [Google Scholar]
- 11. Garbuglia AR, et al. 2007. Comparison of Versant HBV DNA and COBAS AmpliPrep-COBAS TaqMan assays for hepatitis B DNA quantitation: possible clinical implications. J. Virol. Methods 146:274–280 [DOI] [PubMed] [Google Scholar]
- 12. Garmiri P, Rezvan H, Abolghasemi H, Allain JP. 2011. Full genome characterization of hepatitis B virus strains from blood donors in Iran. J. Med. Virol. 83:948–952 [DOI] [PubMed] [Google Scholar]
- 13. Gunther S, Sommer G, Iwanska A, Will H. 1997. Heterogeneity and common features of defective hepatitis B virus genomes derived from spliced pregenomic RNA. Virology 238:363–371 [DOI] [PubMed] [Google Scholar]
- 14. Hass M, et al. 2005. Functional analysis of hepatitis B virus reactivating in hepatitis B surface antigen-negative individuals. Hepatology 42:93–103 [DOI] [PubMed] [Google Scholar]
- 15. Hsia CC, Purcell RH, Farshid M, Lachenbruch PA, Yu MY. 2006. Quantification of hepatitis B virus genomes and infectivity in human serum samples. Transfusion 46:1829–1835 [DOI] [PubMed] [Google Scholar]
- 16. Jilbert AR, Miller DS, Scougall CA, Turnbull H, Burrell CJ. 1996. Kinetics of duck hepatitis B virus infection following low dose virus inoculation: one virus DNA genome is infectious in neonatal ducks. Virology 226:338–345 [DOI] [PubMed] [Google Scholar]
- 17. Komiya Y, et al. 2008. Minimum infectious dose of hepatitis B virus in chimpanzees and difference in the dynamics of viremia between genotype A and genotype C. Transfusion 48:286–294 [DOI] [PubMed] [Google Scholar]
- 18. Lee C, Kim J, Shin SG, Hwang S. 2006. Absolute and relative QPCR quantification of plasmid copy number in Escherichia coli. J. Biotechnol. 123:273–280 [DOI] [PubMed] [Google Scholar]
- 19. Lin X, Wen Y, Wan D, Qian G, Gu J. 2002. Structural and functional analysis of 2.2 kb spliced variant of hepatitis B virus genomes isolated from liver tissues from hepatocellular carcinoma patients. Zhonghua Shi Yan He Lin Chuang Bing Du Xue Za Zhi 16:11–15 (In Chinese.) [PubMed] [Google Scholar]
- 20. Mahgoub S, Candotti D, El Ekiaby M, Allain JP. 2011. Hepatitis B virus (HBV) infection and recombination between HBV genotypes D and E in asymptomatic blood donors from Khartoum, Sudan. J. Clin. Microbiol. 49:298–306 [DOI] [PMC free article] [PubMed] [Google Scholar]
- 21. Meldal BH, Moula NM, Barnes IH, Boukef K, Allain JP. 2009. A novel hepatitis B virus subgenotype, D7, in Tunisian blood donors. J. Gen. Virol. 90:1622–1628 [DOI] [PubMed] [Google Scholar]
- 22. Norder H, Courouce AM, Magnius LO. 1992. Molecular basis of hepatitis B virus serotype variations within the four major subtypes. J. Gen. Virol. 73(Part 12):3141–3145 [DOI] [PubMed] [Google Scholar]
- 23. Okamoto H, et al. 1988. Typing hepatitis B virus by homology in nucleotide sequence: comparison of surface antigen subtypes. J. Gen. Virol. 69(Part 10):2575–2583 [DOI] [PubMed] [Google Scholar]
- 24. Pol J, et al. 2008. Prospective comparison of Abbott RealTime HBV DNA and Versant HBV DNA 3.0 assays for hepatitis B DNA quantitation: impact on HBV genotype monitoring. J. Virol. Methods 154:1–6 [DOI] [PubMed] [Google Scholar]
- 25. Ronsin C, Pillet A, Bali C, Denoyel GA. 2006. Evaluation of the COBAS AmpliPrep-total nucleic acid isolation-COBAS TaqMan hepatitis B virus (HBV) quantitative test and comparison to the Versant HBV DNA 3.0 assay. J. Clin. Microbiol. 44:1390–1399 [DOI] [PMC free article] [PubMed] [Google Scholar]
- 26. Saab BR, Nassar NT, Musharrafieh U, Araj GF, Khogali M. 2007. Prevalence of hepatitis B in a presumably healthy Lebanese population. J. Med. Liban. 55:11–14 [PubMed] [Google Scholar]
- 27. Saldanha J, et al. 2001. An international collaborative study to establish a World Health Organization international standard for hepatitis B virus DNA nucleic acid amplification techniques. Vox Sang. 80:63–71 [DOI] [PubMed] [Google Scholar]
- 28. Satake M, et al. 2007. Infectivity of blood components with low hepatitis B virus DNA levels identified in a lookback program. Transfusion 47:1197–1205 [DOI] [PubMed] [Google Scholar]
- 29. Sharara AI, et al. 2004. Prevalence of restriction fragment length polymorphism patterns of hepatitis B virus compatible with genotype D in Lebanon. Eur. J. Clin. Microbiol. Infect. Dis. 23:861–863 [DOI] [PubMed] [Google Scholar]
- 30. Soussan P, et al. 2008. Expression of defective hepatitis B virus particles derived from singly spliced RNA is related to liver disease. J. Infect. Dis. 198:218–225 [DOI] [PubMed] [Google Scholar]
- 31. Soussan P, et al. 2003. The expression of hepatitis B spliced protein (HBSP) encoded by a spliced hepatitis B virus RNA is associated with viral replication and liver fibrosis. J. Hepatol. 38:343–348 [DOI] [PubMed] [Google Scholar]
- 32. Su TS, et al. 1989. Hepatitis B virus transcript produced by RNA splicing. J. Virol. 63:4011–4018 [DOI] [PMC free article] [PubMed] [Google Scholar]
- 33. Suzuki T, Masui N, Kajino K, Saito I, Miyamura T. 1989. Detection and mapping of spliced RNA from a human hepatoma cell line transfected with the hepatitis B virus genome. Proc. Natl. Acad. Sci. U. S. A. 86:8422–8426 [DOI] [PMC free article] [PubMed] [Google Scholar]
- 34. Tabuchi A, et al. 2008. Titration of hepatitis B virus infectivity in the sera of pre-acute and late acute phases of HBV infection: transmission experiments to chimeric mice with human liver repopulated hepatocytes. J. Med. Virol. 80:2064–2068 [DOI] [PubMed] [Google Scholar]
- 35. Thibault V, et al. 2009. Impact of hepatitis B virus genotypes and surface antigen variants on the performance of HBV real time PCR quantification. J. Virol. Methods 159:265–270 [DOI] [PubMed] [Google Scholar]
- 36. Tian Y, et al. 2007. The amino acid residues at positions 120 to 123 are crucial for the antigenicity of hepatitis B surface antigen. J. Clin. Microbiol. 45:2971–2978 [DOI] [PMC free article] [PubMed] [Google Scholar]
- 37. Welzel TM, et al. 2006. Real-time PCR assay for detection and quantification of hepatitis B virus genotypes A to G. J. Clin. Microbiol. 44:3325–3333 [DOI] [PMC free article] [PubMed] [Google Scholar]
- 38. Yang JF, et al. 2009. Comparison of clinical application of the Abbott HBV PCR kit and the Versant HBV DNA 3.0 test to measure serum hepatitis B virus DNA in Taiwanese patients. Kaohsiung J. Med. Sci. 25:413–422 [DOI] [PMC free article] [PubMed] [Google Scholar]
- 39. Zahn A, et al. 2008. Molecular characterization of occult hepatitis B virus in genotype E-infected subjects. J. Gen. Virol. 89:409–418 [DOI] [PubMed] [Google Scholar]