

Abstract
Integration of metabolic and immune responses during animal development ensures energy balance, permitting both growth and defense. Disturbed homeostasis causes organ failure, growth retardation, and metabolic disorders. Here, we show that the Drosophila melanogaster activating transcription factor 3 (Atf3) safeguards metabolic and immune system homeostasis. Loss of Atf3 results in chronic inflammation and starvation responses mounted primarily by the larval gut epithelium, while the fat body suffers lipid overload, causing energy imbalance and death. Hyperactive proinflammatory and stress signaling through NF-κB/Relish, Jun N-terminal kinase, and FOXO in atf3 mutants deregulates genes important for immune defense, digestion, and lipid metabolism. Reducing the dose of either FOXO or Relish normalizes both lipid metabolism and gene expression in atf3 mutants. The function of Atf3 is conserved, as human ATF3 averts some of the Drosophila mutant phenotypes, improving their survival. The single Drosophila Atf3 may incorporate the diversified roles of two related mammalian proteins.
INTRODUCTION
Animal growth and development rely on coordinated functions of body organs to balance energy consumption and storage under optimal or challenging conditions, such as food scarcity or pathogen attack. When adverse conditions are temporary, animals survive by lengthening development and postponing maturity, reducing their body size (16, 65). In contrast, prolonged starvation or chronic inflammation may exhaust energy reserves, causing death (32, 69). The key nutrient-sensing, metabolic, and immune-signaling pathways are functionally conserved across phyla. In the fruit fly Drosophila melanogaster, as in vertebrates, insulin/insulin growth factor (IGF) signaling (IIS) primarily regulates growth and metabolic homeostasis (56). The innate immune response of the fly relies on the Toll receptor and the immune deficiency (Imd) pathways (35). In response to bacterial or fungal infection, the Toll and Imd pathways engage downstream transcription factors of the NF-κB-like family (Dif, Dorsal, and Relish) that in turn trigger synthesis of a battery of antimicrobial peptides (AMPs).
It has become evident that the metabolic and immune system responses are tightly interconnected. Selective activation of Toll signaling in the Drosophila fat body attenuates IIS to reduce nutrient stores and overall growth (14). Mycobacterial infection causes energy wasting due to the systemic activation of the Forkhead transcription factor FOXO (15). Activation of the Jun N-terminal kinase (JNK) pathway is a well-established example of antagonistic regulation of IIS in both flies and vertebrates (29). Chronic inflammation, accompanied by high JNK activity, is at the heart of the metabolic syndrome and type 2 diabetes (54). Interestingly, genetic removal of IIS pathway components, starvation, and DNA damage all induce AMP expression in the absence of infection. This infection-independent AMP upregulation requires both FOXO (5) and Relish (30, 70), further supporting the notion that maintenance of metabolic and innate immune balance are intimately linked.
The Drosophila fat body and gut integrate metabolic and inflammatory signals to coordinate energy use. The fly alimentary tract digests and absorbs nutrients, while the fat body metabolizes and stores them. In addition, both organs can mount an immune response. The fat body requires both the Toll and Imd pathways for AMP production, whereas the gut immune response relies solely on Imd signaling (35, 62). In contrast to the low basal immune activity within the unchallenged fat body, the presence of commensal bacteria in the gut lumen keeps the gut epithelium permanently alert with activated nuclear Relish. In this case, additional factors, such as the homeobox gene caudal (49), control AMP expression. Tightly regulated production of positive and negative Imd modulators prevents overgrowth of pathogens while preserving beneficial commensal bacteria. Uncontrolled inflammatory response of the intestinal epithelium has a dramatic impact on gut physiology and homeostasis in both flies and humans (43, 47). A failing epithelial barrier and excessive intestinal inflammation are considered major causes of human inflammatory bowel diseases (IBDs) and the autoimmune celiac disease and have been associated with the systemic inflammatory response syndrome and type 1 diabetes (39).
This study implicates the Drosophila activating transcription factor 3 (Atf3) as an important link between immunity and metabolism. Atf3 belongs to the family of basic leucine zipper (bZIP) transcription factors. In mammals, various stress signals, including cytokines, bacterial infection, starvation, and irradiation, induce expression of ATF3. As a homodimer, ATF3 can repress transcription, whereas ATF3/Jun heterodimers activate it (21). Mammalian ATF3 has a paralog, Jun-dimerizing protein 2 (JDP2). Knockout mice for either gene are viable but suffer immune and metabolic defects. ATF3 controls the extent of Toll-like receptor (TLR)-induced immune response (17, 67) and can influence glucose levels by regulating β-cell viability and function (23, 76). Jdp2KO mutants develop extra adipose tissue and store surplus fat (41). Changes in ATF3 expression are associated with human diseases, including diabetes and cancer (22).
Here, we show that Drosophila Atf3, a single ortholog of the ATF3 and JDP2 proteins, maintains both innate immune and metabolic homeostasis. Loss of atf3 primarily affects the gut and fat body, resulting in a complex lethal phenotype of chronic inflammation, combined with a metabolic defect, manifested as simultaneous starvation and obesity. The mutant phenotype is partially alleviated either by reducing the activity of Relish or FOXO or by supplying human ATF3. We suggest that the single Drosophila Atf3 protein combines functions of the duplicated mammalian proteins.
MATERIALS AND METHODS
Transgenic constructs.
The genomic atf3::egfp fusion construct atf3[gBAC] was generated from bacterial artificial chromosome (BAC) CH321-51N24 (63) in the attB-P[acman]-CmR vector (Drosophila Genomic Resource Center, Bloomington, IN). An egfp cassette carrying a FLP recombination target (FRT)-flanked kanamycin resistance gene was amplified from the pR6KGFP plasmid (50) using primers matching 50-bp sequences immediately upstream and downstream of the atf3 termination codon (see Table S1 in the supplemental material). Homologous recombination of CH321-51N24 with the egfp cassette was carried out in the EL250 E. coli strain. The kanamycin resistance gene was excised from the BAC using FLP-mediated recombination (34). The UAS-Atf3[A] construct was prepared as described previously (51). Human ATF3 cDNA (a gift from Tsonwin Hai) was inserted into the pUAST vector encoding a C-terminal FLAG tag. Transgenic fly lines were obtained by using the 86Fb landing site (7) for atf3[gBAC] or through random transposon integration.
Flies.
Drosophila melanogaster was cultured at 25°C on a diet consisting of 0.8% (wt/vol) agar, 8% cornmeal, 1% soy meal, 1.8% dry yeast, 8% malt extract, and 2.2% sugar beet syrup supplemented with 0.625% propionic acid and 0.15% Methylparaben (Sigma-Aldrich). The following genotypes were used: y w, w1118, arm-Gal4, and da-Gal4, His2Av-mRFP from the Bloomington Drosophila Stock Center (Bloomington, IN); relE20 (24); UAS-Pirk (31); dfoxo25J13/TM6B (a gift from Ernst Hafen); dfoxoΔ94/TM6B (53); UAS-atf3[V] and y atf376 w/FM7, gfp (51); C7-Gal4, FB-Gal4 (18); pucE69 (40); attA::GFP[JL116] (62); drs::luc (5); UAS-FLAG-Rel-68 (68); and key1 (48). UAS-atf3[A], atf3[gBAC]/TM6B, and UAS-hATF3 stocks were generated in this study. All genotypes were introduced into the w1118 background.
Survival, rescue, and starvation experiments.
Females carrying y atf376 w over the green fluorescent protein (GFP)-marked FM7 balancer and either the Gal4 drivers (arm, C7, and FB) or atf3+ constructs (atf3[gBAC], UAS-atf3[A], and UAS-hATF3) on the second or third chromosome were crossed with w1118 males of a desired genotype. Twenty-four hours after egg laying (AEL), first-instar y atf376 w male larvae were collected based on the y marker and the absence of GFP and were transferred to dishes with a diet. To help the mutants process the food and to protect it from bacterial overgrowth, a minor proportion of FM7, gfp siblings was added. Up to 40 third-instar y atf376 w larvae were transferred from the plates to a vial containing food, and the eclosed adults were counted. The atf376 deletion was confirmed in individual eclosed males using PCR (51). For aseptic culture, larvae were grown on food supplemented with a combination of carbenicillin (500 μg/ml), tetracycline (50 μg/ml), and rifampin (200 μg/ml). For starvation experiments, early third-instar larvae (aged 4 days and 6 days AEL for y w/Y and atf376/Y larvae, respectively) were placed into vials containing filter paper soaked with water for 8 or 16 h.
Respirometry.
Ten third-instar larvae were placed into a gas-tight vial with 500 μl of food. After 3 h at 25°C, the air from the vial was analyzed in a gas chromatograph (Agilent 6850), and the percentages of O2 and CO2 were determined. Vials with food only were used as a blank. Based on the total air volume in the vial and the body weight of the larvae, O2 consumption and CO2 production were expressed as mm3 of gas · mg−1 · h−1, and the respiratory quotient (RQ) was calculated.
Lipid and carbohydrate analysis.
Eight third-instar larvae were homogenized in 1 ml of water using the Precellys 24 homogenizer (Peqlab, Erlangen, Germany) at 6,500 rpm for 30 s. After addition of 2 ml of methanol and 1 ml of chloroform, lipids were extracted for 24 h at 37°C. The liquid phase was separated by filtration, and the insoluble tissues were reextracted with 3 ml of methanol-chloroform (2:1). Solvent from the pooled extracts was evaporated under nitrogen, and the residues were purified using a modified Bligh-Dyer procedure (52). The lipid extract was applied to 20- by 10-cm high-performance thin-layer chromatography (TLC) Silica Gel 60 plates (Merck, Darmstadt, Germany) pretreated with chloroform-methanol (1:1) and air dried for 30 min. To quantify triacylglycerols (TAG), each lane of a TLC plate was loaded with a 5-μg protein equivalent of the material and developed in hexane-toluene (1:1), followed by hexane-diethyl ether-glacial acetic acid (80:20:1). For quantification of cholesterol, diacylglycerols (DAG), and free fatty acids (FFA), equivalents of 170 μg of protein were applied on 20- by 20-cm TLC plates, which were developed in hexane-diethyl ether-formic acid (30:50:1). Known amounts of lipid standards (Sigma-Aldrich, Taufkirchen, Germany) were added to the TLC plates, along with the samples. To detect lipid bands, the TLC plates were sprayed with a phosphoric acid-copper sulfate reagent (15.6 g CuSO4 · 5H2O and 9.4 ml of 85% H3PO4 in 100 ml of water) and heated at 180°C for 10 min (72). Lipid bands were then quantified by densitometry using the TLC-Scanner 3 (Camag, Berlin, Germany) at 595 nm. For colorimetric TAG assays, 8 to 10 third-instar larvae were washed in phosphate-buffered saline (PBS) and homogenized in 100 μl of 10 mM KH2PO4, 1 mM EDTA. The homogenate was centrifuged (3,000 rpm; 5 min; 4°C), and 10-μl aliquots of the supernatant were assessed in 96-well plates with the Stanbio Triglyceride LiquiColor kit (Stanbio, Boerne, TX). Lipid levels were normalized to the protein contents.
For carbohydrate measurements, 6 fed or 12 starved entire third-instar larvae or 2 μl of hemolymph from 10 third-instar larvae was processed, and glucose, glycogen, and trehalose were assessed with the GAGO-20 kit (Sigma), as previously described (77). Lipid and sugar levels were normalized to protein contents. All measurements were repeated at least twice with four biological replicates.
Quantitative reverse transcription-PCR (qRT-PCR).
Total RNA was isolated from 8 third-instar larvae with TRIzol (Invitrogen, Carlsbad, CA). After DNase I treatment (Ambion), cDNA was synthesized from 2 μg of RNA using oligo(dT) primers and Superscript III (Invitrogen, Carlsbad, CA). PCR was performed in triplicate with the SYBR green mix in the CFX96 (Bio-Rad, Hercules, CA) or the 7900HT (Applied Biosystems) real-time PCR system. All primers were designed to anneal at 62°C (see Table S1 in the supplemental material). All data were normalized to rp49 transcript levels, and fold changes in gene expression were calculated using the ΔΔCT method (37). At least 4 to 6 biological replicates were analyzed per experiment.
mRNA expression profiling by next-generation sequencing.
Sequencing libraries were generated according to the Illumina protocol for total RNA library preparation and loaded onto Illumina flow cells (Illumina, San Diego, CA). Using the Illumina HiSeq 2000 instrument, 76 bp of sequence was read from one DNA end. Image analysis and base calling were done with the Illumina RTA software at run time. The amount of data from raw FastQ files ranged between 25.87 and 39.33 million reads per sample. The sequences were mapped to the Drosophila genome assembly (version BDGP R5/dm3, April 2006) using Tophat v.1.3.2 (60). The alignment output was processed using Cufflinks v.1.1.0 (61) and the current University of California Santa Cruz annotation of the Drosophila genome (dm3). A single per-gene fragments per kilobase of exon per million fragments mapped (FPKM) value provided by Cufflinks was used for the analysis rather than taking into account expression values for all isoforms of a particular gene. We included all genes for which the FPKMs of two replicates differed in the same direction from both control replicates by at least 5% but did not exceed 6-fold between the two duplicates. To look for genes that were differentially expressed under the respective conditions, the average of the two duplicates was calculated. Data set S1 in the supplemental material shows the fold change ratio for each gene compared to the y w control. The FlyBase Gene Ontology (GO) terms were used for functional annotation.
Cultivation and identification of bacterial microflora.
Five third-instar larvae were collected from food, washed twice in PBS, and sterilized in 75% ethanol for 2 min to eliminate bacteria on the larval surface. The larvae were then washed with sterile PBS and homogenized in 100 μl of sterile PBS using a plastic pestle. Ten microliters of the homogenate was diluted in sterile PBS and spread on LB plates (1.5% [wt/vol] agar, 1% [wt/vol] tryptone, 0.5% [wt/vol] yeast extract, 1% NaCl). The plates were incubated at 25°C for 3 days. To identify bacterial species, discrete colonies were picked and used for PCR to amplify 16S rRNA gene sequences with the universal primers 5′-AGAGTTTGATCCTGGCTCAG-3′ (27F) and 5′-GGTTACCTTGTTACGACTT-3′ (1492R) (66), as described previously (46). The PCR products were purified with Microspin S-400 HR Columns (GE Healthcare, United Kingdom) and sequenced. The sequences were then compared to the nucleotide databases using BLASTn (http://blast.ncbi.nlm.nih.gov/Blast.cgi).
Tissue staining.
Tissues from third-instar larvae were processed as described previously (51). The following primary and secondary antibodies were used at the indicated dilutions: Drosophila Armadillo (N27A1; 1:100) from the Developmental Studies Hybridoma Bank (DSHB) (Iowa), rabbit anti-pH 3 (1:1,000; Cell Signaling), mouse antibromodeoxyuridine (anti-BrdU) (1:1,000; Becton Dickinson), rabbit anti-GFP (1:1,000; Acris), and Cy3-, Cy5-, and Alexa Fluor 488-conjugated antibodies (Cell Signaling). Tissues were counterstained with Hoechst (1 μg/ml). The puc-lacZ activity was detected in transgenic larvae using a standard X-Gal (5-bromo-4-chloro-3-indolyl-β-d-galactopyranoside) staining procedure. For staining of neutral lipids, dissected larvae were fixed with 4% formaldehyde in PBS for 20 min and washed in PBS with 0.1% Triton X-100 (PBST). The tissues were stained in PBST containing Bodipy 493/503 (1:2,000; Life Technologies) and Hoechst. Nile red (10% [wt/vol] in dimethyl sulfoxide [DMSO]; dilution, 1:2,000 in PBST) staining was applied on unfixed samples. The stained tissue was rinsed quickly in PBST, and dissected fat bodies and guts were mounted in DABCO-Mowiol medium (Sigma-Aldrich). Images were taken with the Olympus FV1000 confocal microscope.
Statistics.
An unpaired two-tailed Student's t test with unequal variance was used to determine statistical significance for all qRT-PCR, survival, metabolite measurement, and bacterial-count experiments. The Fisher exact test was adopted to determine the significance of gene enrichment in transcriptome data sets.
Microarray data accession number.
Raw data from the mRNA-seq experiments have been deposited in the NCBI Gene Expression Omnibus (GEO) with accession number GSE36377.
RESULTS
Atf3 has an essential function in the growth of Drosophila larvae.
Drosophila atf376 deletion mutants lack DNA encoding the entire Atf3 bZIP domain and die throughout the larval stages. The lethal phase was postponed to the pupal stage when mutant male progeny of y atf376 w/FM7, gfp females and w1118/Y males were kept with a minority of competing FM7, gfp siblings. The atf376 larvae grew more slowly than yw control male larvae, attaining only 60% of their body mass at the third instar (Fig. 1A and B), and their organs were undersized (see Fig. S1A and B in the supplemental material). Their pupariation and adult eclosion were delayed by 2 to 3 days (Fig. 1C), and the adult males were small (Fig. 1A) and short-lived. The retarded growth rate and smaller organ size did not result from inability to feed, as atf376 larvae had food in their guts (Fig. 1A). Cell proliferation in tissues such as the nervous system and imaginal discs also appeared normal in the mutants (see Fig. S1A and B in the supplemental material).
Fig 1.

The essential function of Atf3 can be supplemented by a human ortholog. (A and B) atf376/Y mutant third-instar larvae and adult males are smaller than yw/Y controls, although their guts contain food (arrowheads). The scale bars are 20 μm for larvae and 100 μm for adults. (C) Loss of atf3 causes developmental delay of pupation and adult eclosion, which is rescued with a single copy of the atf3[gBAC] transgene. The data are means ± standard errors of the mean (SEM) of the percentages of pupae and eclosed adults on the indicated days AEL calculated from three independent experiments with a total of 120 larvae. (D) Survival to adulthood can be rescued with Drosophila atf3 genomic (atf3[gBAC]) or cDNA (UAS-atf3[A]) transgenes. (E) Expression of either Drosophila (UAS-atf3[A]) or human (UAS-hATF3) genes in the fat body and midgut using FB or C7-Gal4 drivers improves survival of atf376 mutants, while strong atf3 overexpression (UAS-atf3[V]) (see Fig. S2 in the supplemental material) aggravates larval lethality. The data are means and SEM. **, P < 0.01; and ***, P < 0.001.
About 14% of atf3-deficient adult males emerged. A single transgenic copy of atf3[gBAC], an 86.5-kb region of the X chromosome containing the entire atf3 gene fused to egfp, completely rescued the developmental delay and adult eclosion of atf376/Y males (Fig. 1C and D) and permitted the survival of atf376 homozygous females. A similar rescue was achieved with a UAS-atf3[A] cDNA transgene in the absence of a Gal4 driver. We verified that a single copy of the UAS-atf3[A] construct alone provided about 1.3 times the amount of atf3 mRNA occurring in control larvae (see Fig. S2A in the supplemental material). The adult eclosion rate exceeded 80% when UAS-atf3[A] expression was driven with FB-Gal4, active mainly in the fat body and midgut, and was about 20% and 30% lower, respectively, when C7-Gal4 (fat body and anterior midgut) (Fig. 1E) or the ubiquitous arm-Gal4 (see Fig. S2B in the supplemental material) driver was used. However, stronger expression induced with another line, UAS-atf3[V] (see Fig. S2C in the supplemental material), and either of the three drivers reduced adult survival below that of atf376 mutants (Fig. 1E; see Fig. S2B in the supplemental material), confirming our previous finding that surplus Atf3 was detrimental to development (51). These data indicate that Drosophila requires normal atf3 function for larval growth but is highly sensitive to the dosage and transcriptional regulation of the atf3 gene.
Finally, we tested whether the essential atf3 function in Drosophila could be replaced by a human ortholog, hATF3, whose bZIP domain shares 60% identical amino acids with the fly Atf3 (51) whereas the rest of the protein shows no appreciable homology. We observed a significant improvement in the eclosion rate of atf376/Y hemizygous males expressing hATF3 under the FB-Gal4 and C7-Gal4 drivers and to a lesser extent under arm-Gal4 (Fig. 1E; see Fig. S2B in the supplemental material). This result suggested a surprising degree of functional conservation between the human and Drosophila proteins. Improved survival of atf376 mutants resulting from overexpression of hATF3 in the larval gut and fat body indicated that Atf3 was primarily required in these organs.
Expression of Atf3 in major organs of metabolism and immunity.
To determine which tissues express Atf3 and might therefore malfunction in its absence, we utilized the atf3[gBAC] construct that expresses the Atf3::EGFP (enhanced green fluorescent protein) fusion protein under the natural atf3 regulatory sequence and rescues the atf376 mutants (Fig. 1D). As expected for a bZIP transcription factor, the signal in all tissues localized to cell nuclei. We observed moderate Atf3::EGFP activity in some regions of the larval nervous system, the ring gland and imaginal discs (see Fig. S1C to E in the supplemental material). In agreement with atf3 mRNA expression data available from the FlyAtlas (10), tissues displaying stronger Atf3::EGFP signal included the larval gut, the excretory malpighian tubules, salivary glands, and, to a lesser extent, the fat body (Fig. 2A to D), which contained approximately 2.5-fold less atf3 mRNA than the gut (Fig. 2E). The insect fat body stores both TAG and glycogen reserves and comprises the functions of vertebrate adipose tissue and liver. Both the fat body and gut are major sources of AMPs that execute the humoral branch of the innate immune defense (35). Therefore, the matching patterns of atf3 mRNA and protein reveal Atf3 expression in organs that integrate nutrient uptake, storage, and metabolism with immunity.
Fig 2.
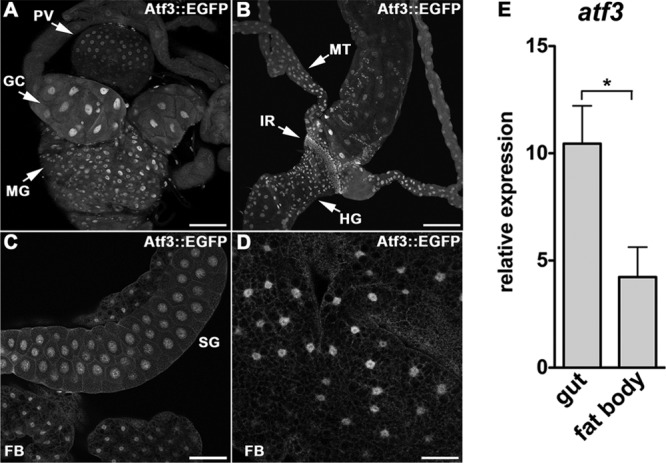
Atf3 is expressed in tissues central to metabolic and immune homeostasis. (A to D) Anti-GFP antibody detected a nuclear Atf3::EGFP signal in confocal micrographs of the gut (A and B), salivary glands (C), and fat body (C and D) dissected from third-instar atf3[gBAC]/+ larvae. GC, gastric ceca; MG, midgut; PV, proventriculus; HG, hindgut; IR, imaginal ring; MT, malpighian tubules; SG, salivary glands; FB, fat body. Scale bars are 100 μm (A to C), and 50 μm (D). (E) atf3 mRNA expression in the larval gut is about 2.5-fold higher than in the fat body as determined by qRT-PCR. The data are means and SEM; *, P < 0.05.
An altered transcriptome indicates chronic inflammation and stress in the gut in atf3 mutants.
To gain insight into Atf3 function, we profiled genome expression in third-instar control and atf376 male larvae using Illumina mRNA sequencing (see Materials and Methods). Loss of atf3 affected the expression of 812 transcripts, with 653 mRNAs enriched and 159 downregulated by ≥1.5-fold relative to the control (see Data set S1 in the supplemental material). We used the GO clustering analysis tools DAVID (26) and FlyMine (38) to find functional categories within the 812 transcripts. The two most represented GO terms (P < 0.001) were polysaccharide/chitin metabolism and defense/immune response, comprising 29 and 38 genes, respectively (Fig. 3A). A majority of the genes in both clusters (90% and 79%, respectively) were upregulated in atf376 mutants relative to controls.
Fig 3.

Genome activity in atf3 mutants reveals signs of gut damage associated with elevated immune, stress, and starvation responses. (A) Genes affected by loss of atf3 are clustered by functional GO terms (top row) or selected based on annotated function in lipid metabolism. The numbers represent the fold change of gene expression in atf376 mutants relative to the control. mRNAs enriched in the larval gut based on FlyMine and our data (Fig. 3B) are marked “G.” Genes affected in the same sense either by Ecc15 (8) or WGA (36) ingestion are highlighted (# and &, respectively). The asterisks indicate genes whose expression was validated by qRT-PCR on independent RNA samples. Genes assigned to recognition/peptidoglycan binding belong to the polysaccharide/chitin and immune defense clusters. (B) Relative expression levels of selected transcripts were compared, using qRT-PCR, between gut and fat body tissues isolated from third-instar control (yw) and atf376 larvae. Gene names appear in color according to functional categories shown in panel A: the polysaccharide/chitin metabolism cluster (red), the defense/immune response cluster (blue), and genes for lipid metabolism (green). Basal mRNA levels of lipase genes (lip3 and CG6271) and genes involved in fatty acid metabolism (CG15829 and CG30502) were higher in the gut than in the fat body, and loss of atf3 had a more pronounced effect on their upregulation in the gut; lip3 mRNA increased in both organs, but more so in the gut. Note that the y scale is logarithmic. Transcription of PEPCK was not significantly altered by atf3 deficiency in either tissue. Note the elevated basal expression of attA mRNA in the fat body and its upregulation upon atf3 loss specifically in the gut. In agreement with the FlyAtlas data, the gut shows enrichment for transcripts of polysaccharide/chitin metabolism (CG32302, CG7824, and CG6996), whose expression is further enhanced in the atf3-deficient gut. The data are means and SEM; n = 4; *, P < 0.05; **, P < 0.01; and ***, P < 0.001.
The “polysaccharide/chitin metabolism” cluster contained proteins with chitin-binding (21 genes) and peptidoglycan-binding (6 genes) domains and two N-acetylglucosamine-6-sulfatases. The N-acetylglucosamine polymer chitin not only forms the insect cuticle, but together with numerous proteins, it also constitutes the peritrophic matrix (PM), a semipermeable sieve that separates ingested food from the epithelial midgut cells (4, 25, 44). The PM functions as a barrier against pathogens and facilitates digestion by partitioning digestive enzymes between the endo- and ectoperithrophic spaces (25, 33). By using the FlyMine tool, we determined that 69% of the affected mRNAs within the cluster were most enriched in the gut (Fig. 3A), encoding proteins such as chitinase 4 (Cht4), mucins (Muc18B, Muc26B, and Muc68E), and structural components of the PM (CG5883, CG7248, CG6996, CG6933, obst-G, and obst-J). Interestingly, we found significant correlation when comparing the transcriptional signature of atf3 mutants with that of isolated guts from Drosophila larvae fed with wheat germ agglutinin (WGA) (36). WGA is insecticidal due to its binding to oligomers containing N-acetyl-d-glucosamine, such as chitin. Among 26 genes shared between the two data sets, 24 were influenced in the same direction (P < 0.0001) (see Fig. S3A in the supplemental material). Strikingly, 178 (22%) out of all genes affected by loss of atf3, and one-third of those within the “polysaccharide/chitin metabolism” cluster, are known to be altered in the guts of adult flies fed with the bacterium Erwinia carotovora (Ecc15) (8) (Fig. 3A; see Fig. S3B and Data set S1 in the supplemental material). Of these mRNAs, 79% were up- or downregulated in the same sense (P < 0.0001) in atf376 larvae and orally infected flies (see Fig. S3B in the supplemental material).
The prevalence of gut-expressed genes in the overall transcriptome changes suggested that loss of atf3 strongly affected the gut. We therefore examined the relative contributions of the gut and the fat body to the changes in representatives of the functional groups outlined in Fig. 3A. Indeed, we found that the gut was responsible for elevated expression of most of the selected metabolic and defense genes (Fig. 3B). In line with these data, we detected ectopic activity of an attacinA::gfp transgenic reporter in the proventriculus of atf376 larvae (Fig. 4A), but not in the fat body. The stress-inducible JNK pathway was also strongly activated in the mutant proventriculus and midgut (Fig. 4B). These results corroborate the notion that the larval gut is the primary site of deregulated immune and stress responses in atf3 mutants.
Fig 4.
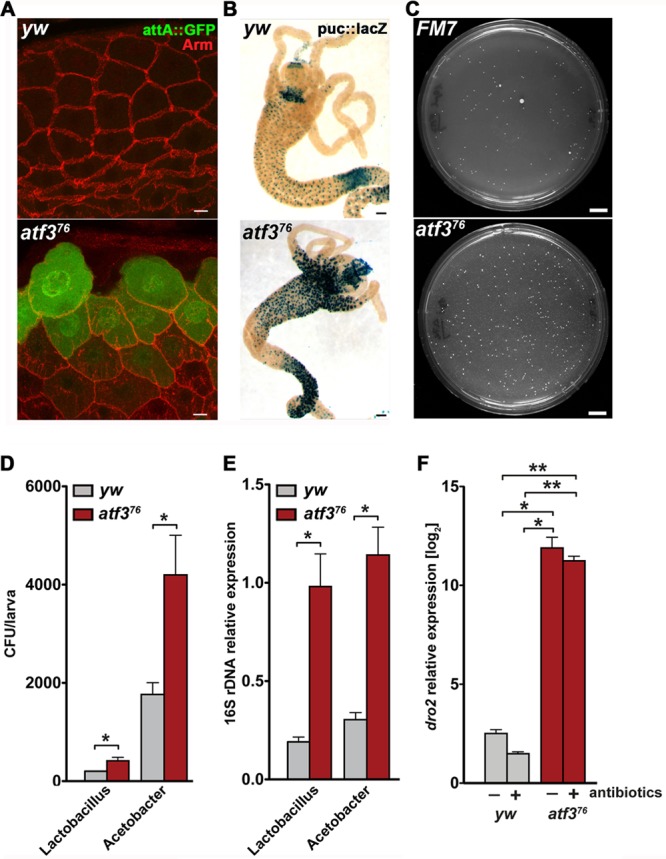
AMP expression, stress response, and microbiota are increased in the atf3 mutant gut. (A) The proventriculus in atf376 larvae shows elevated activity of an attA::GFP transgenic reporter (green); anti-Arm (red) staining outlines cell membranes. Scale bar = 10 μm. (B) JNK (puc::lacZ, blue) is excessively active in the gut of atf376 larvae. Scale bars = 100 μm. (C) Increased numbers of bacterial colonies that grew on standard LB plates from spread homogenates of third-instar atf3 mutant larvae and their FM7, gfp siblings. Prior to homogenization, all larvae were grown together on the same food plate to ensure equal conditions. Male larvae of the desired genotypes were sorted based on the presence/absence of GFP fluorescence and the yellow marker. Scale bars = 1 cm. The large colonies are Lactobacillus sp., and the small colonies are Acetobacter sp. as determined by sequencing of 16S rRNA genes. (D) rRNA gene sequencing revealed overrepresentation of both bacterial species in atf376 larvae. (E) The results were confirmed on total DNA samples by qPCR with primers specific to Lactobacillus sp. or Acetobacter sp. 16S rRNA genes (see Table S1 in the supplemental material). The data are means and SEM; n = 4; *, P < 0.05. (F) drosomycin 2 (dro2) mRNA expression remains high in atf376 larvae even when grown on food with antibiotics. *, P < 0.05; **, P < 0.01.
The above data suggest that loss of atf3 induced a genetic program with a pattern common to gut damage and oral infection. Consistent with this correlation, the second GO cluster encompassed genes of the Imd and Toll innate immunity pathways. Expression of all three NF-κB/Relish-like transcription factors (Rel, Dl, and Dif) was increased in atf3 mutants. Genes encoding effectors of immune response, such as the AMPs attacins (AttA-D) and drosomycins (Drs, Dro2, and Dro5), microbial (GNBP2) and peptidoglycan-recognizing (PGRP-LF and PGRP-SD) proteins, and induced small peptides (IM), were all upregulated, some of them massively (Fig. 3A). In contrast, inhibitors of Imd signaling (PGRP-SC1a and PGRP-SC1b) and lysozymes (LysB to -E) were strongly underexpressed in atf3-deficient larvae. The abnormally active immune reaction coincided with upregulation of stress response factors, all of which have been previously linked to immune function, including the translational repressor 4E-BP/Thor (6); components and targets of MAPK signaling, such as p38c, Jun, the phosphatase Puckered (Puc), Ddc, and NLaz; and proteins involved in wound healing (e.g., NijA, CG5550, and β-Tub60D) (12, 27) (Fig. 3A).
The transcriptome data matched a gene expression program that is otherwise triggered by bacterial infection. To examine possible changes in the intestinal microbiota, we cultured bacteria from control and atf3-deficient larvae and found that the latter contained more bacteria (Fig. 4C). By amplifying and sequencing 16S rRNA genes, we discovered that of species naturally inhabiting the Drosophila gut (11), the population of Acetobacter sp. and Lactobacillus sp. was increased in atf3 mutants (Fig. 4D and E). However, the elevated expression of AMP genes (e.g., dro2) persisted even when we reduced the populations of commensal bacteria by growing atf376 larvae on food with antibiotics (Fig. 4F and data not shown), and the antibiotics failed to improve larval survival. Therefore, it is plausible that the chronic inflammatory reaction in atf376 larvae arose independently of bacterial infection. However, we cannot exclude effects of bacterial species that could not be cultured under our conditions and that might resist the antibiotic treatment.
atf3 mutants are obese while experiencing starvation.
Active immune response comes at a considerable energy cost, compromising development, growth, and fitness. A chronic inflammatory state is an important risk factor in the development of various metabolic disorders ranging from wasting and cachexia to obesity and insulin resistance (14, 15, 32, 54, 69). The chronic inflammation and stress phenotype of the developmentally delayed, growth retarded, and eventually lethal atf376 mutants resembles this situation.
To address whether atf3 mutants suffer from disrupted metabolic and energy homeostasis, we examined their nutrient reserves. Staining of tissues from feeding third-instar larvae for neutral lipids revealed that, in contrast to the uniform, moderately sized lipid droplets in the control fat body, adipose cells of atf376 larvae contained lipid droplets of variable size, with extremely large droplets prevailing (Fig. 5A). Staining with Nile red detected enlarged lipid droplets also in the mutant midgut (Fig. 5B). Compared to controls, feeding atf376 larvae had twice the amount of stored fat (TAG) and nearly as much DAG and FFA (Fig. 5C). In contrast to lipids, neither circulating carbohydrates (trehalose and glucose) nor glycogen stores were significantly different between fed control and mutant larvae (Fig. 5D; see Fig. S4A in the supplemental material). Therefore, atf3 mutants are obese but not hyperglycemic. Respirometry showed that both control and atf376 larvae primarily metabolized carbohydrates (RQ, close to 1.0); however, a lower rate of gas exchange in atf3 mutants indicated that their total metabolism was slower (Fig. 5E). Retardation of growth and development might therefore result from inadequate utilization of nutrient energy, with its final effect being to cause starvation.
Fig 5.

atf3 mutants accumulate surplus lipids while experiencing slow metabolism. (A) Enlarged lipid droplets in the fat body of atf376 larvae. Scale bars = 20 μm. (B) Ectopic fat storage in the atf376 larval midgut. Scale bars = 100 μm. (C) Total contents of TAG, DAG, and FFA as determined by TLC are elevated in atf3 mutants compared to control larvae. (D) Levels of circulating sugars remain unaffected by atf3 deficiency. (E) Both control and atf376 larvae primarily utilize carbohydrates, but the mutants metabolize more slowly. The data are means and SEM; n = 4; *, P < 0.05; **, P < 0.01; and ***, P < 0.001.
The transcriptome of atf376 mutants revealed changes in several genes linked with fat metabolism, such as those for lipases (lip3, lip4, CG31089, and CG6271), enzymes involved in TAG synthesis (wun), and fatty acid transport (CG15829) and degradation (CG3902) (Fig. 3A). In particular, expression of lip3, a typical starvation response gene (74, 75), was massively increased in atf376 larvae (Fig. 3A and B and 6). We therefore systematically tested whether the transcriptome of atf376 mutants carried a starvation pattern. Our data set contained 322 out of 3,138 transcripts that were altered upon 24-hour starvation of Drosophila larvae (42). Of these mRNAs, 84% showed corresponding changes under starvation and atf3 deficiency (P < 0.0001) (see Fig. S4B in the supplemental material). An overlap of equal significance was found by comparing our data set with another report (75): 76% of 119 shared genes were regulated in the same direction in starved and atf3-deficient larvae (see Fig. S4C in the supplemental material).
Fig 6.

atf3 mutants mount a starvation-like transcriptional program. Total RNAs from fed and fasted (8 h) atf376/Y and yw/Y control larvae were subjected to qRT-PCR. Expression of lip3, thor, relish, and atf3 itself was upregulated in fed atf3 mutants relative to the control, and starvation further induced the mRNAs in all larvae. A luciferase assay in larval lysates showed activation of a drosomycin (drs::luc) transgenic reporter in fed atf3 mutant larvae, and the reporter activity was further stimulated by starvation for 14 h. The data are means and SEM; n ≥ 4; *, P < 0.05; **, P < 0.01; and ***, P < 0.001.
To further explore the link between perturbed metabolic and immune homeostasis in atf3 mutants, we chose to examine the expression of lip3 and three additional representatives, thor, rel, and drs, previously associated with starvation (30, 42, 75), in fed and starved control and atf376 larvae. In accord with our transcriptome data, we found that compared to that of the control, the expression of lip3, thor, and rel mRNAs and the activity of a drs::luc transgenic reporter were all elevated in atf376 larvae prior to food removal (Fig. 6). As expected, expression of all these genes was induced in fasting control larvae, and the levels of rel, thor, and drs were further increased by starvation in atf376 mutants. Finally, we found that the atf3 gene itself was sensitive to starvation, as minor but reproducible upregulation of atf3 transcription was observed in starved controls. As we used a primer set that amplified part of the first exon, unaffected by the atf376 deletion, we could detect slightly higher atf3 mRNA levels in fed atf3 mutants than in fed control larvae and a further increase upon starvation (Fig. 6). The ability of atf376 larvae to react to food withdrawal by inducing starvation response genes prompted us to assess whether they also utilize their stores. Upon 16 h of wet starvation, stores of both TAG and sugars were significantly depleted in both control and atf376 larvae (see Fig. S4A in the supplemental material), indicating that nutrient mobilization as a normal response to starvation was unaffected by loss of atf3.
Next, we tested whether gain of atf3 might have effects opposite to those of its loss. We manipulated atf3 expression using the UAS-atf3[A] transgenic construct. Without a Gal4 driver, atf3 mRNA increased slightly to an extent observed in starved control larvae; a ubiquitous da-Gal4 driver enhanced atf3 expression more than 6-fold (Fig. 7A). The mild overexpression of atf3 was sufficient to suppress lip3, thor, and rel activity, and lip3 mRNA further dropped in da-Gal4, UAS-atf3[A] (da>atf3[A]) larvae (Fig. 7B). Moreover, overexpression of atf3 in the fat body using C7-Gal4 lessened lipid droplet size and reduced TAG below levels seen in normal third-instar larvae (Fig. 7C and D). These data showed that, opposite to atf3 deficiency, gain of Atf3 generated lean larvae and suppressed basal expression of immune and metabolic genes.
Fig 7.

Gain of Atf3 or its human ortholog reduces starvation response and lipid stores. (A) Manipulation of atf3 mRNA levels in UAS-atf3[A]/+ and da>atf3[A] larvae. (B) Slight or strong overexpression of atf3 lowers relish, thor, and lip3 mRNA levels. (C and D) Expression of atf3 in the fat body reduces both lipid droplet size and TAG content below the respective size and level in control larvae. (E and F) The abnormally large lipid droplets and high TAG levels in atf376 larvae become normalized upon supply of the UAS-atf3[A] transgene or expression of hATF3 in the fat body. Scale bars = 40 μm. The TAG content was determined using the colorimetric assay. (G) qRT-PCR analysis showing that hATF3 can completely or partially normalize expression of some (rel and attD) but not other (dro2) genes misregulated in atf376 mutant larvae. The data are means and SEM; n = 4; *, P < 0.05; **, P < 0.01; and ***, P < 0.001.
Taken together, our data show that chronic inflammation in atf3 mutants is associated with a complex metabolic phenotype characterized by obesity but not hyperglycemia. Despite elevated lipid storage and normal carbohydrate levels, atf376 larvae have a transcriptome pattern of starvation response even when fed ad libitum. However, upon food withdrawal, they activate starvation response genes and mobilize nutrient reserves.
Human ATF3 normalizes fat content and gene expression in atf3 mutants.
A single copy of the rescuing Drosophila UAS-atf3[A] transgene (without a Gal4 driver) reduced the abnormally large lipid droplets and high TAG levels. Strikingly, expression of hATF3 using FB-Gal4 was capable of similar reduction of lipid droplet size and fat content in the mutants (Fig. 7E and F). Expression of some (but not all) of the genes ectopically activated in an atf376 background, such as relish, attD, or CG5550, was completely or partially normalized by hATF3 (Fig. 7G). Therefore, hATF3 can partially substitute for its Drosophila ortholog in maintaining immune and metabolic homeostasis by modulating the expression of certain regulatory genes. These data strengthen our previous conclusion that at least some of the functions of atf3 have been evolutionarily conserved despite the limited protein sequence homology.
Attenuation of immunity improves lipid metabolism and survival of atf3 mutants.
Suppressed activity of NF-κB has been shown to simultaneously reduce inflammation and improve insulin sensitivity in mouse obesity models (9, 73). In Drosophila, the transcription factor FOXO is known to antagonize insulin signaling and stimulate expression of the AMP, thor, or lip4 gene in response to JNK stress signaling, or starvation (5, 57, 64). To address to what extent the high inflammatory tone and associated metabolic anomalies contribute to atf3 mutant phenotypes and lethality, we suppressed the function of NF-κB/Relish and FOXO in atf3 mutants (see Fig. S5A in the supplemental material) and analyzed the gene expression profiles of third-instar larvae. Introducing either foxo (foxoΔ94 or foxo25J13) or relE20 loss-of-function mutations into the atf376/Y background restored normal levels of 98 and 80 transcripts, respectively (Fig. 8A; see Data set S1 in the supplemental material). They included numerous representatives of the polysaccharide/chitin metabolism and defense/immune response GO functional groups (Fig. 3A), such as dro2, CG32302, CG5550, and lip3, which we subsequently verified by qRT-PCR (Fig. 8B). Several of these genes (e.g., IM3, CG32302, CG5550, totA, totC, and Muc18B) have been previously shown to be induced by immune challenge in a Relish-dependent manner (8, 13).
Fig 8.

Effect of reduced Relish and FOXO activity on gene expression, lipid storage, and survival in atf3 mutants. (A) Venn diagram showing the numbers of genes whose expression was normalized either by supplementing the atf3[A] transgene or by reducing the foxo or rel gene dose in atf376 mutants compared to the atf376 background. Gene names are shown in color according to functional categories shown in Fig. 3A. rel*, downregulation of relish was established by qRT-PCR on independent samples (see Fig. S5A in the supplemental material). (B) Decrease of lip3, CG5550, CG32302, and dro2 mRNAs toward control levels upon lowering rel and foxo dosages in atf376 larvae was validated by qRT-PCR on 4 to 6 independent RNA samples. (C) Amounts of TAG and DAG in third-instar atf376 larvae were reduced by rel or foxo heterozygosity, whereas the FFA titer was significantly lowered by removing one copy of rel, but not foxo. Lipids were assessed using thin-layer chromatography. (D) The total TAG content of third-instar larvae was lower in relE20 homozygotes than in w1118 controls. In contrast, overexpression of an active form of Relish (Rel-68) in the fat body and midgut using FB- or C7-Gal4 increased TAG levels. The TAG content was estimated using the TAG colorimetric assay. (E) atf376/Y relE20/+ animals survived better than their atf376/Y TM6B/+ siblings. All data in panels B to E are means and SEM; n ≥ 4; *, P < 0.05; **, P < 0.01; and ***, P < 0.001.
The fact that the expression of multiple genes changed upon manipulating the doses of Atf3, Rel, and FOXO transcription factors suggests a complex regulation. Our comparative analysis revealed 24 genes whose expression was restored to levels normally occurring in atf3+ larvae by reducing FOXO and Relish activities (e.g., turandot family members, lysC, and lysD) but not by providing atf3[A] itself, while expression of 21 genes was normalized in all three genotypes (Fig. 8A and B), with lip3, lysB, dro2, CG13806, and CG32302 being part of the functional clusters. These data indicated that some prominent changes in the gene expression profile in atf3 mutants rely on the two important transcriptional regulators, Relish and FOXO. Nevertheless, lowering the dose of functional FOXO or Relish was insufficient to normalize the activity of some other genes (e.g., attD and thor) whose expression was misregulated by the loss of atf3, suggesting that mechanisms independent of FOXO and Relish are at play.
Importantly, along with the partially normalized gene expression profile, we observed improved lipid metabolism when FOXO or Relish activity was reduced in atf3 mutants. While neither Relish nor FOXO heterozygosity affected lipid contents (see Fig. S5B in the supplemental material), the high TAG and DAG levels dropped to close to normal in atf376/Y foxo25J13/+ larvae (Fig. 8C). Reducing Rel function also restored wild-type levels of TAG and DAG caused by atf3 deficiency, but in addition, it significantly lowered the titer of free fatty acids. These results indicated that, besides transcriptional control of AMP genes, Relish may regulate lipid metabolism. Indeed, we found that relE20 larvae stored less TAG than wild-type larvae, whereas overexpression of an activated form of Relish (Rel-68) (68) using either FB-Gal4 or C7-Gal4 resulted in elevated TAG levels (Fig. 8D), thus mimicking the effect of atf3 mutation. The normalized gene expression and the recovery of lipid homeostasis upon lowering Relish activity correlated with increased survival of atf376/Y relE20/+ males compared to their atf376/Y TM6B/+ siblings (Fig. 8E). In contrast, we did not rescue adult eclosion by reducing the dose of foxo.
DISCUSSION
Atf3 role in the gut or fat body.
Loss of atf3 broadly altered the gene expression program of the third-instar Drosophila larvae. The extent of changes is not surprising, given that Atf3 proteins are bZIP transcription factors that dimerize with several members of the Jun subfamily capable of gene repression or activation depending on the cellular context (21). Atf3-Atf3 and Atf3-Jun dimers also occur in Drosophila (51). Mammalian ATF3 proteins influence other transcription factors, including NF-κB, Smad3, and p53 (58, 71). We therefore presume that the extensive alteration of gene expression in atf3 mutants resulted from a combined effect of multiple transcriptional regulators rather than Atf3 alone. Our transcriptome analyses in synthetic genotypes implicate Relish and FOXO in the complex transcriptional regulation by Atf3.
The changes in atf3 mutants primarily involved genes that have been functionally annotated with polysaccharide/chitin metabolisms and immune and stress responses. Some genes acting in lipid metabolism and starvation response also turned up. Although our RNA libraries were derived from whole larvae, the transcriptome analysis clearly highlighted genes active in the gut. Even the strong upregulation of starvation response lipase genes—lip3, formerly ascribed to the fat body (45), and CG6271—proved to arise from the gut (Fig. 3B). The atf3 mutant profile overlapped to a striking extent with gene expression changes induced in the adult gut by ingested pathogenic bacteria (8). Ingestion of wheat germ agglutinin (36) was another insult to the gut with a transcriptome signature matching atf3 deficiency. WGA disturbs PM integrity and permeability. Making the PM barrier less protective against pathogens and at the same time hindering nutrient uptake leads to infection and starvation (25). Therefore, not surprisingly, a number of PM-associated genes have been found to depend on Relish (8). In contrast to damage inflicted by WGA (36) and Ecc15 (1) bacteria, both the microvilli of the gut epithelium and the PM appeared intact in atf376 larvae (see Fig. S6 in the supplemental material). Still, enrichment for 23 mRNAs encoding PM components and proteins facilitating chitin and glycosaminoglycan (GAG) modification (Fig. 3A) indicates that by regulating PM-associated genes, Atf3 is important for proper functioning of the gut in immune defense and digestion. The GAG content is known to affect PM permeability (25), which might contribute to the malnutrition and retarded growth in atf376 larvae. Interestingly, loss of a chitin-binding protein, Drosocrystallin (Dcy), has been recently shown to compromise PM integrity in adult Drosophila flies (33). dcy mutants are sensitive to entomopathogenic bacteria, likely due to increased permeability of the PM, and they also activate the Imd immune pathway. Another anomaly of the atf3-deficient gut is an elevated count of natural commensal populations, with Acetobacter sp. being highly amplified (Fig. 4D and E). Growing evidence links intestinal microbiota with energy homeostasis and metabolic disorders, including obesity (55, 59). How the altered bacterial composition contributes to the atf3 mutant phenotype remains to be resolved.
The gene expression program of fed atf3 mutants partially overlapped (e.g., upregulated lip3 or CG6271) with transcriptional changes induced by starvation. However, some typical starvation response enzymes, such as phosphoenolpyruvate carboxykinase (PEPCK) or the TAG lipase Brummer, remained unchanged (Fig. 3B; see Data set S1 in the supplemental material) (19, 42, 75). Unlike under true starvation, the fed atf376 larvae had normal carbohydrate levels and accumulated surplus fat in markedly enlarged lipid droplets in their fat bodies instead of utilizing it to maintain energy balance. When actually deprived of food, they activated starvation response genes and depleted TAG reserves, indicating that the lipolytic control system (20) was functional.
Clearly, both the gut and the fat body express Atf3, and both are affected by its loss. A malfunctioning gut necessarily perturbs metabolism in the fat body (Fig. 9). Therefore, it is difficult to determine which of the two organs suffers the primary damage in the absence of Atf3. Based on the strong bias of the gene expression data, including expression of atf3 itself, toward the gut, we surmise that it is primarily the gut that is insulted. The ensuing quasistarvation response is then due to a combined effect of inadequate nutrition and energy shunting to sustain the chronic inflammatory response in atf3 mutants. We propose that the ectopic lipase activity misregulates lipid absorption and storage in enterocytes, resulting in excess DAG and FFA. DAG is taken up from the blood by the fat body and converted to TAG, causing lipid overload and obesity. The chronic elevation of DAG and FFA may further unbalance homeostasis due to their cytotoxic effects (Fig. 9). It is well established that FFA trigger cellular stress and inflammation mediated by JNK and NF-κB (54). Activation of JNK and FOXO (29) might exacerbate the deregulated metabolic balance and contribute to growth repression of atf3 mutant larvae.
Fig 9.
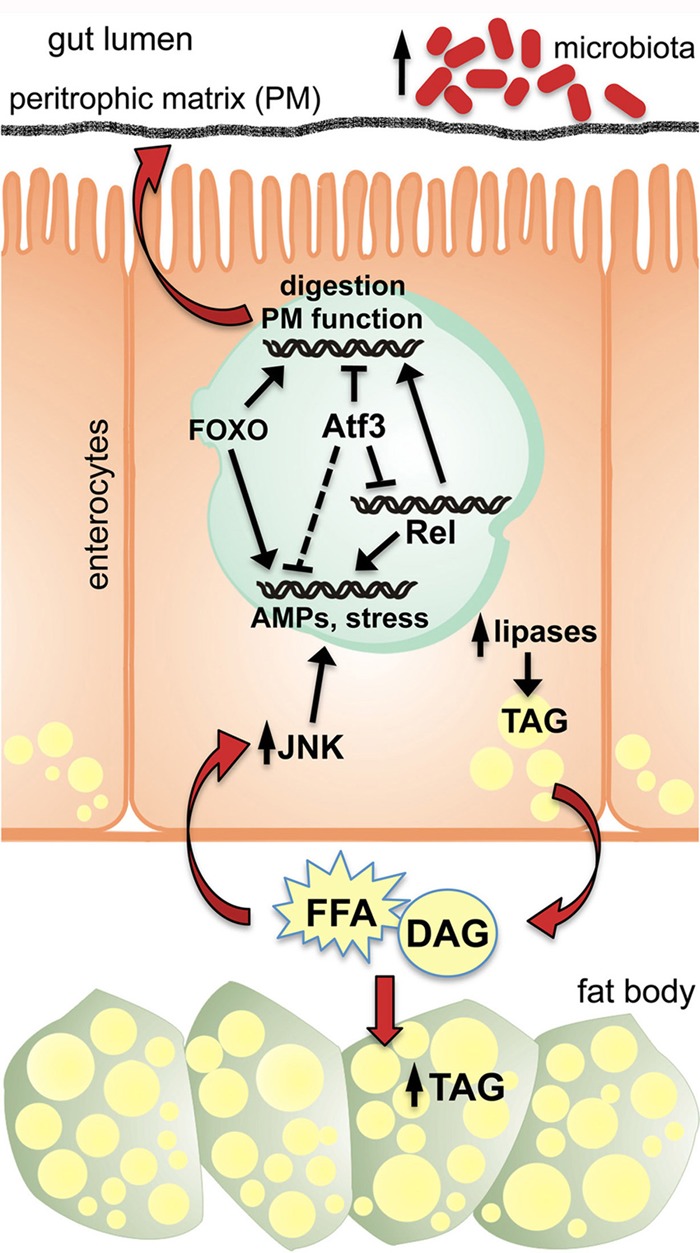
Model for Atf3 function in maintaining basal metabolic and immune system homeostasis in Drosophila larvae. Atf3 ensures the normal digestive and immune function of the gut by controlling appropriate expression of genes involved in PM composition. At the same time, Atf3 prevents the epithelial immune system from overreacting, at least partly through regulating Relish. Loss of Atf3 function causes chronic inflammation accompanied by stress and starvation responses that are mediated by JNK and FOXO signaling. Elevated activity of lipases in the gut may cause imbalance in nutrient utilization. The fat body takes up superfluous DAG and FFA and stores extra fat. An increase in the gut microbiota may further exacerbate defects in digestion, nutrient absorption, and immune system activity.
Link between immune and metabolic homeostasis.
Enhanced activity of Imd and Toll signaling effectors, such as Relish, AMPs, and IMs, in atf3 mutants coincided with activation of wound healing and the stress-inducible JNK pathway, producing a complex inflammatory response. This response arose even when the bacterial load was reduced by antibiotic treatment, suggesting that the normal role of Atf3 is to maintain a basal level of defense in the gut cells (Fig. 9). In the absence of Atf3, an unprovoked immune reaction ensues. Interestingly, an immune suppressor role for mouse ATF3 has emerged from a systems biology approach (17). When highly expressed, ATF3 suppresses proinflammatory genes downstream of TLR signaling, such as IL-6, IL-12b, and TNF-α, by recruiting a histone deacetylase to their promoters containing an ATF3 binding site (17, 67). Consequently, Atf3KO mice die under septic shock induced by lipopolysaccharide (LPS) injection, showing that ATF3 is required to prevent the immune system from overreacting once it has responded to a challenge (17). Our experiments show that even moderate gain of Atf3 in wild-type larvae represses transcription of the immune response genes relish and thor (Fig. 7A and B), while expression of both genes is elevated in atf3-deficient mutants (Fig. 6). Therefore, we propose that Atf3 curbs the innate immune response partly by controlling basal levels of Relish (Fig. 9). While the role of Drosophila Atf3 in immune homeostasis might parallel that of mammalian ATF3, the functional mechanism in flies remains to be determined.
Regulation of immune and starvation responses is intimately linked, as the effectors of immune (Relish) and IIS (FOXO) pathways regulate largely overlapping sets of genes (5, 15, 30, 70) (Fig. 8A) and should, therefore, be considered regulators of both metabolic and immune homeostasis. This is also evident from increased TAG levels upon Relish overexpression and lean relE20 mutant larvae (Fig. 8D) and starvation-sensitive relE20 adults (see Fig. S5C in the supplemental material). The fact that attenuated function of Relish or, to a lesser extent, FOXO can remedy the adverse consequences of Atf3 deficiency for both excessive fat storage and the chronic inflammatory response implies a functional interaction between Atf3 and signaling pathways that depend on Relish and FOXO. Atf3 appears to interact with a function of Relish that does not depend on the Imd pathway, since neither mutation in the IκB kinase (IKK) regulatory subunit IKKγ (kenny) nor expression of a negative Imd regulator, Pirk, improved the survival rate of atf3 mutants. Finally, in genetic experimentation with the relE20 allele, we were cautious about a second mutation affecting a gene, nmdmc, that encodes a NAD-dependent tetrahydrofolate dehydrogenase (24). Due to the complex metabolic phenotype of atf376 larvae, we cannot rule out an effect of the nmdmc mutation on the observed interaction with relE20.
An evolutionary parallel.
While atf3 is an essential single-copy gene in Drosophila, mammalian genomes encode two Atf3 orthologs, ATF3 and JDP2, neither of which is required for viability in mice (23, 41). However, the knockout mouse models implicated each gene in the maintenance of metabolic and immune homeostasis. As discussed above, ATF3 has been established as a negative modulator of the TLR-induced cytokine gene expression (17, 67). JDP2 is required to control lipid storage via regulation of adipocyte differentiation, and its loss leads to obesity (41). Human ATF3 and JDP2 are 430 to 450 amino acids shorter than the Drosophila protein, and sequence homology with fly Atf3 is appreciable only in the central 70 residues constituting the bZIP domain. We show that despite the limited similarity, expression of hATF3 in the gut and fat body in developing atf3 mutant larvae improves viability, reduces obesity, and partly restores the normal gene expression program, including downregulation of relish. As in mammals (28), atf3 itself can be induced by starvation in Drosophila. Compared to defects caused by strong gain of Drosophila Atf3 (reference 51 and this study), overexpression of hATF3 was not detrimental, suggesting that hATF3 lacks some functions of the fly protein. However, ectopic expression of ATF3 in the pancreas and liver in transgenic mice disturbed endocrine function and glucose homeostasis (2, 3). Therefore, fine-tuning of atf3 gene expression is critical for both mammals and flies. In summary, our results suggest that Drosophila Atf3 represents a common regulator of metabolic and immune homeostasis, a role comprising the functions of both duplicated mammalian proteins.
Supplementary Material
ACKNOWLEDGMENTS
We appreciate receiving fly stocks and reagents from Ernst Hafen, Linda Partridge, François Leulier, Tsonwin Hai, Ronald Kühnlein, Svenja Stöven, and Dominique Ferrandon. Other fly stocks were from the Bloomington Center (Bloomington, IN) and the VDRC (Vienna, Austria), and antibodies were from the DSHB (Iowa). We thank Miroslav Obornik for phylogeny of ATF3, Tomas Picek for assistance with gas chromatography, Vladimir Benes and Jonathon Blake for mRNA sequencing and help with initial data analysis, Sabrina Jung for technical help, and Martina Hajduskova for Fig. 9.
This work was supported by the Sofja Kovalevskaja Award, CECAD funds, and CRC 832 from the DFG (Germany) to M.U. J.R. was partly supported by project 204/09/H058 from the Czech Science Foundation.
We declare that we have no conflicts of interest.
Footnotes
Published ahead of print 30 July 2012
Supplemental material for this article may be found at http://mcb.asm.org/.
REFERENCES
- 1. Acosta Muniz C, Jaillard D, Lemaitre B, Boccard F. 2007. Erwinia carotovora Evf antagonizes the elimination of bacteria in the gut of Drosophila larvae. Cell. Microbiol. 9: 106– 119 [DOI] [PubMed] [Google Scholar]
- 2. Allen-Jennings AE, Hartman MG, Kociba GJ, Hai T. 2001. The roles of ATF3 in glucose homeostasis. A transgenic mouse model with liver dysfunction and defects in endocrine pancreas. J. Biol. Chem. 276: 29507– 29514 [DOI] [PubMed] [Google Scholar]
- 3. Allen-Jennings AE, Hartman MG, Kociba GJ, Hai T. 2002. The roles of ATF3 in liver dysfunction and the regulation of phosphoenolpyruvate carboxykinase gene expression. J. Biol. Chem. 277: 20020– 20025 [DOI] [PubMed] [Google Scholar]
- 4. Arakane Y, et al. 2005. The Tribolium chitin synthase genes TcCHS1 and TcCHS2 are specialized for synthesis of epidermal cuticle and midgut peritrophic matrix. Insect Mol. Biol. 14: 453– 463 [DOI] [PubMed] [Google Scholar]
- 5. Becker T, et al. 2010. FOXO-dependent regulation of innate immune homeostasis. Nature 463: 369– 373 [DOI] [PubMed] [Google Scholar]
- 6. Bernal A, Kimbrell DA. 2000. Drosophila Thor participates in host immune defense and connects a translational regulator with innate immunity. Proc. Natl. Acad. Sci. U. S. A. 97: 6019– 6024 [DOI] [PMC free article] [PubMed] [Google Scholar]
- 7. Bischof J, Maeda RK, Hediger M, Karch F, Basler K. 2007. An optimized transgenesis system for Drosophila using germ-line-specific phiC31 integrases. Proc. Natl. Acad. Sci. U. S. A. 104: 3312– 3317 [DOI] [PMC free article] [PubMed] [Google Scholar]
- 8. Buchon N, Broderick NA, Poidevin M, Pradervand S, Lemaitre B. 2009. Drosophila intestinal response to bacterial infection: activation of host defense and stem cell proliferation. Cell Host Microbe 5: 200– 211 [DOI] [PubMed] [Google Scholar]
- 9. Cai D, et al. 2005. Local and systemic insulin resistance resulting from hepatic activation of IKK-β and NF-κB. Nat. Med. 11: 183– 190 [DOI] [PMC free article] [PubMed] [Google Scholar]
- 10. Chintapalli VR, Wang J, Dow JAT. 2007. Using FlyAtlas to identify better Drosophila melanogaster models of human disease. Nat. Genet. 39: 715– 720 [DOI] [PubMed] [Google Scholar]
- 11. Cox CR, Gilmore MS. 2007. Native microbial colonization of Drosophila melanogaster and its use as a model of Enterococcus faecalis pathogenesis. Infect. Immun. 75: 1565– 1576 [DOI] [PMC free article] [PubMed] [Google Scholar]
- 12. Davis MM, Primrose DA, Hodgetts RB. 2008. A member of the p38 mitogen-activated protein kinase family is responsible for transcriptional induction of Dopa decarboxylase in the epidermis of Drosophila melanogaster during the innate immune response. Mol. Cell. Biol. 28: 4883– 4895 [DOI] [PMC free article] [PubMed] [Google Scholar]
- 13. De Gregorio E, Spellman PT, Tzou P, Rubin GM, Lemaitre B. 2002. The Toll and Imd pathways are the major regulators of the immune response in Drosophila. EMBO J. 21: 2568– 2579 [DOI] [PMC free article] [PubMed] [Google Scholar]
- 14. DiAngelo JR, Bland ML, Bambina S, Cherry S, Birnbaum MJ. 2009. The immune response attenuates growth and nutrient storage in Drosophila by reducing insulin signaling. Proc. Natl. Acad. Sci. U. S. A. 106: 20853– 20858 [DOI] [PMC free article] [PubMed] [Google Scholar]
- 15. Dionne MS, Pham LN, Shirasu-Hiza M, Schneider DS. 2006. Akt and FOXO dysregulation contribute to infection-induced wasting in Drosophila. Curr. Biol. 16: 1977– 1985 [DOI] [PubMed] [Google Scholar]
- 16. Edgar BA. 2006. How flies get their size: genetics meets physiology. Nat. Rev. Genet. 7: 907– 916 [DOI] [PubMed] [Google Scholar]
- 17. Gilchrist M, et al. 2006. Systems biology approaches identify ATF3 as a negative regulator of Toll-like receptor 4. Nature 441: 173– 178 [DOI] [PubMed] [Google Scholar]
- 18. Grönke S, Beller M, Fellert S, Ramakrishnan H, Jäckle H, Kühnlein RP. 2003. Control of fat storage by a Drosophila PAT domain protein. Curr. Biol. 13: 603– 606 [DOI] [PubMed] [Google Scholar]
- 19. Grönke S, et al. 2005. Brummer lipase is an evolutionary conserved fat storage regulator in Drosophila. Cell Metab. 1: 323– 330 [DOI] [PubMed] [Google Scholar]
- 20. Grönke S, et al. 2007. Dual lipolytic control of body fat storage and mobilization in Drosophila. PLoS Biol. 5: e137 doi:10.1371/journal.pbio.0050137 [DOI] [PMC free article] [PubMed] [Google Scholar]
- 21. Hai T, Wolfgang C, Marsee D, Allen A, Sivaprasad U. 1999. ATF3 and stress responses. Gene Expr. 7:321– 335 [PMC free article] [PubMed] [Google Scholar]
- 22. Hai T, Wolford CC, Chang Y-S. 2010. ATF3, a hub of the cellular adaptive-response network, in the pathogenesis of diseases: is modulation of inflammation a unifying component? Gene Expr. 15: 1– 11 [DOI] [PMC free article] [PubMed] [Google Scholar]
- 23. Hartman MG, et al. 2004. Role for activating transcription factor 3 in stress-induced β-cell apoptosis. Mol. Cell. Biol. 24: 5721– 5732 [DOI] [PMC free article] [PubMed] [Google Scholar]
- 24. Hedengren M, et al. 1999. Relish, a central factor in the control of humoral but not cellular immunity in Drosophila. Mol. Cell 4: 827– 837 [DOI] [PubMed] [Google Scholar]
- 25. Hegedus D, Erlandson M, Gillott C, Toprak U. 2009. New insights into peritrophic matrix synthesis, architecture, and function. Annu. Rev. Entomol. 54: 285– 302 [DOI] [PubMed] [Google Scholar]
- 26. Huang DW, Sherman BT, Lempicki RA. 2009. Systematic and integrative analysis of large gene lists using DAVID bioinformatics resources. Nat. Protoc. 4: 44– 57 [DOI] [PubMed] [Google Scholar]
- 27. Hull-Thompson J, et al. 2009. Control of metabolic homeostasis by stress signaling is mediated by the lipocalin NLaz. PLoS Genet. 5: e1000460 doi:10.1371/journal.pgen.1000460 [DOI] [PMC free article] [PubMed] [Google Scholar]
- 28. Jiang HY, et al. 2004. Activating transcription factor 3 is integral to the eukaryotic initiation factor 2 kinase stress response. Mol. Cell. Biol. 24:1365– 1377 [DOI] [PMC free article] [PubMed] [Google Scholar]
- 29. Karpac J, Jasper H. 2009. Insulin and JNK: optimizing metabolic homeostasis and lifespan. Trends Endocrinol. Metab. 20: 100– 106 [DOI] [PMC free article] [PubMed] [Google Scholar]
- 30. Karpac J, Younger A, Jasper H. 2011. Dynamic coordination of innate immune signaling and insulin signaling regulates systemic responses to localized DNA damage. Dev. Cell 20: 841– 854 [DOI] [PMC free article] [PubMed] [Google Scholar]
- 31. Kleino A, et al. 2008. Pirk is a negative regulator of the Drosophila Imd pathway. J. Immunol. 180: 5413– 5422 [DOI] [PubMed] [Google Scholar]
- 32. Kotler DP. 2000. Cachexia. Ann. Intern. Med. 133: 622– 634 [DOI] [PubMed] [Google Scholar]
- 33. Kuraishi T, Binggeli O, Opota O, Buchon N, Lemaitre B. 2011. Genetic evidence for a protective role of the peritrophic matrix against intestinal bacterial infection in Drosophila melanogaster. Proc. Natl. Acad. Sci. U. S. A. 108: 15966– 15971 [DOI] [PMC free article] [PubMed] [Google Scholar]
- 34. Lee EC, et al. 2001. A highly efficient Escherichia coli-based chromosome engineering system adapted for recombinogenic targeting and subcloning of BAC DNA. Genomics 73: 56– 65 [DOI] [PubMed] [Google Scholar]
- 35. Lemaitre B, Hoffmann J. 2007. The host defense of Drosophila melanogaster. Annu. Rev. Immunol. 25: 697– 743 [DOI] [PubMed] [Google Scholar]
- 36. Li H-M, et al. 2009. Transcriptional signatures in response to wheat germ agglutinin and starvation in Drosophila melanogaster larval midgut. Insect Mol. Biol. 18: 21– 31 [DOI] [PubMed] [Google Scholar]
- 37. Livak KJ, Schmittgen TD. 2001. Analysis of relative gene expression data using real-time quantitative PCR and the 2(-Delta Delta C(T)) method. Methods 25: 402– 408 [DOI] [PubMed] [Google Scholar]
- 38. Lyne R, et al. 2007. FlyMine: an integrated database for Drosophila and Anopheles genomics. Genome Biol. 8: R129. [DOI] [PMC free article] [PubMed] [Google Scholar]
- 39. Macdonald TT, Monteleone G. 2005. Immunity, inflammation, and allergy in the gut. Science 307: 1920– 1925 [DOI] [PubMed] [Google Scholar]
- 40. Martín-Blanco E, et al. 1998. Puckered encodes a phosphatase that mediates a feedback loop regulating JNK activity during dorsal closure in Drosophila. Genes Dev. 12: 557– 570 [DOI] [PMC free article] [PubMed] [Google Scholar]
- 41. Nakade K, et al. 2007. JDP2 suppresses adipocyte differentiation by regulating histone acetylation. Cell Death Differ. 14: 1398– 1405 [DOI] [PubMed] [Google Scholar]
- 42. Palanker L, Tennessen JM, Lam G, Thummel CS. 2009. Drosophila HNF4 regulates lipid mobilization and β-oxidation. Cell Metab. 9: 228– 239 [DOI] [PMC free article] [PubMed] [Google Scholar]
- 43. Pasparakis M. 2008. IKK/NF-κB signaling in intestinal epithelial cells controls immune homeostasis in the gut. Mucosal Immunol. 1(Suppl. 1):S54–S57 [DOI] [PubMed] [Google Scholar]
- 44. Peters W. 1992. Peritrophic membranes. Springer-Verlag, Berlin, Germany [Google Scholar]
- 45. Pistillo D, et al. 1998. The Drosophila melanogaster lipase homologs: a gene family with tissue and developmental specific expression. J. Mol. Biol. 276: 877– 885 [DOI] [PubMed] [Google Scholar]
- 46. Ren C, Webster P, Finkel SE, Tower J. 2007. Increased internal and external bacterial load during Drosophila aging without life-span trade-off. Cell Metab. 6: 144– 152 [DOI] [PubMed] [Google Scholar]
- 47. Royet J. 2011. Epithelial homeostasis and the underlying molecular mechanisms in the gut of the insect model Drosophila melanogaster. Cell. Mol. Life Sci. 68: 3651– 3660 [DOI] [PMC free article] [PubMed] [Google Scholar]
- 48. Rutschmann S, et al. 2000. Role of Drosophila IKKγ in a Toll-independent antibacterial immune response. Nat. Immunol. 1: 342– 347 [DOI] [PubMed] [Google Scholar]
- 49. Ryu J-H, et al. 2008. Innate immune homeostasis by the homeobox gene caudal and commensal-gut mutualism in Drosophila. Science 319: 777– 782 [DOI] [PubMed] [Google Scholar]
- 50. Sarov M, et al. 2006. A recombineering pipeline for functional genomics applied to Caenorhabditis elegans. Nat. Methods 3: 839– 844 [DOI] [PubMed] [Google Scholar]
- 51. Sekyrova P, Bohmann D, Jindra M, Uhlirova M. 2010. Interaction between Drosophila bZIP proteins Atf3 and Jun prevents replacement of epithelial cells during metamorphosis. Development 137: 141– 150 [DOI] [PMC free article] [PubMed] [Google Scholar]
- 52. Signorelli P, Hannun YA. 2002. Methods in enzymology. Elsevier, Philadelphia, PA: [DOI] [PubMed] [Google Scholar]
- 53. Slack C, Giannakou ME, Foley A, Goss M, Partridge L. 2011. dFOXO-independent effects of reduced insulin-like signaling in Drosophila. Aging Cell 10: 735– 748 [DOI] [PMC free article] [PubMed] [Google Scholar]
- 54. Solinas G, Karin M. 2010. JNK1 and IKKβ: molecular links between obesity and metabolic dysfunction. FASEB J. 24: 2596– 2611 [DOI] [PubMed] [Google Scholar]
- 55. Storelli G, et al. 2011. Lactobacillus plantarum promotes Drosophila systemic growth by modulating hormonal signals through TOR-dependent nutrient sensing. Cell Metab. 14: 403– 414 [DOI] [PubMed] [Google Scholar]
- 56. Teleman A. 2010. Molecular mechanisms of metabolic regulation by insulin in Drosophila. Biochem. J. 425: 13– 26 [DOI] [PubMed] [Google Scholar]
- 57. Teleman AA, Chen Y-W, Cohen SM. 2005. 4E-BP functions as a metabolic brake used under stress conditions but not during normal growth. Genes Dev. 19: 1844– 1848 [DOI] [PMC free article] [PubMed] [Google Scholar]
- 58. Thompson MR, Xu D, Williams BRG. 2009. ATF3 transcription factor and its emerging roles in immunity and cancer. J. Mol. Med. 87: 1053– 1060 [DOI] [PMC free article] [PubMed] [Google Scholar]
- 59. Tilg H, Kaser A. 2011. Gut microbiome, obesity, and metabolic dysfunction. J. Clin. Invest. 121: 2126– 2132 [DOI] [PMC free article] [PubMed] [Google Scholar]
- 60. Trapnell C, Pachter L, Salzberg SL. 2009. TopHat: discovering splice junctions with RNA-Seq. Bioinformatics 25: 1105– 1111 [DOI] [PMC free article] [PubMed] [Google Scholar]
- 61. Trapnell C, et al. 2010. Transcript assembly and quantification by RNA-Seq reveals unannotated transcripts and isoform switching during cell differentiation. Nat. Biotechnol. 28: 511– 515 [DOI] [PMC free article] [PubMed] [Google Scholar]
- 62. Tzou P, et al. 2000. Tissue-specific inducible expression of antimicrobial peptide genes in Drosophila surface epithelia. Immunity 13: 737– 748 [DOI] [PubMed] [Google Scholar]
- 63. Venken KJT, et al. 2009. Versatile P[acman] BAC libraries for transgenesis studies in Drosophila melanogaster. Nat. Methods 6: 431– 434 [DOI] [PMC free article] [PubMed] [Google Scholar]
- 64. Vihervaara T, Puig O. 2008. dFOXO regulates transcription of a Drosophila acid lipase. J. Mol. Biol. 376: 1215– 1223 [DOI] [PubMed] [Google Scholar]
- 65. Wang T, Hung CCY, Randall DJ. 2006. The comparative physiology of food deprivation: from feast to famine. Annu. Rev. Physiol. 68: 223– 251 [DOI] [PubMed] [Google Scholar]
- 66. Weisburg WG, Barns SM, Pelletier DA, Lane DJ. 1991. 16S ribosomal DNA amplification for phylogenetic study. J. Bacteriol. 173: 697– 703 [DOI] [PMC free article] [PubMed] [Google Scholar]
- 67. Whitmore MM, et al. 2007. Negative regulation of TLR-signaling pathways by activating transcription factor-3. J. Immunol. 179: 3622– 3630 [DOI] [PubMed] [Google Scholar]
- 68. Wiklund M-L, Steinert S, Junell A, Hultmark D, Stöven S. 2009. The N-terminal half of the Drosophila Rel/NF-κB factor Relish, REL-68, constitutively activates transcription of specific Relish target genes. Dev. Comp. Immunol. 33: 690– 696 [DOI] [PubMed] [Google Scholar]
- 69. Wolowczuk I, et al. 2008. Feeding our immune system: impact on metabolism. Clin. Dev. Immunol. 2008: 1– 19 doi:10.1155/2008/639803 [DOI] [PMC free article] [PubMed] [Google Scholar]
- 70. Wu J, Randle KE, Wu LP. 2007. ird1 is a Vps15 homologue important for antibacterial immune responses in Drosophila. Cell Microbiol. 9: 1073– 1085 [DOI] [PubMed] [Google Scholar]
- 71. Yan C, Lu D, Hai T, Boyd DD. 2005. Activating transcription factor 3, a stress sensor, activates p53 by blocking its ubiquitination. EMBO J. 24: 2425– 2435 [DOI] [PMC free article] [PubMed] [Google Scholar]
- 72. Yao JK, Rastetter GM. 1985. Microanalysis of complex tissue lipids by high-performance thin-layer chromatography. Anal. Biochem. 150: 111– 116 [DOI] [PubMed] [Google Scholar]
- 73. Yuan M, et al. 2001. Reversal of obesity- and diet-induced insulin resistance with salicylates or targeted disruption of Ikkβ. Science 293: 1673– 1677 [DOI] [PubMed] [Google Scholar]
- 74. Zinke I, Kirchner C, Chao LC, Tetzlaff MT, Pankratz MJ. 1999. Suppression of food intake and growth by amino acids in Drosophila: the role of pumpless, a fat body expressed gene with homology to vertebrate glycine cleavage system. Development 126: 5275– 5284 [DOI] [PubMed] [Google Scholar]
- 75. Zinke I, Schütz CS, Katzenberger JD, Bauer M, Pankratz MJ. 2002. Nutrient control of gene expression in Drosophila: microarray analysis of starvation and sugar-dependent response. EMBO J. 21: 6162– 6173 [DOI] [PMC free article] [PubMed] [Google Scholar]
- 76. Zmuda EJ, et al. 2010. The roles of ATF3, an adaptive-response gene, in high-fat-diet-induced diabetes and pancreatic-cell dysfunction. Mol. Endocrinol. 24: 1423– 1433 [DOI] [PMC free article] [PubMed] [Google Scholar]
- 77. Zuberova M, Fenckova M, Simek P, Janeckova L, Dolezal T. 2010. Increased extracellular adenosine in Drosophila that are deficient in adenosine deaminase activates a release of energy stores leading to wasting and death. Dis. Model Mech. 3: 773– 784 [DOI] [PubMed] [Google Scholar]
Associated Data
This section collects any data citations, data availability statements, or supplementary materials included in this article.