Abstract
Signaling downstream of mechanistic target of rapamycin complexes 1 and 2 (mTORC1 and mTORC2) controls specific and distinct aspects of insulin action and nutrient homeostasis in an interconnected and as yet unclear way. Mice lacking the mTORC1 substrate S6 kinase 1 (S6K1) maintain proper glycemic control with a high-fat diet. This phenotype is accompanied by insulin hypersensitivity, Akt- and AMP-activated kinase upregulation, and increased lipolysis in adipose tissue and skeletal muscle. Here, we show that, when S6K1 inactivation is combined with the deletion of the mTORC2 substrate Akt2, glucose homeostasis is compromised due to defects in both insulin action and β-cell function. After a high-fat diet, the S6K1−/− Akt2−/− double-mutant mice do not become obese, though they are severely hyperglycemic. Our data demonstrate that S6K1 is required for pancreatic β-cell growth and function during adaptation to insulin resistance states. Strikingly, the inactivation of two targets of mTOR and phosphatidylinositol 3-kinase signaling is sufficient to reproduce major hallmarks of type 2 diabetes.
INTRODUCTION
The activation of S6 kinase 1 (S6K1) by the mammalian target of rapamycin (mTOR; now officially called mechanistic target of rapamycin) signals food abundance and adapts organismal growth, metabolism, and life span to the environmental cues (40). S6K1 is phosphorylated by mTOR complex 1 (mTORC1) under the control of the small GTPase families Rheb and Rag, which transduce signals from growth factor peptides (e.g., insulin and insulin-like growth factors) and nutrients (e.g., amino acids and glucose), respectively (18). Strikingly S6K loss-of-function mutant mice, flies, and worms mimic specific features of a caloric restriction state. The body size of mutants is small throughout development to adult life (33). In addition, S6K1-deficient mice fed with a high-fat diet (HFD) do not gain weight and are protected against obesity (36). These defects of adipose tissue in storing fat are ascribed to increased lipolysis and mitochondrial uncoupling, in combination with a lack of adipose precursor cell proliferation (4, 36). S6K1-deficient skeletal muscles and pancreatic β cells are resistant to mass loss after starvation (1, 23, 26). Finally, S6K inactivation in mice and worms promotes longevity, an effect on the life span that is also triggered by caloric restriction and by the allosteric mTORC1 inhibitor rapamycin (13, 24, 31). Thus, genetic, nutritional, or pharmacological interventions that downregulate mTORC1/S6K1 signaling have potentially interesting outcomes to fight obesity, metabolic syndromes, and ageing.
At the molecular level, the mTORC1/S6K1 cassette is involved in negative-feedback mechanisms that are triggered by overnutrition and that downregulate further nutrient uptake. One putative molecular mechanism is the phosphorylation by S6K1 of insulin receptor substrate 1 (IRS1) on serine/threonine residues, which negatively affects insulin action (12, 32). S6K1 also phosphorylates partners of mTOR complexes, notably mTOR itself and the mTORC2 component Rictor, suggesting additional targets for feedback regulation of insulin and mTOR signaling by S6K1 (8, 14, 16, 35). Consequently, inhibition of S6K1 upregulates the activity of Akt, a major kinase family downstream of the phosphatidylinositol 3-kinase (PI3K) and mTORC2 pathways that mediates multiple metabolic actions of insulin, including glucose uptake, glycogen synthesis, lipid synthesis, and suppression of gluconeogenesis (21). mTORC1/S6K1 signaling may affect another major pathway stimulating nutrient uptake. By affecting the AMP-to-ATP ratio, mTORC1/S6K1 negatively regulates the AMP-activated kinase (AMPK), which is involved in glucose uptake after endurance exercise (1, 27). Of note, the upregulation of AMPK has been implicated in the beneficial effect of S6K inhibition on life span and age-related diseases (31). Thus, inhibition of the S6K1 branch of mTORC1 signaling may ameliorate insulin sensitivity and glycemic control in multiple ways.
To evaluate a possible improvement of glucose homeostasis by S6K1 inhibition and interaction with other components of insulin signal transduction, we challenged S6K1-deficient mice with genetic and nutritional models of insulin resistance by combining Akt2 gene deletion and feeding mice on an HFD. Akt2-deficient mice display mild glucose intolerance and insulin resistance due to a partial defect in glucose uptake in peripheral tissues and an increased hepatic glucose output, which is compensated for by pancreatic β-cell growth and hyperinsulinemia (5, 19). Strikingly, we found that the combined deletion of S6K1 and Akt2 deteriorates glucose tolerance. Surprisingly, this defect is especially evident after an HFD, despite the lack of obesity in S6K1−/− Akt2−/− mice. Our data point to the complementary actions of S6K1 and Akt2 kinases in the control of glucose homeostasis, highlighting the essential role of S6K1 in the growth adaptations of pancreatic β cells in insulin resistance states. Thus, we provide evidence for a polygenic model of type 2 diabetes in which two loss-of-function mutations in downstream targets of PI3K and mTOR alter the physiological responses of insulin sensitivity and β-cell function, leading to the onset of the disease.
MATERIALS AND METHODS
Animals.
Both S6K1 and Akt2 gene deletions were in the C57BL/6 genetic background. The generation of C57BL/6 S6K1−/− mice has been previously described (33). C57BL/6 Akt2−/− mice were generated by 10 backcrosses with Akt2+/− 129/svj (5) and C57BL/6 wild-type (WT) mice. The S6K1−/− and Akt2−/− strains were crossed to obtain S6K1+/− Akt2+/− mice, which were intercrossed. The mice were housed in plastic cages and maintained at 22°C with a 12-hour dark/12-hour light cycle and had free access to food. All animal studies were approved by the Direction Départementale des Services Vétérinaires, Préfecture de Police, Paris, France (authorization number 75-1313). All experiments were performed on males. Two-month-old animals were fed either a control standard chow diet (Teklad global protein diet; 20% protein, 75% carbohydrate, 5% fat) or a high-fat diet (Diet D12492; Researchdiets; 20% protein, 20% carbohydrate, and 60% fat) for 16 weeks. Food intake was measured every second day for 15 consecutive days. For streptozotocine treatment, mice were injected with 40 mg/kg of body weight of streptozotocine for 5 consecutive days.
Metabolic studies.
After an overnight fast for the 3- and 12-month-old mice or a 3-h fast for HFD-fed mice, blood was collected from the tail vein for determination of glucose levels with a Glucotrend glucometer (Roche Diagnostics). At 3 and 12 months, a glucose tolerance test was performed after an overnight fast. The mice were intraperitoneally injected with 2 g/kg glucose, and blood was collected from the tail vein for determination of glucose levels. At 6 months, a glucose tolerance test upon lean mass was performed after an overnight fast. Mice were intraperitoneally injected with 2 g glucose/kg of lean mass, and blood was collected from the tail vein for determination of glucose levels. To test for insulin resistance, at 3 or 12 months or after 12 weeks of HFD, an insulin tolerance test was performed. Three- and 12-month-old mice that fasted overnight or HFD-fed mice that fasted for 3 h were intraperitoneally injected with 1 U insulin/kg (Actrapid), and the glucose concentration in whole blood from the tail vein was measured at 0, 15, 30, and 60 min. At 3 and 12 months, insulin levels were measured by enzyme-linked immunosorbent assay (ELISA) after an overnight fast (Crystal Chem., Inc.).
Liver triglyceride measurement.
Powdered liver tissue (50 to 100 mg) was used for acetone extraction. Triglyceride levels were determined using a Triglycerides FS Kit (Diasys) according to the manufacturer's instructions.
Oil red O staining.
Frozen sections of the liver, gastrocnemius, and pancreas were stained with Oil red O and counterstained with hematoxylin.
RNA extraction and RT-qPCR.
Total RNAs were prepared from liver tissue. A piece of frozen liver was homogenized in 3 ml of the lysis solution (4 M guanidinium thiocyanate, 25 mM sodium citrate, 0.5% sarcosyl, 100 mM 2-mercaptoethanol, pH 7), and total RNA was extracted as described previously (6). Total RNA from hepatocytes was isolated using an RNeasy Mini Kit (Qiagen) according to the manufacturer's instructions. Single-stranded cDNA was synthesized from 1 μg of total RNA with random hexamer primers and SuperScript II (Invitrogen). Real-time quantitative PCR (RT-qPCR) was performed with a Stratagene instrument (Stratagene) according to the manufacturer's instructions using SYBR green PCR Master Mix (Stratagene). We determined the relative amounts of the mRNAs studied by means of the 2−ΔΔCT method, with the beta-glucuronidase (GUS) gene as the reference gene and WT samples as the invariant controls for all studies. The murine primer sequences used were GUS sense, 5′-TGGTATGAACGGGAAGCAATC-3′, and antisense, 5′-AATCCCATTCACCCACACAACT-3′; G6PC sense, 5′-ATGAACATTCTCCATGACTTTGGG-3′, and antisense, 5′-GACAGGGAACTGCTTTATTATAGG-3′; and GCK sense, 5′-TGAGCCGGATGCAGAAGGA-3′, and antisense, 5′-CTCCCAGGTCTAAGGAGAGAAA-3′. The results of RT-qPCR are given in arbitrary units and expressed as fold changes in mRNA levels relative to wild-type controls.
Hepatocyte culture.
Primary hepatocytes were isolated from mice by the collagenase perfusion method as described previously (9). Cells (5 × 10⁵) were plated in 6-well plates in William's medium (Invitrogen) supplemented with 10% fetal bovine serum (FBS), insulin (4 μg/ml), bovine serum albumin (BSA) (1 mg/ml), 10 units/ml penicillin, 10 g/ml streptomycin, 0.5 μg/ml Fungizone, and 25 nM dexamethasone (Sigma). Hepatocytes were kept in full medium for 48 h before protein and RNA extractions.
Western blotting.
Cells were rinsed twice with ice-cold phosphate-buffered saline (PBS) and lysed in ice-cold lysis buffer (20 mM Tris-HCl [pH 8.0], 138 mM NaCl, 2.7 mM KCl, 5 mM EDTA, 20 mM NaF, 5% glycerol, 1% NP-40) in the presence of complete protease inhibitor cocktail tablets (Roche) and phosphatase inhibitor cocktail tablets (Phospho Stop; Roche). To remove cell debris, homogenates were spun at 12,000 rpm for 10 min at 4°C. Protein extracts were resolved by SDS-PAGE before transfer onto a polyvinylidene difluoride (PVDF) membrane and incubated with anti-G6PC (a gift from G. Mithieux, INSERM U855), anti-α-tubulin (Sigma).
Immunohistochemistry and morphometric analysis.
Pancreases were dissected, fixed overnight in 4% paraformaldehyde, weighed, embedded in paraffin, and cut into 5-μm-thick sections. For the quantification of the endocrine mass, three sections per pancreas, from three distinct levels more than 200 μm apart, were immunostained with anti-insulin antibody (Dako) and counterstained with hematoxylin. Pictures of all sections were analyzed using National Institutes of Health (NIH) Image J software (v1.31, which is freely available at http://rsb.info.nih.gov/ij/index.html) to quantify the β-cell area versus the total pancreas area. The percentage of β-cell area in the section was determined by dividing the area of all insulin-positive cells by the total surface area of the section. The β-cell mass was calculated by multiplying the pancreas weight by the percent β-cell area to get the absolute endocrine mass. For determination of β-cell density, pancreas sections were stained with eosin-hematoxylin. The β-cell density was assessed by counting the nuclei in a 1,720-μm2 islet area. Between 3 and 26 areas, depending on the islet size, were counted in a minimum of 5 islets per mouse. More than 3 mice per genotype and per diet were analyzed, representing more than 5,500 nuclei counted per condition. For the determination of the proliferation rate of β cells, a minimum of 2 pancreas sections per mouse, from distinct levels more than 200 μm apart, were immunostained with anti-Ki67 antibody (Neomarker) and counterstained with hematoxylin. The proliferation of β cells was assessed by counting Ki67-positive cells over total endocrine cells. More than 6 mice per genotype and per diet were analyzed, representing more than 7,000 endocrine cells counted per condition. A terminal deoxynucleotidyltransferase-mediated dUTP-biotin nick end-labeling (TUNEL) assay was performed with the ApopTag peroxidase in situ apoptosis detection kit (Millipore) according to the manufacturer's instructions.
Statistical analysis.
Statistical analysis was performed with Prism software (Graphpad Software) using one-way analysis of variance (ANOVA) with a Newman-Keuls posttest. An unpaired Student's t test was performed when only two conditions were studied. P values of less than 0.05 were considered significant. Statistical analyses were performed on the log10 values for insulinemia and endocrine mass measurements. All values are expressed as means and standard errors of the mean (SEM).
RESULTS
S6K1−/− Akt2−/− mice are hyperglycemic and glucose intolerant.
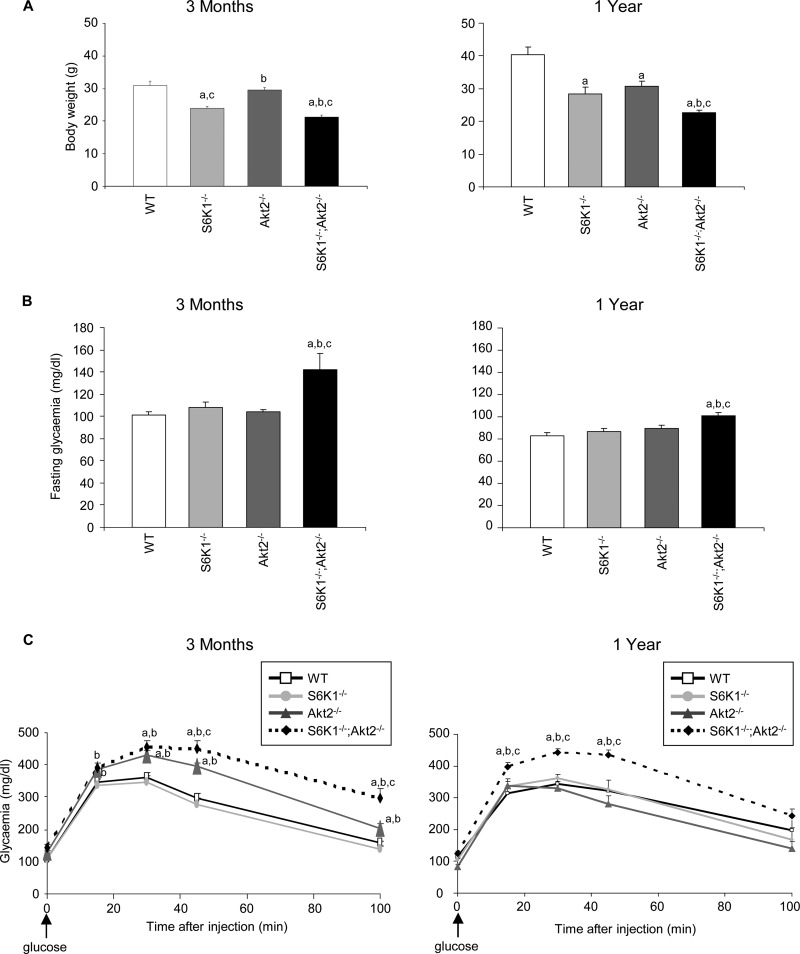
We crossed the S6K1−/− and Akt2−/− strains to obtain S6K1+/− Akt2+/− mice, which were intercrossed. S6K1−/− Akt2−/− mice were born at the expected Mendelian ratio in the progeny from these crosses. Adult mice were viable and were compared to wild-type, S6K1−/−, and Akt2−/− mice at two different ages, i.e., 3 months and 1 year old. As previously reported (33), S6K1 gene deletion caused a 20 to 30% reduction in body weight compared to the wild type, while the effect of Akt2 deletion was mild in young mice and became more pronounced in old mice (Fig. 1A). The combination of both gene deletions further decreased body weight, though the effect was less than additive, indicating that S6K1 and Akt2 control body weight by overlapping yet distinct mechanisms.
Fig 1.
S6K1−/− Akt2−/− mice are hyperglycemic and glucose intolerant. (A) Body weights in 3-month-old (left) and 1-year-old (right) mice of the indicated genotypes (n ≥ 4). (B) Glucose levels after an overnight fast in 3-month-old (left) and 1-year-old (right) mice of the indicated genotypes (n ≥ 10). (C) Glucose tolerance test after intraperitoneal injection of glucose in 3-month-old (left) and 1-year-old (right) mice of the indicated genotypes (n ≥ 5). All values are expressed as means and SEM. a, P < 0.05 versus the wild-type group; b, P < 0.05 versus the S6K1−/− group; c, P < 0.05 versus the Akt2−/− group.
To assess glucose homeostasis, we measured blood glucose levels after an overnight fast and during a glucose load. S6K1−/− Akt2−/− mice were slightly hyperglycemic while fasting compared to the other genotypes (Fig. 1B). After the intraperitoneal injection of glucose at a dose of 2 g/kg, Akt2-deficient mice were mildly glucose intolerant at 3 months of age, but not at 1 year of age (Fig. 1C). However, the combined deletion of S6K1 in the Akt2−/− background deteriorated glucose tolerance at both ages, demonstrating the need for both signaling elements in the proper maintenance of glucose homeostasis.
Lack of ectopic fat deposition in the mutant mouse lines.
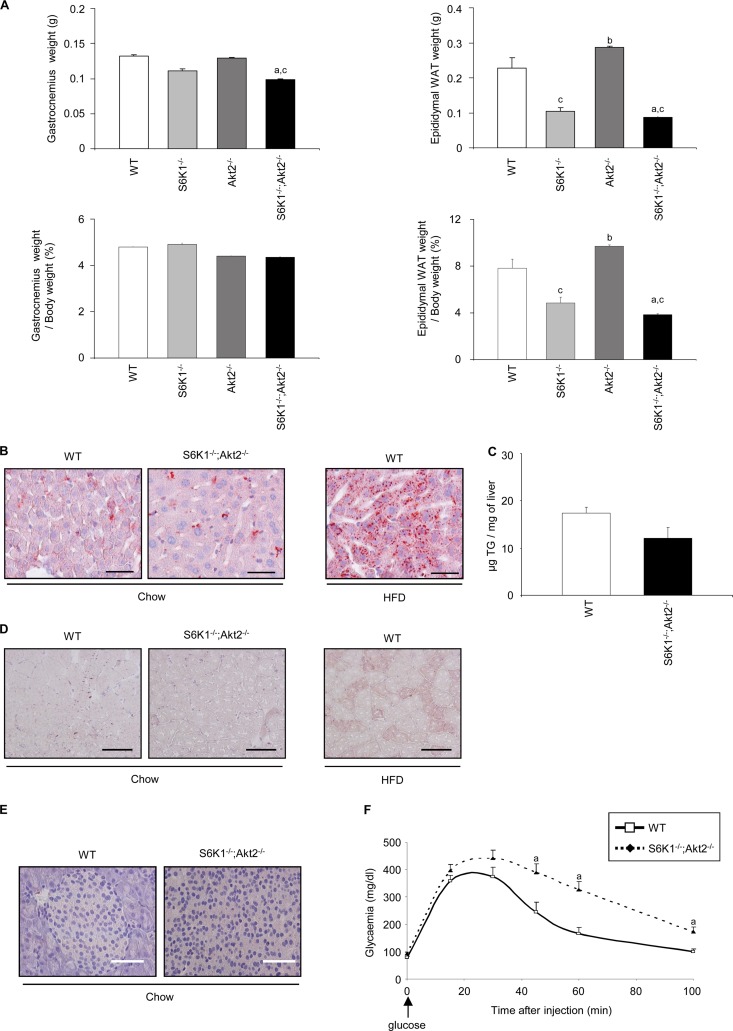
Given the reduced whole-body weight of the S6K1 and Akt2 mutant mice, we measured gastrocnemius muscle and epididymal adipose tissue weights as an indication of lean and fat mass, respectively. As shown in Fig. 2A, the reduction of gastrocnemius weight in the mutant mice compared to wild-type controls was proportional to the changes in whole-body weight. Conversely, the epididymal fat mass was decreased in S6K1−/− and S6K1−/− Akt2−/− mice even after normalization to the whole-body mass. To evaluate the possibility of ectopic fat deposition, lipid accumulation was analyzed by histology or biochemical assays in liver, skeletal muscle, and pancreas from single-mutant (data not shown) and double-mutant (Fig. 2B, C, D, and E) mice. The presence of lipid droplets, as assessed by Oil red O staining (Fig. 2B) and triglyceride levels (Fig. 2C), did not differ in S6K1−/− Akt2−/− livers and the wild type. Similarly, we did not detect abnormal fat accumulation in double-mutant skeletal muscle and pancreas (Fig. 2D and E). Similar results were obtained with S6K1−/− and Akt2−/− single-mutant tissues (data not shown). The lack of ectopic fat deposition in S6K1−/− Akt2−/− mice is consistent with increased lipolysis in white adipose tissues and elevated oxygen consumption in S6K1−/− mice (36). Finally, a glucose tolerance test was performed, taking into account the difference in lean mass, as recommended (3). When the dose of glucose was indexed over the lean mass as measured by dual-energy X-ray absorptiometry densitometry, S6K1−/− Akt2−/− mice were still glucose intolerant compared to the wild type (Fig. 2F).
Fig 2.
Reduced adiposity in S6K1−/− Akt2−/− mice. (A) Absolute weights (top) and weights normalized over body weight (bottom) of gastrocnemius and epididymal adipose tissues of 6-month-old mice of the indicated genotypes starved for 6 h (n ≥ 5). (B) Oil red O staining of frozen liver sections from wild-type or S6K1−/− Akt2−/− mice starved for 6 h (scale bars, 50 μm). Liver sections from mice fed a high-fat diet for 16 weeks were used as positive controls. (C) Triglyceride concentration in liver tissue of wild-type or S6K1−/− Akt2−/− mice starved for 6 h (n ≥ 6). (D) Oil red O staining of frozen gastrocnemius sections from wild-type or S6K1−/− Akt2−/− mice starved for 6 h. Gastrocnemius sections from mice fed a high-fat diet for 16 weeks were used as positive controls (scale bars, 100 μm). (E) Oil red O staining of frozen pancreas sections from wild-type or S6K1−/− Akt2−/− mice starved for 6 h (scale bars, 50 μm). (F) Glucose tolerance test after intraperitoneal injection of glucose indexed over lean mass in 6-month-old mice of the indicated genotypes (n ≥ 7). All values are expressed as means and SEM. a, P < 0.05 versus the wild-type group; b, P < 0.05 versus the S6K1−/− group; c, P < 0.05 versus the Akt2−/− group.
S6K1−/− Akt2−/− mice have impaired insulin sensitivity.
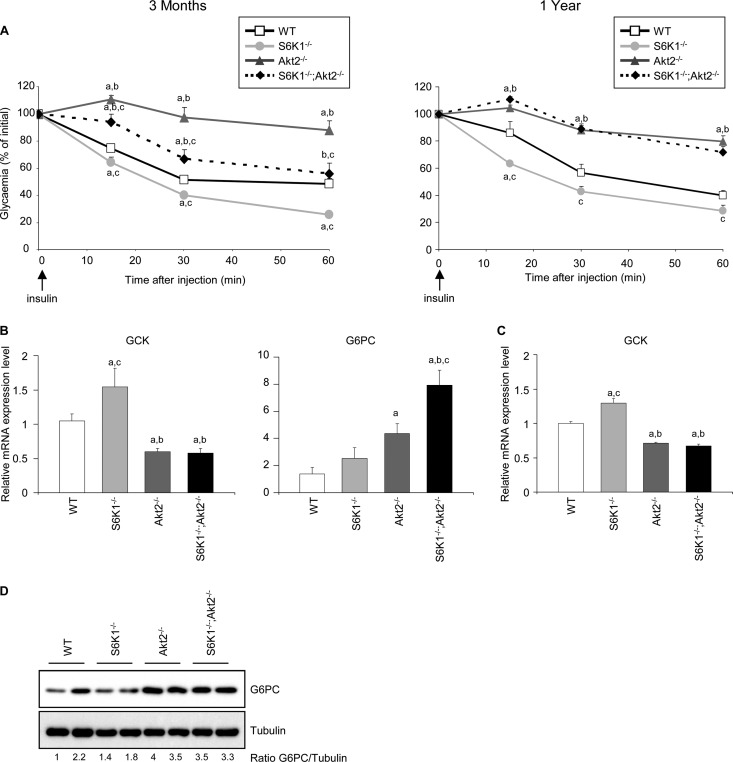
To address the cause of hyperglycemia in the S6K1−/− Akt2−/− mice, the hypoglycemic action of insulin was assessed among the distinct genotypes after an intraperitoneal injection of insulin at a dose of 1 U/kg. As shown in Fig. 3A, the S6K1−/− mice were insulin hypersensitive while the Akt2−/− mice were insulin resistant. The combined deletion of the S6K1 and Akt2 genes led to an insulin-resistant state compared to the wild-type control. Interestingly, this effect was more pronounced in old animals, when the lack of insulin response in S6K1−/− Akt2−/− mice was similar to that in Akt2−/− mice.
Fig 3.
S6K1−/− Akt2−/− mice have impaired insulin sensitivity. (A) Insulin tolerance test after intraperitoneal injection of insulin in 3-month-old (left) and 1-year-old (right) mice of the indicated genotypes (n ≥ 5). (B) RT-qPCR analyses of relative transcript levels of the indicated genes in the livers of 3-month old mice of the indicated genotypes using GUS as the reference gene and WT samples as the invariant control. Mice were starved for 16 h and refed for 4 h (n ≥ 5). (C) RT-qPCR analyses of relative transcript levels of GCK in hepatocytes kept in full medium 48 h after isolation from 2-month-old mice of the indicated genotypes using GUS as the reference gene and WT samples as the invariant control. (D) Immunoblot analysis of protein extracts from hepatocytes kept in full medium 48 h after isolation from 2-month-old mice of the indicated genotypes. The proteins were revealed using the indicated antibodies. The ratio to tubulin of the densitometric assay is presented. All values are expressed as means and SEM. a, P < 0.05 versus the wild-type group; b, P < 0.05 versus the S6K1−/− group; c, P < 0.05 versus the Akt2−/− group.
The hepatic insulin resistance in Akt2−/− mice is accompanied by alterations in gene expression consistent with the lack of insulin effect in the liver (19, 25). In particular, the expression of glucokinase (GCK) was downregulated in the liver tissue and in cultured hepatocytes from Akt2−/− mice compared to the wild-type control (Fig. 3B and C). Despite the improvement in insulin sensitivity by S6K1 deletion, as evidenced by improved insulin tolerance test results and GCK levels (Fig. 3A and B), in the background of Akt2 deletion, S6K1−/− Akt2−/− mice had reduced GCK gene expression that was comparable to that of Akt2−/− mice (Fig. 3B). Similarly, the expression level of another key insulin target gene, the glucose-6-phosphatase catalytic subunit (G6Pc) gene, was deregulated in both Akt2−/− and S6K1−/− Akt2−/− mice compared to wild-type and S6K1−/− mice (Fig. 3B and D). These data indicate that S6K1 deletion does not rescue the changes in hepatic glycolytic and gluconeogenic gene expression triggered by the absence of Akt2 in vivo and in vitro, suggesting a cell-autonomous mechanism.
S6K1−/− Akt2−/− mice have impaired insulin levels and β-cell growth.
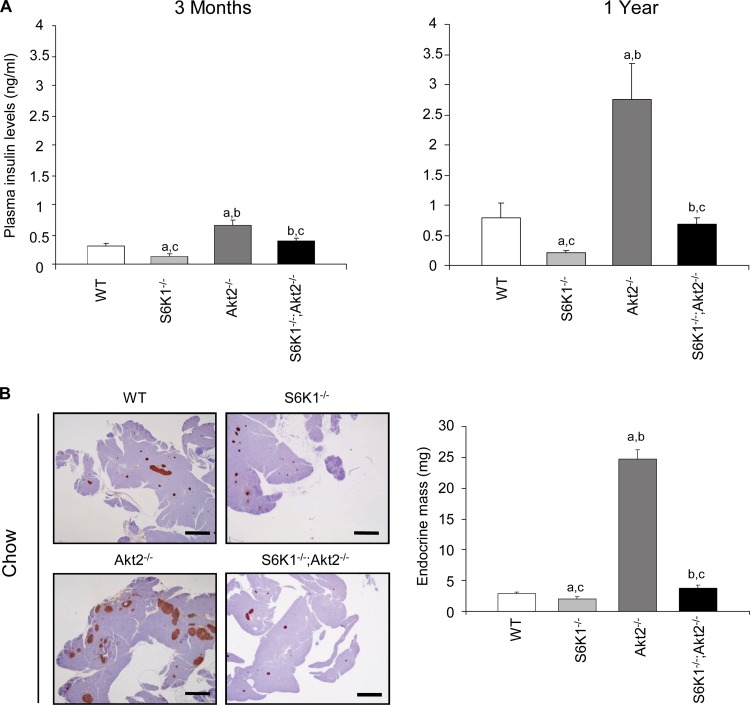
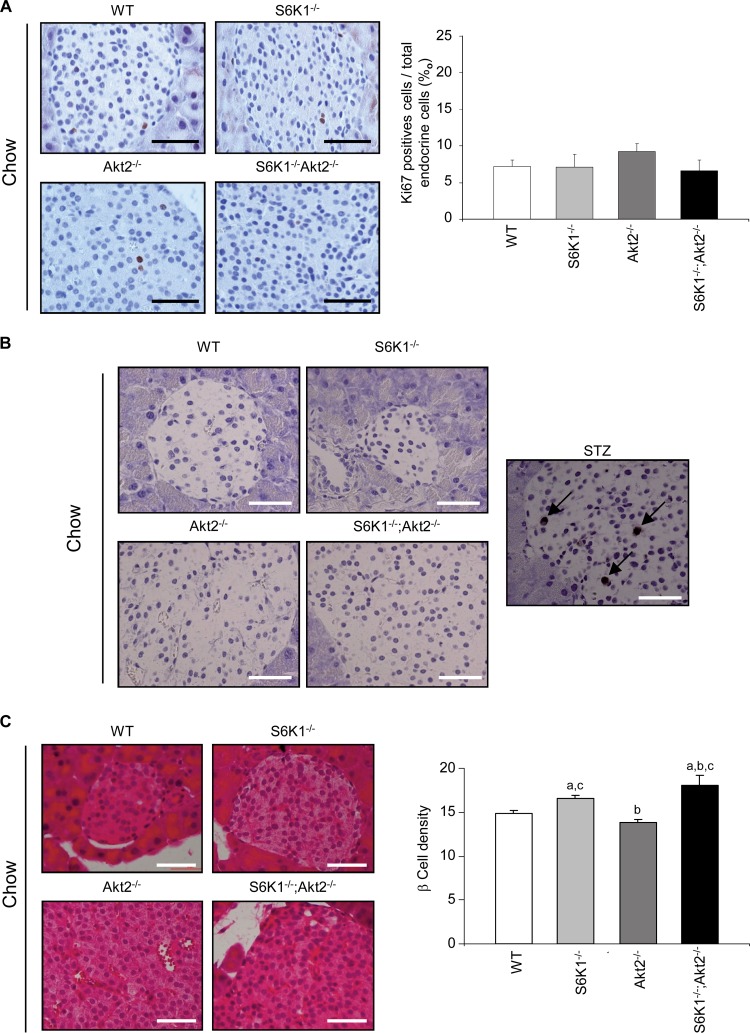
As previously reported (5, 26), plasma insulin levels were decreased by approximately half in S6K1−/− mice compared to wild-type controls, while they were increased by more than 2-fold in young and old Akt2−/− mice (Fig. 4A). Although the S6K1−/− Akt2−/− mice had higher blood glucose levels than the Akt2−/− mice (Fig. 1B), the upregulation of plasma insulin levels was blunted in the double-mutant mice compared to Akt2−/− mice. Thus, the S6K1 deletion impairs the insulin secretory response that maintains the euglycemic control in the Akt2−/− background. Given the reduced body size of S6K1−/− Akt2−/− mice, diminished insulin levels might be due to a disproportionate decrease in overall pancreatic size. However, analysis of the ratio of mouse whole-body weight to pancreatic weight revealed no significant difference between Akt2−/− and S6K1−/− Akt2−/− mice at 6 months (mouse weights, 29.3 ± 0.7 g and 21.3 ± 0.6 g, versus pancreas weights of 517 ± 18 mg and 310 ± 26 mg, respectively; n ≥ 8), suggesting that reduced β-cell mass may be responsible for decreased insulin levels in S6K1−/− Akt2−/− mice. As shown in Fig. 4B, the insulin resistance in Akt2−/− mice was accompanied by a marked increase in the mass of the islets of Langerhans. Strikingly the combined deletion of S6K1 induced a sharp decrease in β-cell mass (Fig. 4B). The disproportionate decrease in the β-cell mass was evidenced by calculating the percentage of endocrine mass over total pancreas mass (0.94% ± 0.7% for the wild type, 0.7% ± 0.05% for S6K1−/− mice, 4.4% ±0.3 for Akt2−/− mice, and 1.1% ± 0.1 for S6K1−/− Akt2−/− mice). Immunofluorescence-staining analysis with anti-glucagon and anti-insulin antibodies detected a normal distribution of α and β cells in the islets from S6K1−/− Akt2−/− mice (data not shown). The proliferation and survival rates of pancreatic β cells did not differ among the experimental groups, as indicated by Ki67 immunostaining and TUNEL assays, respectively (Fig. 5A and B). In contrast, S6K1 deletion shrank β-cell size compared to wild-type and Akt2−/− mice, as assessed by the analysis of β-cell numbers per islet surface (Fig. 5C). In conclusion, although we cannot exclude the possibility that differences in proliferation and survival rates at earlier time points may contribute to the final β-cell mass, in 6-month-old mice, S6K1−/− Akt2−/− β cells display a severe defect in size under steady-state conditions. Thus, the combined deletion of S6K1 and Akt2 genes reveals the dominant effect of S6K1 on the control of β-cell mass. Taken together, our findings suggest that S6K1−/− mice or Akt2−/− mice maintain proper control of glycemia while fasting due to insulin hypersensitivity or hyperinsulinemia, respectively. Combining the two mutations blunts these compensatory mechanisms and causes glucose intolerance.
Fig 4.
S6K1−/− Akt2−/− mice have impaired insulin levels and β-cell mass. (A) Plasma insulin levels after an overnight fast in 3-month-old (left) and 1-year-old (right) mice of the indicated genotypes (n ≥ 6). (B) Histological analysis of pancreatic sections from 6-month-old mice of the indicated genotypes starved for 6 h. The sections were immunostained for insulin and counterstained with hematoxylin. Shown are representative islets (left) (scale bar, 1,000 μm) and quantification of the endocrine mass (n ≥ 6) (right). All values are expressed as means and SEM. a, P < 0.05 versus the wild-type group; b, P < 0.05 versus the S6K1−/− group; c, P < 0.05 versus the Akt2−/− group.
Fig 5.
S6K1−/− Akt2−/− mice have impaired β-cell growth. (A) Histological analysis of pancreatic sections from 6-month-old mice of the indicated genotypes starved for 6 h. The sections were immunostained for Ki67 and counterstained with hematoxylin. Shown are representative islets (left) (scale bar, 50 μm) and quantification of Ki67-positive cells over total endocrine cells (n ≥ 6) (right). (B) TUNEL staining in pancreas sections from 6-month-old mice of the indicated genotypes starved for 6 h. The pancreas from a mouse treated with streptozotocin (STZ) was used as a positive control. Apoptotic cells are stained brown; the arrows indicate representative cells. Scale bars, 50 μm. (C) Histological analysis of pancreatic sections from 6-month-old mice of the indicated genotypes starved for 6 h. The sections were stained with hematoxylin and eosin. Shown are representative islets (left) (scale bars, 50 μm) and quantification of β-cell density assessed by counting the nuclei in a 1,720-μm2 islet area (n ≥ 4) (right). All values are expressed as means and SEM. a, P < 0.05 versus the wild-type group; b, P < 0.05 versus the S6K1−/− group; c, P < 0.05 versus the Akt2−/− group.
Interaction of S6K1 and Akt2 in the control of weight gain and glycemia after a high-fat diet.
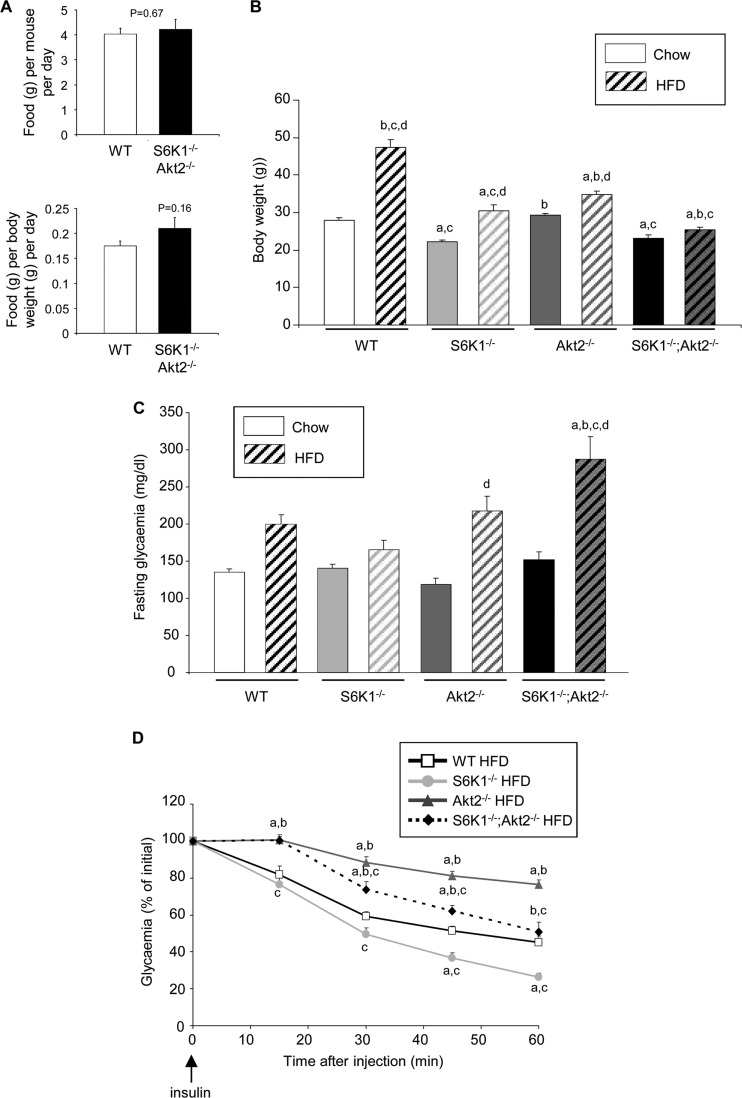
Since S6K1−/− mice are exquisitely resistant to high-fat diet-induced obesity and hyperglycemia (36), we asked whether S6K1−/− Akt2−/− mice also showed improvements in glucose homeostasis under these diet conditions. The food intake of S6K1−/− Akt2−/− mice under a standard chow or high-fat diet was comparable to that of the wild type, consistent with data on single mutants (references 5 and 36 and data not shown) (Fig. 6A). Wild-type animals gained more than 70% of their body weight after 16 weeks on a high-fat diet compared to standard-chow-fed controls (Fig. 6B). In contrast, the deletion of the S6K1 and Akt2 genes alone was sufficient to blunt weight gain to 38% and 18%, respectively. Importantly, the combined deletion had a more pronounced effect on body weight, which did not increase over 10% after the high-fat diet. In the S6K1−/− mice, the lack of obesity onset was associated with an amelioration of glucose homeostasis and insulin sensitivity compared to high-fat-fed wild-type animals (Fig. 6C and D). However, the S6K1−/− Akt2−/− mice displayed severe hyperglycemia, despite their lean phenotype (Fig. 6C). As observed under standard-chow conditions, after the high-fat diet, the S6K1−/− Akt2−/− mice were insulin resistant compared to wild-type mice and S6K1−/− mice (Fig. 6D). Taken together, these data point to the complementarity of S6K1 and Akt2 actions in the control of glucose homeostasis, depending on the nutritional status.
Fig 6.
Interaction of S6K1 and Akt2 in the control of weight gain and glycemia after a high-fat diet. (A) Food intake per mouse of the indicated genotypes on an HFD measured over 15 days or normalized by body weight (n = 6). (B) Body weights of 6-month-old mice of the indicated genotypes fed a chow diet or an HFD for 16 weeks (n ≥ 11). (C) Glucose levels after a 3-h fast in 5-month-old mice of the indicated genotypes fed a chow diet or an HFD for 12 weeks (n ≥ 6). (D) Insulin tolerance test after intraperitoneal injection of insulin in 5-month-old mice of the indicated genotypes fed a chow diet or an HFD for 12 weeks (n ≥ 6). All values are expressed as means and SEM. a, P < 0.05 versus the wild-type group; b, P < 0.05 versus the S6K1−/− group; c, P < 0.05 versus the Akt2−/− group; d, P < 0.05 versus the chow-fed group.
S6K1−/− Akt2−/− mice show defects in β-cell proliferation induced by an HFD.
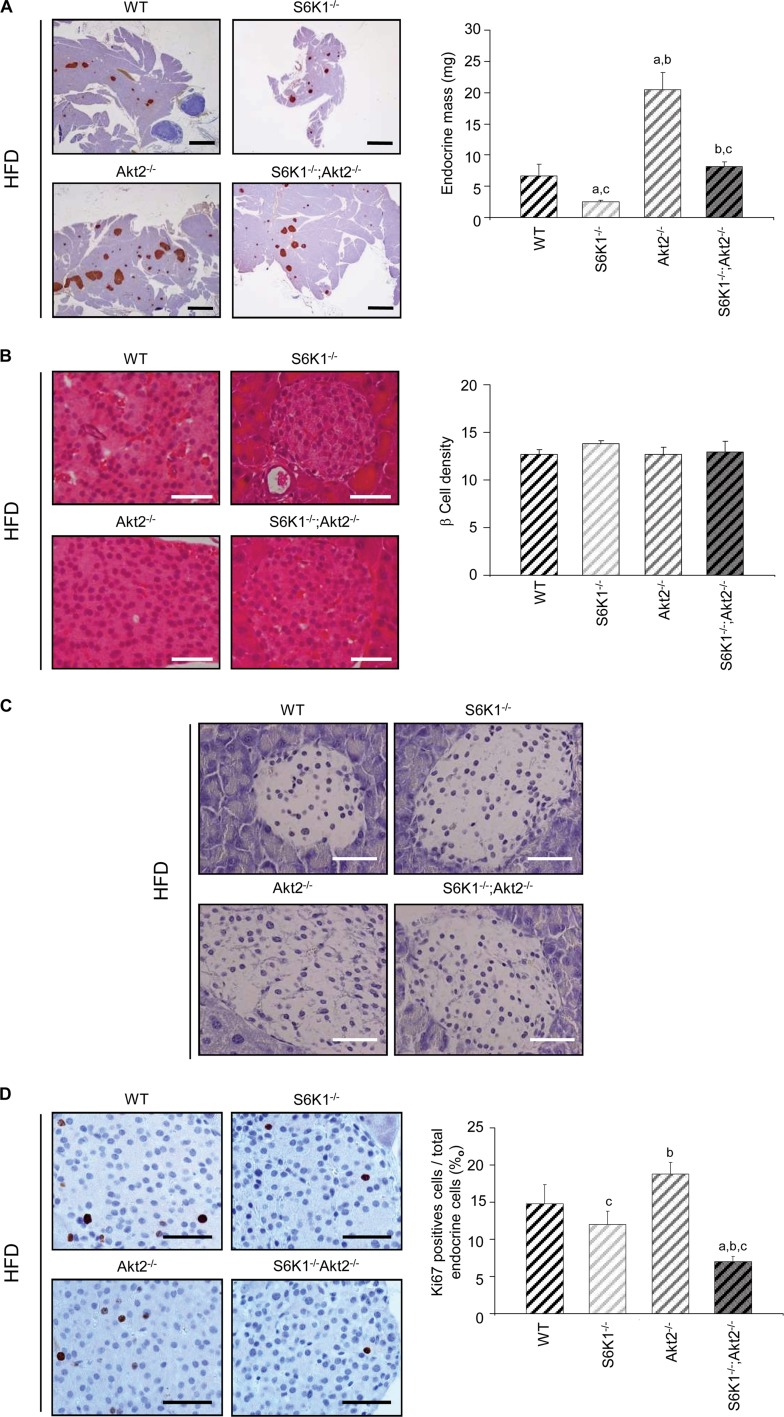
Pancreatic β-cell growth during adult life is an important adaptive response to insulin-resistant states for the maintenance of glucose homeostasis. As expected, 4 months of the HFD increased the endocrine mass in the wild-type pancreas by 133% compared to the standard chow diet (Fig. 4B and 7A). A major shortage was observed in the endocrine mass of S6K1−/− Akt2−/− mice compared to Akt2−/− mice after the HFD (Fig. 7A), similar to what was observed after the standard chow diet (Fig. 4B). Interestingly, the HFD promoted increases in β-cell size that were equivalent among the distinct genotypes without affecting β-cell survival (Fig. 5C and 7B and C). However, the HFD selectively stimulated proliferation of wild-type and Akt2−/− islet cells, as determined by Ki67 staining (Fig. 5A and 7D). These proliferating cells were insulin-positive β cells (data not shown). Importantly, the combined deletion of Akt2 and S6K1 completely abrogated β-cell proliferation induced by HFD. Thus, S6K1 plays a major role in the control of β-cell growth and proliferation in the insulin-resistant states due to Akt2 deletion and high-fat feeding.
Fig 7.
S6K1−/− Akt2−/− mice show defects in β-cell proliferation induced by HFD. (A) Histological analysis of pancreatic sections of 6-month-old mice of the indicated genotypes fed an HFD for 16 weeks and starved for 6 h. The sections were immunostained for insulin and counterstained with hematoxylin. Shown are representative islets (left) (scale bars, 1,000 μm) and quantification of the endocrine mass (n ≥ 5) (right). (B) Histological analysis of pancreatic sections from 6-month-old mice of the indicated genotypes fed an HFD for 16 weeks and starved for 6 h. The sections were stained with hematoxylin and eosin. Shown are representative islets (left) (scale bars, 50 μm) and quantification of β-cell density assessed by counting the nuclei in a 1,720-μm2 islet area (n ≥ 4) (right). (C) TUNEL staining in pancreas sections from 6-month-old mice of the indicated genotypes fed an HFD for 16 weeks and starved for 6 h. Scale bars, 50 μm. (D) Histological analysis of pancreatic sections from 6-month-old mice of the indicated genotypes fed an HFD for 16 weeks and starved for 6 h. The sections were immunostained for Ki67 and counterstained with hematoxylin. Shown are representative islets (left) (scale bar, 50 μm) and quantification of Ki67-positive cells over total endocrine cells (n ≥ 7) (right). All values are expressed as means and SEM. a, P < 0.05 versus the wild-type group; b, P < 0.05 versus the S6K1−/− group; c, P < 0.05 versus the Akt2−/− group.
DISCUSSION
Type 2 diabetes can be defined as a disease of insulin and nutrient signal transduction (29, 34). Under healthy conditions, nutrients regulate the synthesis and the secretion from in pancreatic β cells of the major anabolic hormone insulin. Insulin controls nutrient usage in peripheral tissues, such as skeletal muscle, fat, and liver. In turn, nutrient levels in these tissues trigger a negative-feedback mechanism that modulates insulin action. In this study, we provide evidence that loss-of-function mutations in two targets of the mTOR and PI3K signal transduction pathway downstream insulin and nutrients recapitulate type 2 diabetes. Our data reveal the complementary actions of Akt2 and S6K1 kinases in the control of glucose homeostasis. The former is required for proper insulin action in peripheral tissues, such as the liver, while the latter is required for proper adaptation of pancreatic β-cell function and mass. In particular, the lack of S6K1 is sufficient to deteriorate glycemic control in insulin resistance states by blunting β-cell growth. This polygenic model of type 2 diabetes in mice may be relevant to the human condition, considering that overt type 2 diabetes in the majority of human patients is observed when pancreatic β cells are unable to compensate for peripheral insulin resistance.
While S6K1−/− Akt2−/− mice show a slight improvement in insulin resistance compared to Akt2−/− mice at 3 months of age, at 1 year, the two genotypes display comparable insulin resistance states (Fig. 3). In agreement with a defect of insulin action in the liver, expression of key gluconeogenic and glycolytic enzymes is deregulated to the same extent in S6K1−/− Akt2−/− and Akt2−/− mice. Deregulation of these genes has been reported to be directly related to insulin resistance in the liver (22). This effect is likely to be cell autonomous, as it is observed in cultures of hepatocytes isolated from S6K1−/− Akt2−/− mice. Thus, the amelioration of insulin sensitivity due to S6K1 deletion occurs largely through the activation of Akt2, as this beneficial effect on glucose homeostasis is lost if Akt2 is absent.
In addition to being insulin resistant, S6K1−/− Akt2−/− mice present a sharp decrease in plasma insulin levels compared to Akt2−/− mice, which is correlated with defects in β-cell growth. Defects in β-cell mass adaptations play a key role in the onset of type 2 diabetes that is frequently observed when the pancreatic β cells fail to compensate for insulin resistance and to maintain normoglycemia. Our study reveals that S6K1 plays a key role in the control of islet compensatory growth in response to two distinct insulin-resistant states: the deletion of Akt2 and an HFD. S6K1 activity affects both β-cell hypertrophic and hyperplasic responses. The former effect is revealed under standard-chow conditions, while the latter is especially evident when cell proliferation is triggered by an HFD. It will be important to determine the direct targets of S6K1 involved in β-cell function. It is possible that the phosphorylation of ribosomal protein S6 (rpS6) contributes to these effects, as mutant mice in which rpS6 cannot be phosphorylated display defects in β-cell size (28). However, S6K2, and not S6K1, is the major rpS6 kinase in mouse pancreatic β cells, as demonstrated by the comparative analysis of S6K1−/− and S6K2−/− mice (2). Since S6K2−/− mice have no defects in insulin secretion and glucose homeostasis, these data suggest the existence of additional S6K1-specific substrates important for β-cell function. In other cell types, S6K1 has been shown to phosphorylate BAD and peroxisome proliferator-activated receptor gamma coactivator 1α (PGC-1α) (11, 20). Interestingly, both putative targets are involved in insulin secretion and pancreatic β-cell growth in distinct environmental situations, including an HFD (7, 39). Future studies should address whether these proteins or additional substrates mediate the action of S6K1 in pancreatic β cells.
We found here that the combined deletion of S6K1 and Akt2 deteriorates glucose tolerance and leads to establishment of severe hyperglycemia under nutritional challenge. In agreement with our findings, there is increasing evidence in animal models and in humans suggesting that chronic administration of the mTOR inhibitor rapamycin has deleterious effects on glucose homeostasis, possibly due to a combined deterioration of insulin sensitivity and insulin secretion (10, 15, 17, 37, 38). Long-term rapamycin treatment in vivo may lead to disruption of both mTORC1 and mTORC2, depending on the cell types (17, 30). It is likely that the detrimental effects of rapamycin on β-cell function are due at least in part to S6K1 inhibition, as S6K1-deficient islets are resistant to growth inhibition by rapamycin (2). Conversely, insulin resistance is rather secondary to the loss of mTORC2 activity (17). Our data specifically point to two major mTOR and PI3K targets having complementary roles in glucose homeostasis and whose invalidation provides an animal model of polygenic type 2 diabetes with insulin resistance and defects in β-cell mass adaptation. While the selective inhibition of mTORC1 is an interesting strategy against age-related diseases due to the beneficial effects on longevity, caution should be taken, considering the important role of mTORC1/S6K1 during pancreatic β-cell adaptation in insulin-resistant states.
ACKNOWLEDGMENTS
We thank the Novartis Foundation and the George Thomas laboratory for the use of S6K mutant mice. We thank Gilles Mithieux for providing us the anti-G6Pase antibody. We are grateful to the members of INSERM U845 for support. We thank Sophie Berissi for excellent technical support.
This work was supported by grants to M.P. from the European Research Council, from INSERM-Fondation pour la Recherche Médicale-Juvenile Diabetes Research Foundation International, from Fondation de la Recherche Medicale, and from Fondation Schlumberger pour l'Education et la Recherche.
Footnotes
Published ahead of print 30 July 2012
REFERENCES
- 1. Aguilar V, et al. 2007. S6 kinase deletion suppresses muscle growth adaptations to nutrient availability by activating AMP kinase. Cell Metab. 5: 476– 487 [DOI] [PubMed] [Google Scholar]
- 2. Alliouachene S, et al. 2008. Constitutively active Akt1 expression in mouse pancreas requires S6 kinase 1 for insulinoma formation. J. Clin. Invest. 118: 3629– 3638 [DOI] [PMC free article] [PubMed] [Google Scholar]
- 3. Ayala JE, et al. 2010. Standard operating procedures for describing and performing metabolic tests of glucose homeostasis in mice. Dis. Model. Mech. 3: 525– 534 [DOI] [PMC free article] [PubMed] [Google Scholar]
- 4. Carnevalli LS, et al. 2010. S6K1 plays a critical role in early adipocyte differentiation. Dev. Cell 18: 763– 774 [DOI] [PMC free article] [PubMed] [Google Scholar]
- 5. Cho H, et al. 2001. Insulin resistance and a diabetes mellitus-like syndrome in mice lacking the protein kinase Akt2 (PKB beta). Science 292: 1728– 1731 [DOI] [PubMed] [Google Scholar]
- 6. Chomczynski P, Sacchi N. 1987. Single-step method of RNA isolation by acid guanidinium thiocyanate-phenol-chloroform extraction. Anal. Biochem. 162: 156– 159 [DOI] [PubMed] [Google Scholar]
- 7. Danial NN, et al. 2008. Dual role of proapoptotic BAD in insulin secretion and beta cell survival. Nat. Med. 14: 144– 153 [DOI] [PMC free article] [PubMed] [Google Scholar]
- 8. Dibble CC, Asara JM, Manning BD. 2009. Characterization of Rictor phosphorylation sites reveals direct regulation of mTOR complex 2 by S6K1. Mol. Cell. Biol. 29: 5657– 5670 [DOI] [PMC free article] [PubMed] [Google Scholar]
- 9. Espeillac C, et al. 2011. S6 kinase 1 is required for rapamycin-sensitive liver proliferation after mouse hepatectomy. J. Clin. Invest. 121: 2821– 2832 [DOI] [PMC free article] [PubMed] [Google Scholar]
- 10. Fraenkel M, et al. 2008. mTOR inhibition by rapamycin prevents beta-cell adaptation to hyperglycemia and exacerbates the metabolic state in type 2 diabetes. Diabetes 57: 945– 957 [DOI] [PubMed] [Google Scholar]
- 11. Harada H, Andersen JS, Mann M, Terada N, Korsmeyer SJ. 2001. p70S6 kinase signals cell survival as well as growth, inactivating the pro-apoptotic molecule BAD. Proc. Natl. Acad. Sci. U. S. A. 98: 9666– 9670 [DOI] [PMC free article] [PubMed] [Google Scholar]
- 12. Harrington LS, et al. 2004. The TSC1-2 tumor suppressor controls insulin-PI3K signaling via regulation of IRS proteins. J. Cell Biol. 166: 213– 223 [DOI] [PMC free article] [PubMed] [Google Scholar]
- 13. Harrison DE, et al. 2009. Rapamycin fed late in life extends lifespan in genetically heterogeneous mice. Nature 460: 392– 395 [DOI] [PMC free article] [PubMed] [Google Scholar]
- 14. Holz MK, Blenis J. 2005. Identification of S6 kinase 1 as a novel mammalian target of rapamycin (mTOR)-phosphorylating kinase. J. Biol. Chem. 280: 26089– 26093 [DOI] [PubMed] [Google Scholar]
- 15. Houde VP, et al. 2010. Chronic rapamycin treatment causes glucose intolerance and hyperlipidemia by upregulating hepatic gluconeogenesis and impairing lipid deposition in adipose tissue. Diabetes 59: 1338– 1348 [DOI] [PMC free article] [PubMed] [Google Scholar]
- 16. Julien LA, Carriere A, Moreau J, Roux PP. 2010. mTORC1-activated S6K1 phosphorylates Rictor on threonine 1135 and regulates mTORC2 signaling. Mol. Cell. Biol. 30: 908– 921 [DOI] [PMC free article] [PubMed] [Google Scholar]
- 17. Lamming DW, et al. 2012. Rapamycin-induced insulin resistance is mediated by mTORC2 loss and uncoupled from longevity. Science 335: 1638– 1643 [DOI] [PMC free article] [PubMed] [Google Scholar]
- 18. Laplante M, Sabatini DM. 2011. mTOR signaling. Cold Spring Harb. Perspect. Biol. 4: a011593 doi:10.1101/cshperspect.a011593 [DOI] [PMC free article] [PubMed] [Google Scholar]
- 19. Lu M, et al. 2012. Insulin regulates liver metabolism in vivo in the absence of hepatic Akt and Foxo1. Nat. Med. 18: 388– 395 [DOI] [PMC free article] [PubMed] [Google Scholar]
- 20. Lustig Y, et al. 2011. Separation of the gluconeogenic and mitochondrial functions of PGC-1{alpha} through S6 kinase. Genes Dev. 25: 1232– 1244 [DOI] [PMC free article] [PubMed] [Google Scholar]
- 21. Manning BD, Cantley LC. 2007. AKT/PKB signaling: navigating downstream. Cell 129: 1261– 1274 [DOI] [PMC free article] [PubMed] [Google Scholar]
- 22. Michael MD, et al. 2000. Loss of insulin signaling in hepatocytes leads to severe insulin resistance and progressive hepatic dysfunction. Mol. Cell 6: 87– 97 [PubMed] [Google Scholar]
- 23. Ohanna M, et al. 2005. Atrophy of S6K1(-/-) skeletal muscle cells reveals distinct mTOR effectors for cell cycle and size control. Nat. Cell Biol. 7: 286– 294 [DOI] [PubMed] [Google Scholar]
- 24. Pan KZ, et al. 2007. Inhibition of mRNA translation extends lifespan in Caenorhabditis elegans. Aging Cell 6: 111– 119 [DOI] [PMC free article] [PubMed] [Google Scholar]
- 25. Panasyuk G, et al. 2012. PPARgamma contributes to PKM2 and HK2 expression in fatty liver. Nat. Commun. 3: 672. [DOI] [PMC free article] [PubMed] [Google Scholar]
- 26. Pende M, et al. 2000. Hypoinsulinaemia, glucose intolerance and diminished beta-cell size in S6K1-deficient mice. Nature 408: 994– 997 [DOI] [PubMed] [Google Scholar]
- 27. Reznick RM, et al. 2007. Aging-associated reductions in AMP-activated protein kinase activity and mitochondrial biogenesis. Cell Metab. 5: 151– 156 [DOI] [PMC free article] [PubMed] [Google Scholar]
- 28. Ruvinsky I, et al. 2005. Ribosomal protein S6 phosphorylation is a determinant of cell size and glucose homeostasis. Genes Dev. 19: 2199– 2211 [DOI] [PMC free article] [PubMed] [Google Scholar]
- 29. Saltiel AR, Kahn CR. 2001. Insulin signalling and the regulation of glucose and lipid metabolism. Nature 414: 799– 806 [DOI] [PubMed] [Google Scholar]
- 30. Sarbassov DD, et al. 2006. Prolonged rapamycin treatment inhibits mTORC2 assembly and Akt/PKB. Mol. Cell 22: 159– 168 [DOI] [PubMed] [Google Scholar]
- 31. Selman C, et al. 2009. Ribosomal protein S6 kinase 1 signaling regulates mammalian life span. Science 326: 140– 144 [DOI] [PMC free article] [PubMed] [Google Scholar]
- 32. Shah OJ, Hunter T. 2006. Turnover of the active fraction of IRS1 involves raptor-mTOR- and S6K1-dependent serine phosphorylation in cell culture models of tuberous sclerosis. Mol. Cell. Biol. 26: 6425– 6434 [DOI] [PMC free article] [PubMed] [Google Scholar]
- 33. Shima H, et al. 1998. Disruption of the p70(s6k)/p85(s6k) gene reveals a small mouse phenotype and a new functional S6 kinase. EMBO J. 17: 6649– 6659 [DOI] [PMC free article] [PubMed] [Google Scholar]
- 34. Taniguchi CM, Emanuelli B, Kahn CR. 2006. Critical nodes in signalling pathways: insights into insulin action. Nat. Rev. Mol. Cell Biol. 7: 85– 96 [DOI] [PubMed] [Google Scholar]
- 35. Treins C, Warne PH, Magnuson MA, Pende M, Downward J. 2010. Rictor is a novel target of p70 S6 kinase-1. Oncogene 29: 1003– 1016 [DOI] [PubMed] [Google Scholar]
- 36. Um SH, et al. 2004. Absence of S6K1 protects against age- and diet-induced obesity while enhancing insulin sensitivity. Nature 431: 200– 205 [DOI] [PubMed] [Google Scholar]
- 37. Vodenik B, Rovira J, Campistol JM. 2009. Mammalian target of rapamycin and diabetes: what does the current evidence tell us? Transplant. Proc. 41: S31– S38 [DOI] [PubMed] [Google Scholar]
- 38. Yang SB, et al. 2011. Rapamycin induces glucose intolerance in mice by reducing islet mass, insulin content, and insulin sensitivity. J. Mol. Med. (Berl). 90: 575– 585 [DOI] [PMC free article] [PubMed] [Google Scholar]
- 39. Yoon JC, et al. 2003. Suppression of beta cell energy metabolism and insulin release by PGC-1alpha. Dev. Cell 5: 73– 83 [DOI] [PubMed] [Google Scholar]
- 40. Zoncu R, Efeyan A, Sabatini DM. 2011. mTOR: from growth signal integration to cancer, diabetes and ageing. Nat. Rev. Mol. Cell Biol. 12: 21– 35 [DOI] [PMC free article] [PubMed] [Google Scholar]


