Abstract
Candida albicans is a normal member of the gastrointestinal (GI) tract microbiota of healthy humans, but during host immunosuppression or alterations in the bacterial microbiota, C. albicans can disseminate and cause life-threatening illness. The bacterial microbiome of the GI tract, including lactic acid bacteria (LAB), plays a vital role in preventing fungal invasion. However, little is known about the role of C. albicans in shaping the bacterial microbiota during antibiotic recovery. We investigated the fungal burdens in the GI tracts of germfree mice and mice with a disturbed microbiome to demonstrate the role of the microbiota in preventing C. albicans colonization. Histological analysis demonstrated that colonization with C. albicans during antibiotic treatment does not trigger overt inflammation in the murine cecum. Bacterial diversity is reduced long term following cefoperazone treatment, but the presence of C. albicans during antibiotic recovery promoted the recovery of bacterial diversity. Cefoperazone diminishes Bacteroidetes populations long term in the ceca of mice, but the presence of C. albicans during cefoperazone recovery promoted Bacteroidetes population recovery. However, the presence of C. albicans resulted in a long-term reduction in Lactobacillus spp. and promoted Enterococcus faecalis populations. Previous studies have focused on the ability of bacteria to alter C. albicans; this study addresses the ability of C. albicans to alter the bacterial microbiota during nonpathogenic colonization.
INTRODUCTION
Candida albicans is both an opportunistic fungal pathogen and a normal member of the human gastrointestinal (GI) tract microbiota. It can persist in the GI tract in a nonpathogenic state for long periods in most humans, but upon disruption of the host immune system or the indigenous bacterial microbiota, C. albicans can disseminate and cause life-threatening infections (26). The bacteria in the GI tract play a critical role in preventing fungal colonization and invasion, as indicated by the enhanced susceptibility of germfree mice to Candida colonization (6–8, 17, 32–34). Thus, the ability of the GI microbiota to prevent invasion or colonization by C. albicans is well documented, but the ability of C. albicans to alter the microbiota is not well understood or studied.
In our previously published studies, we have documented that C. albicans CHN1 colonizes the cecum and stomach in cefoperazone-treated mice (13, 20–22). Cefoperazone is a broad-spectrum antibiotic that has been shown to have dramatic long-term effects on the indigenous microbiota of mice (1). Broad-spectrum antibiotic treatment, like cefoperazone, predisposes mice to Candida GI overgrowth and candidiasis (7, 9), and studies have demonstrated that cefoperazone can cause long-term alterations of the cecal microbiota (1). Most importantly, Candida colonization of the stomach modulated the antibiotic recovery of the lactic acid bacteria (LAB), antagonizing Lactobacillus and facilitating Enterococcus faecalis colonization (13). The objective of these studies was to determine if similar yeast-bacterial interactions were occurring in the intestinal tract.
MATERIALS AND METHODS
Animals and housing.
Female C57BL/6 mice were purchased from Jackson Laboratories (Bar Harbor, ME) and were housed under specific-pathogen-free conditions in enclosed filter top cages. Food and sterile water were given ad libitum. Food remained constant throughout the experiment to minimize the effect of diet on the microbiota. To reduce coprophagy, the mice were maintained on grates; the procedure and protocols were approved by the Unit for Laboratory Animal Medicine (ULAM) at the University of Michigan (Ann Arbor, MI), and the protocols were approved by an animal institutional review board. Germfree C57BL/6 mice were raised and housed in the ULAM germfree barrier facility at the University of Michigan. C. albicans-infected germfree mice were maintained in the barrier facility.
Antibiotic treatment.
Cefoperazone (0.5 mg/ml; Sigma-Aldrich, St. Louis, MO) was administered orally to mice ad libitum in drinking water. Antibiotic treatment was continued for 7 days (days −7 to 0) prior to C. albicans colonization. After 7 days, antibiotic-containing drinking water was replaced with sterile water.
C. albicans GI inoculation.
C. albicans strain CHN1 (a human clinical isolate) was grown in Sabouraud dextrose broth (Difco, Detroit, MI) to stationary phase in a shaking flask at 37°C. For gavage, the cultures were washed in sterile nonpyrogenic saline, counted using a hemacytometer, and diluted to 2 × 10⁸ CFU/ml in sterile nonpyrogenic saline. Mice were inoculated with C. albicans (107 CFU in 50 μl) by oral administration using a 24-gauge feeding needle attached to a 1-ml syringe. The syringe containing C. albicans was mounted on a Stepper repetitive pipette (Tridak, Brookfield, CT) to deliver an equivalent amount of inoculum to each mouse. The inocula were serially diluted and grown on Sabouraud dextrose agar (SDA) to verify the number of CFU delivered.
Necropsy and microbiological culture.
Mice were euthanized by CO2 asphyxiation. The mouse intestinal tract was removed and washed in phosphate-buffered saline (PBS) to remove the contents. Sections of intestinal wall for bacterial 16S rRNA analysis were flash frozen in liquid nitrogen and stored at −80°C. Histological sections of the cecum were obtained by cutting along the greater curvature, removing the cecal contents, and washing in sterile 1× PBS. Two separate sections were cut from the organ, fixed with 10% buffered formalin, and embedded in paraffin. The tissue sections were stained with hematoxylin and eosin (H&E) for detection of inflammatory infiltrates. The remaining organs were homogenized in sterile water, serially diluted, and cultured aerobically on different agars—SDA (promotes the growth of fungi) and de Man, Rogosa, and Sharpe (MRS) agar (promotes the growth of lactic acid bacteria) supplemented with 0.02% sodium azide (Difco)—to determine culturable bacterial/fungal counts. Colonies that grew on MRS plus azide were identified further by PCR with previously published bacterial universal primers (23). Yeast numbers were quantified in mucosal samples by culturing on SDA supplemented with cefoperazone (0.1 mg/ml). The identity of the yeast was confirmed with wet mounts and replica plating on HardyChrom Candida indicator plates (Hardy Diagnostics, Santa Maria, CA).
Antibiotic susceptibility assays.
Bacterial species isolated from the murine ceca were subcultured in vitro on MRS-plus-azide agar. Bacterial susceptibility to cefoperazone was determined using cefoperazone-treated sterile paper discs (BD Biosciences, San Jose, CA). All samples were tested in duplicate, and the zone of antibiotic-induced clearance was analyzed for each sample.
DNA extraction.
Genomic DNA was extracted from cecal-tip sections stored at −80°C using a modified commercial kit (DNeasy tissue kit; Qiagen, Germantown, MD). Samples were subjected to bead beating for 1 min in DNA isolation bead tubes (MoBio Laboratories, Carlsbad, CA) prior to kit use. The DNeasy tissue protocol was modified to use 40 μl proteinase K instead of the recommended 20 μl, and samples were eluted with 100 μl of buffer AE instead of the suggested 200 μl.
T-RFLP analysis.
Terminal restriction fragment length polymorphism (T-RFLP) analysis was performed as described previously (11, 13). Briefly, full-length bacterial 16S rRNA genes were amplified from each sample by PCR amplification. The primers used in the amplification were a fluorescently labeled 6-carboxyfluorescein (FAM)-8F forward primer and an unlabeled 1525R reverse primer. Each 25-μl PCR mixture contained 20 pmol of each primer, 200 μM of each deoxynucleoside triphosphate, and 1.5 U of Taq DNA polymerase in a final concentration of 10 mM Tris-HCl–50 mM KCl–1.5 mM MgCl2 (Ready to Go PCR beads; Amersham Pharmacia Biotech, Piscataway, NJ). PCR was performed under the following cycle conditions: an initial denaturation step at 94°C for 2 min and 30 cycles of denaturation at 94°C for 30s, annealing at 58°C for 45s, and extension at 72°C for 90 s. A final extension step at 72°C for 5 min was performed. The PCR product was purified using the QIAquick PCR Purification Kit (Qiagen). Two hundred nanograms of purified PCR amplicon was cut individually with the restriction enzyme MspI (New England BioLabs, Beverly, MA) for 2 h at 37°C. The DNA fragments were separated on an ABI 3730XL (Applied Biosystems Instruments, Foster City, CA) at the University of Michigan Sequencing Facility. The 5′ terminal restriction fragments (TRFs) were detected by excitation of the 6-FAM molecule attached to the forward primer.
Raw T-RFLP chromatograms were analyzed using Peakscanner (Applied Biosystems) to call the fragment sizes and to build a list of peaks (peak file). This process was carried out for every sample, after which all of the peak files were exported as one bulk peak file. Further analysis was carried out using K9, an in-house-designed program for T-RFLP data analysis (freely available at http://www-personal.umich.edu/∼jre/Microbiome_Core/K9.html). K9 separated the bulk peak file into all of the individual peak files, and the metatags were removed. Next, corrected peak files were generated by binning peak fragments to the corresponding whole number of fragment lengths. This binning allowed uniform comparison of samples from different analyses and also allowed simple background subtraction to be performed where appropriate.
Rank abundance graphs.
Individual TRFs were used to create rank abundance curves for each experimental group. Briefly, for each experimental treatment and time point, TRFs were presented, with base pair lengths plotted on the x axis. The peak height was normalized by determining the percentage of total TRFs for each individual sample. Within each treatment group, individual mouse TRFs were combined, and the standard errors of the mean are represented by the error bars. Experiments were performed at least twice, with three to five mice per group per experiment.
T-RFLP distance matrix construction.
Analysis of treatment groups was performed by first determining the core group of peaks common to a given treatment group but separate from the noise of the system. To accomplish this, peaks that occur in n − 1 of n samples were selected. This was followed by removing the top 3 peaks (to avoid skewing of the data), taking the sum of the total peak height, and determining which of the remaining peaks contribute >1% to the total peak height. These peaks plus the top 3 peaks formed the peak set for the group. The groups were then compared to one another through the generation of a distance matrix (based on the Bray-Curtis distance) and a complete furthest-neighbor hierarchical clustering of individual samples or groups of samples based on the sample mean.
Clone library protocol and analysis.
Clone libraries were constructed as described previously (15, 16). Whole DNA isolated from the murine cecum was amplified with Illustra PuRe Taq ReadyTo Go PCR beads (GE Healthcare, Piscataway, NJ). Briefly, amplification by PCR was performed using broad-range primers (8F, AGAGTTTGATCCTGGCTCAG; 1492R, GGTTACCTTGTTACGACTT). The amplicons were purified with a commercial kit (GFX; GE Healthcare, Piscataway, NJ) as directed by the manufacturer. The products were ligated into the Topo 4 vector (Invitrogen K4575-01) according to the manufacturer's specifications, transformed into the provided TOP-10 cells, and plated on LB agar supplemented with carbenicillin (50 μg/ml). The resulting colonies were then grown in 96-well deep-well plates in LB supplemented with carbenicillin overnight at 37°C. To screen for our desired insert, vector primers were used to screen the bacterial clones (M13F, CAGTCACGACGTTGTAAAACGACGGC; M13R, CAGGAAACAGCTATGACCATG). Clones that tested positive for the insert were sent for a single sequencing run using the 8F primer at the Sequencing Facility of the University of Michigan. Raw sequence data were processed through an automated “information pipeline” available through the Ribosomal Database Project (RDP) website (http://rdp.cme.msu.edu/). Following alignment of the sequences via myRDP, distance matrices representing each of the libraries were downloaded and taxonomic assignments were designated (95% confidence cutoff) using the RDP-provided classifier. These distance matrices were grouped into operational taxonomic units (OTUs), and rarefaction curves were made using Mothur (30).
T-RFLP-based community analysis.
T-RFLP data were converted into a standard community matrix where, for each sample, the position of the peak was assigned as an OTU and the height of the peak reflected the abundance of the OTU. A canonical correspondence analysis (CCA) of these data was carried out using R (http://www.r-project.org) and the cca function in the R -package vegan (9). To test whether significant differences between treatment groups were seen, first, the model was tested for significance using the function anova.cca, which performs an analysis of variance (ANOVA)-like permutation test for the joint effect of the constraints. After determining the number of significant axes, the coordinates along an axis were tested using the aov function, followed by a TukeyHSD posttest.
Additional statistics.
All values reported in rank abundance curves are standard errors of the mean, where mean values are pooled from independent experiments and are noted for each experiment. Bacterial and fungal colonization levels were compared by two-way analysis of variance with a Bonferroni correction (GraphPad Prism 5).
RESULTS
C. albicans colonizes the murine gastrointestinal tract during disruptions of the bacterial microbiota.
Our first objective was to examine the contribution of the indigenous bacterial microbiota to resistance against C. albicans CHN1 intestinal colonization in mice. Germfree female C57BL/6 mice were given a single oral gavage of C. albicans CHN1, and their levels of fungal colonization were determined at day 7 and day 21 postgavage through selective culturing on SDA. Unchallenged germfree mice did not have detectable fungal colonization at any time point (Fig. 1A). Every germfree mouse given a single oral gavage of C. albicans maintained a steady low level of colonization in the proximal small intestine (pSI), distal small intestine (dSI), cecum, and colon at both day 7 and day 21 (Fig. 1A). In contrast, C. albicans CHN1 was not able to effectively colonize the GI tract in conventional C57BL/6 mice after a single oral gavage. These mice had extremely low levels of colonization in the pSI (36% of mice were colonized on day 7 and 9.1% on day 21), dSI (45% on day 7, 18% on day 21), and cecum (36% on day 7, 9.1% on day 21) and no detectable C. albicans CFU in the colon (0% on day 7, 0% on day 21) (Fig. 1B to E). However, conventional female C57BL/6 mice treated with cefoperazone in their water for 1 week (days −7 to 0) followed by a single oral gavage of C. albicans CHN1 on day 0 showed a consistent, steady low level of colonization at day 7 and day 21 throughout the intestinal tract (pSI, 100% on day 7, 86% on day 21; dSI, 100% on day 7, 94% on day 21; cecum, 100% on day 7, 88% on day 21; colon, 91% on day 7, 91% on day 21) (Fig. 1B to E). In general, the levels of colonization were similar to those in germfree mice at the same time points (Fig. 1A). Untreated mice and mice treated only with cefoperazone never had any detectable C. albicans growth at any time point. Thus, an intact indigenous microbiota is required for effective resistance against C. albicans colonization in the intestinal tract.
Fig 1.
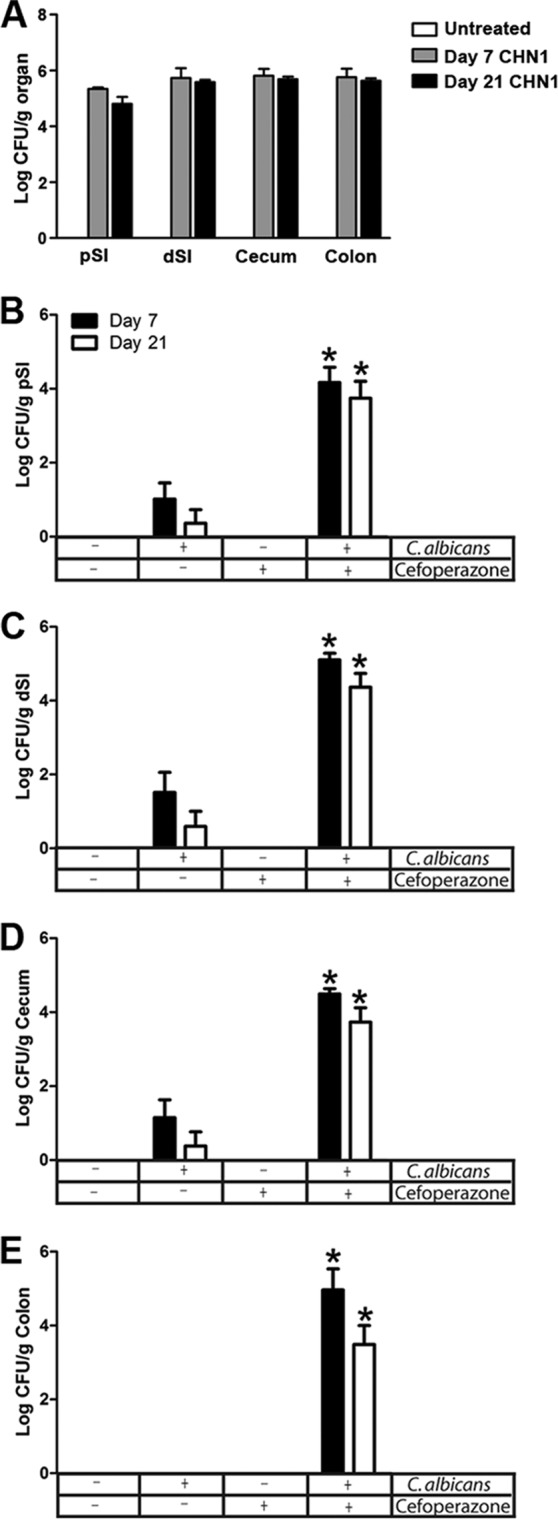
C. albicans colonization of germfree and conventional mice. (A) Germfree mice were given a single oral gavage of C. albicans CHN1, and the GI organs were removed at days 7 and 21 postgavage. The pSI, dSI, cecum, and colon were removed at day 7 or day 21 and differentially cultured to determine C. albicans colonization. All germfree colonized mice had detectable C. albicans at all times points. (B to E) The GI organs of conventional mice were removed at day 7 and day 21 postgavage (C. albicans CHN1) with or without pretreatment with cefoperazone. The organs were differentially cultured to determine C. albicans CHN1 colonization. Untreated mice and cefoperazone-only mice had no detectable C. albicans CHN1 colonization. The error bars represent the standard errors of the mean. *, P < 0.05 versus untreated mice.
C. albicans colonization does not cause overt inflammation in the murine cecum.
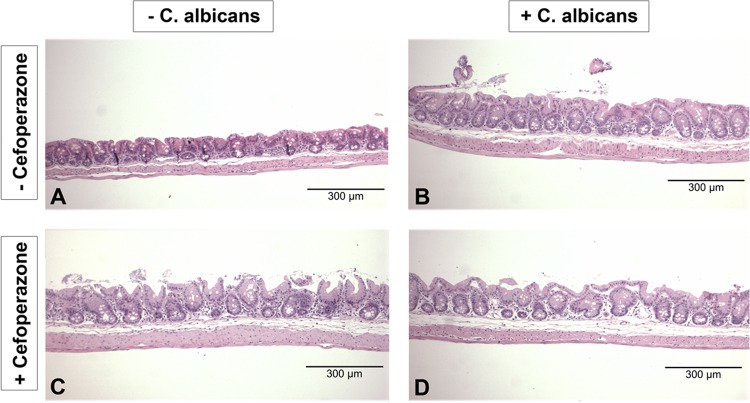
To look for any evidence of inflammatory infiltrates or changes in the cecal epithelium, we examined H&E-stained histological samples of ceca from these mice. C. albicans colonization of the cecum in the presence or absence of cefoperazone treatment did not result in overt inflammation at day 7 (data not shown) or day 21 (Fig. 2A to D). Consistent with our previous studies (13), the limiting ridge of the stomach showed erosions at day 7 and day 21 (data not shown), while the pSI, dSI, and colon did not show signs of overinflammation at any time point (data not shown).
Fig 2.
C. albicans colonization of the murine cecum does not result in histological inflammation. Histological H&E sections of the murine cecum were examined to look for evidence of inflammation during cefoperazone-induced microbiota disruption. All treatment groups (untreated, cefoperazone only, C. albicans only, and cefoperazone plus C. albicans) had no histological evidence of inflammation during microbiota disruption at day 7 (data not shown) and day 21 (A to D).
Low-level colonization by C. albicans causes alterations of the cecal bacterial microbiota during recovery from antibiotic disruption.
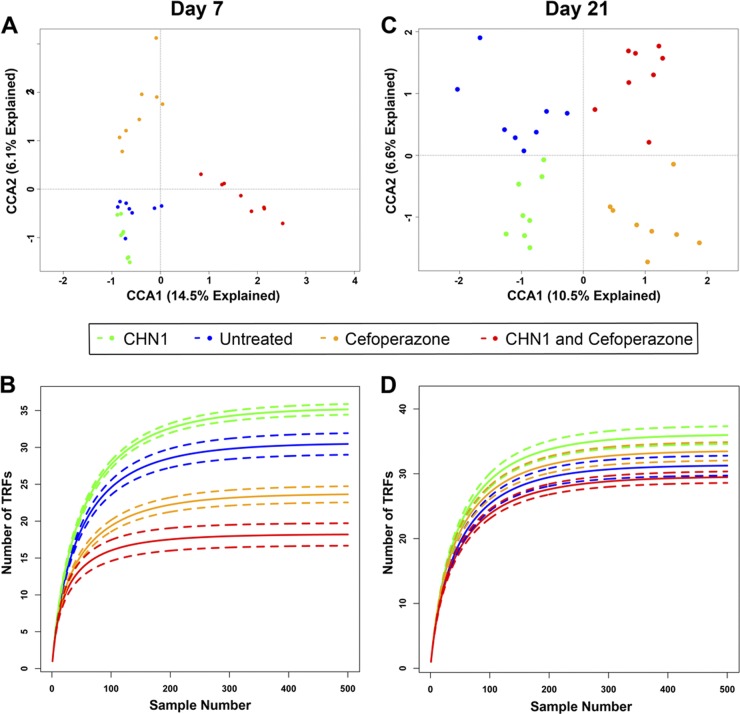
To determine if the presence of C. albicans altered the postantibiotic reassembly of the cecal microbiome, we utilized T-RFLP analysis to monitor changes in the microbial community structure over time. Initially, an ordination of the data was carried out on T-RFLP data using CCA, where the data were constrained by the treatment that the mice received. Since each sample has many data points generated from individual category measurements within that sample (e.g., levels of individual TRFs), samples can be further analyzed by ordination methods, such as correspondence analysis (CA), to reveal patterns in the data set that could not be found by analyzing each variable separately. Correspondence analysis reduces the dimensionality (or categories) of the data by combining multiple data categories to create fewer total categories, with each of these new categories being a “best-fit” relationship function between specific categories of data. From this, patterns in the data can be identified that cannot be found by analyzing each variable separately. This is accomplished by plotting the sample data on two or more axes, where each axis is one of the newly derived categories and increasing distance between samples corresponds to increasing dissimilarity (or differences) between samples. The first axis is the function that can predict the greatest amount of the data relationship, while the second axis is the function that can predict the second greatest, etc. Statistical tests can be applied to the data in the samples. At day 7 (Fig. 3A), untreated mice or mice treated with C. albicans alone had communities that were not statistically significantly different (P > 0.05). Mice treated with cefoperazone or cefoperazone and C. albicans had communities that had significantly shifted, as seen from the large shift along the first canonical axis (P < 0.05). The bacterial communities in cefoperazone-treated mice were significantly different from those in mice treated with cefoperazone and then gavaged with C. albicans, suggesting that the presence of C. albicans during antibiotic disruption alters the community.
Fig 3.
Cefoperazone and C. albicans alter bacterial diversity in the murine cecum. Rarefaction analysis was performed on the TRFs found in the T-RFLP analysis at days 7 (B) and 21 (D). The solid lines indicate the mean rarefied values, whereas the dashed lines indicate the standard errors (n = 8 per group). (A and C) Canonical correspondence analysis of the day 7 (A) and day 21 (C) communities; the data were constrained by treatment type. Both models were significant (P < 0.05 [anova.cca]), and both CCA1 and CCA2 were found to be significant axes (P < 0.05) at both time points.
Rarefaction curves at day 7 (Fig. 3B) suggest that the diversity is reduced by antibiotic treatment in the presence or absence of C. albicans, with a trend toward differences in total diversity between groups. At day 21 (Fig. 3C), bacterial community differences were observed between all four groups (P < 0.05). The greatest differences were seen between animals treated with cefoperazone and those that were not. These data suggest that during antibiotic disruption, the presence of C. albicans can alter the bacterial community structure. Rarefaction curves at day 21 (Fig. 3D) suggest that the presence of C. albicans changes the diversity of the cecal bacterial populations.
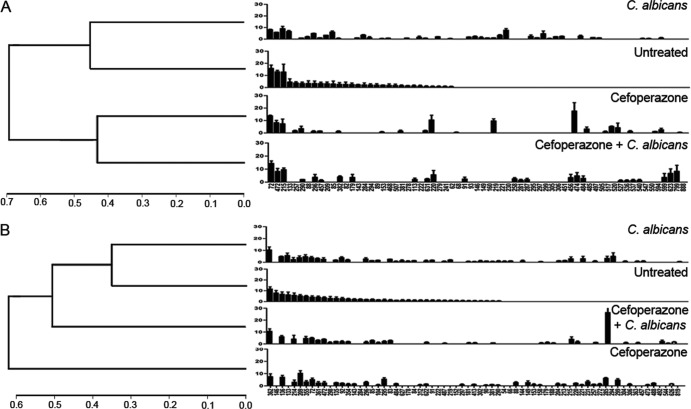
A furthest-neighbor hierarchical cluster analysis was performed to create an average dendrogram. At day 7 posttreatment, all experimental groups had bacterial populations that were different from those of untreated mice. Based upon Bray-Curtis distances, cefoperazone was the main driving force for changes in the cecal microbiome at day 7 (Fig. 4A). At day 21 post-antibiotic treatment, the presence of C. albicans altered the bacterial community more than the effects of C. albicans alone (Fig. 4B). We generated rank abundance graphs of the T-RFLP analysis to examine changes in the cecal bacterial microbiome during recovery from antibiotic treatment (Fig. 4A and B). The disappearance of some TRFs and the appearance of new TRFs after antibiotic cessation indicate that the cecal bacterial community structure is altered over time by cefoperazone treatment.
Fig 4.
Cefoperazone alters short-term bacterial diversity, but C. albicans alters bacterial diversity in the murine cecum long term. The cecum was removed and analyzed using T-RFLP. Rank abundance plots were constructed from TRFs in each of the experimental groups at day 7 (A) and day 21 (B). The error bars represent the standard errors of the mean, where the mean is pooled TRFs from individual mice within each experimental group. The Bray Curtis distance was determined to compare each experimental group at day 7 and day 21.
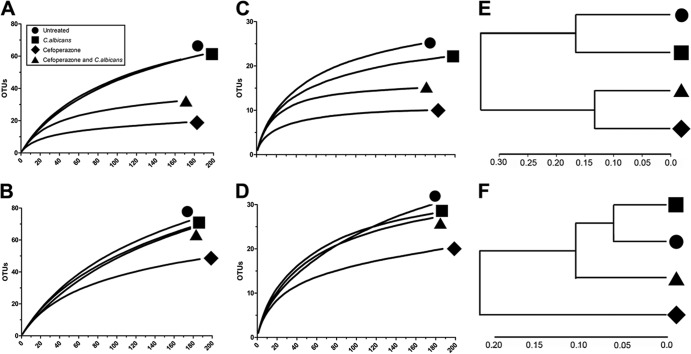
To confirm and extend the results of the T-RFLP analysis, 16S rRNA gene clone libraries were constructed and analyzed with DOTUR to determine the number of OTUs in the samples. To examine bacterial diversity in the ceca of the various groups, rarefaction curves were created with phylotypes based on an OTU definition of 97% sequence similarity. At day 7, bacterial diversity was lower in the microbial communities from both cefoperazone-treated mice and cefoperazone-treated, C. albicans-colonized mice (Fig. 5A and E). This analysis was repeated using an OTU definition of 90% sequence similarity. Again, both the cefoperazone-only and cefoperazone-plus-C. albicans groups maintained reduced phylotype richness (Fig. 5C). Untreated mice and C. albicans gavage-only mice had similar phylotype richness at both OTU definitions (Fig. 5A, C, And E). At day 21, using OTU sequence similarity definitions of both 97% and 90%, only the cefoperazone-treated mice had reduced phylotype richness compared to all other experimental groups (Fig. 5B, D, And F). Based upon Bray-Curtis distances, cefoperazone was the significant force for changes in the cecal microbiome at day 7 and day 21 (Fig. 5E and F). While cefoperazone-plus-C. albicans mice had altered bacterial communities at day 7, based on the Bray-Curtis distance, these populations were beginning to recover by day 21 (Fig. 5E and F). Thus, the presence of C. albicans in cefoperazone-treated mice was associated with a recovery of bacterial community diversity in the period between days 7 and 21.
Fig 5.
Rarefaction analysis of microbial communities in the murine cecum. The number of OTUs for each experimental treatment group was used to construct rarefaction curves from clone library data with an OTU definition of 97% (A and B) or 90% (C and D) sequence similarity. (E and F) Comparison of the cecal communities in untreated animals and in animals treated with cefoperazone alone, C. albicans alone, and cefoperazone plus C. albicans at day 7 (E) and day 21 (F) using an OTU definition of 97% similarity in the Bray-Curtis similarity metric; the results are displayed in dendrogram format.
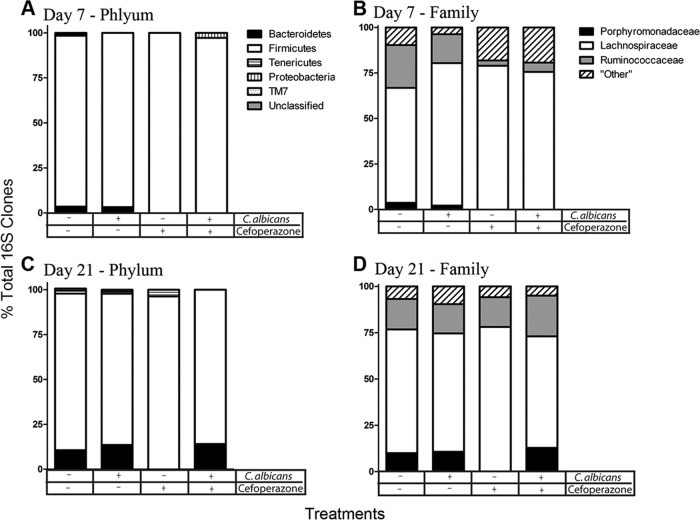
We further analyzed the 16S rRNA gene clone libraries using the RDP classifier to generate taxonomic identification of the clones. At the phylum classification level, untreated mice and untreated mice gavaged with C. albicans had similar levels of Bacteroidetes (Fig. 6A). Both cefoperazone and cefoperazone-plus-C. albicans mice were markedly depleted in Bacteroidetes at day 7, but the phylum had recovered to match the levels observed in untreated mice by day 21 in cefoperazone-treated mice if C. albicans was present (Fig. 6C). At the family level, this difference in Bacteroidetes was reflected in relative changes in the Porphyromonadaceae. A single member of the Firmicutes, the Ruminococcaceae, was also depressed at day 7 in both groups of mice treated with cefoperazone (Fig. 6B and D). Overall, the shifts in diversity noted in the rarefaction curves (Fig. 5) are largely reflected in changes in Bacteroidetes membership (Fig. 6).
Fig 6.
Bacterial composition of the murine cecum during C. albicans colonization. Clone libraries were constructed to investigate the relative abundances of the bacteria in the murine cecum at day 7 (A and B) and day 21 (C and D). Bacterial populations are shown as percentages of the total 16S rRNA clones for each treatment group. Cefoperazone treatment in the presence or absence of C. albicans diminished Bacteroidetes populations in the cecum at day 7. At day 21, the presence of C. albicans during recovery from cefoperazone resulted in recovery of Bacteroidetes populations, while there was no recovery in cefoperazone-only mice.
Effect of cefoperazone and C. albicans on LAB levels.
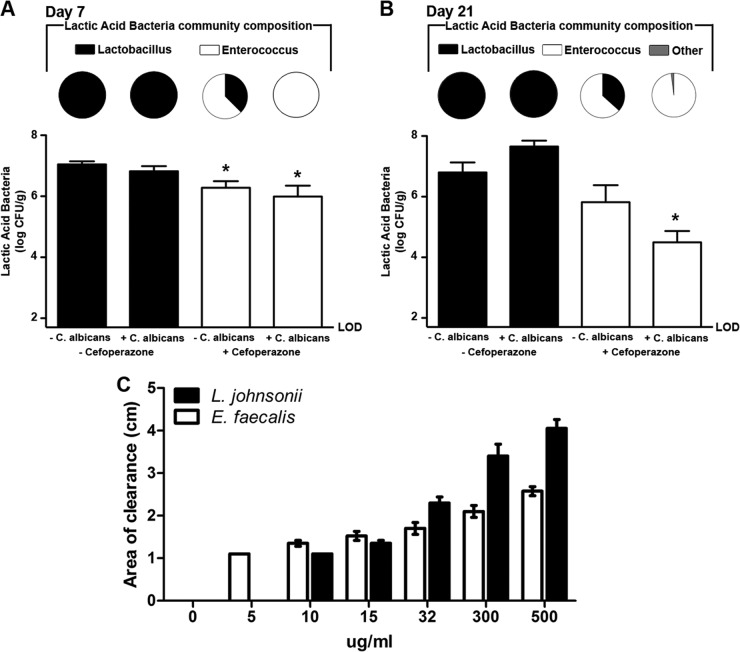
We previously found that both cefoperazone treatment and C. albicans can alter the LAB levels in the stomachs of mice (13). Therefore, we utilized selective plating to determine the effects of cefoperazone and C. albicans on the LAB in the murine cecum, and all resulting colonies were further identified through PCR amplification of the 16S rRNA gene. At day 7, untreated mice and C. albicans-only mice had LAB populations that were predominantly Lactobacillus spp. (Fig. 7A). In contrast, cefoperazone-only or cefoperazone-plus-C. albicans mice had LAB populations dominated by E. faecalis (Fig. 7A). Cefoperazone, in the presence or absence of C. albicans, promoted the outgrowth of E. faecalis populations in the murine cecum short term. At day 21, untreated and C. albicans-only mice continued to have LAB populations that were predominantly Lactobacillus (Fig. 7B). There was a decrease in Enterococcus populations and an increase in lactobacilli in mice treated with cefoperazone only, potentially suggesting that the Lactobacillus populations were beginning to recover in these mice. However, mice treated with cefoperazone plus C. albicans did not recover their Lactobacillus populations at day 21. The LAB populations in these mice continued to be predominantly Enterococcus, indicating that the presence of C. albicans during cefoperazone recovery alters the LAB populations for at least 21 days after antibiotic treatment.
Fig 7.
C. albicans CHN1 during antibiotic treatment promotes E. faecalis growth in the murine cecum. (A and B) The cecum was removed at day 7 (A) and day 21 (B) postantibiotic and differentially cultured to determine total LAB colonization in untreated, cefoperazone-treated, C. albicans-only, or cefoperazone-plus-C. albicans mice (graphs). LAB colonies that grew on MRS-plus-azide agar were further identified, using colony PCR as described in Materials and Methods, and expressed as a fraction of the total LAB population in that group (pie charts). The error bars represent the standard errors of the mean (*, P < 0.05 compared to untreated mice). (C) E. faecalis and L. johnsonii were isolated from the cecum of a cefoperazone-treated mouse, and their in vitro susceptibilities to cefoperazone were determined. The error bars represent the standard errors of the mean. No statistical significance was found between any of the groups (n = 3 to 6/group).
We also sought to determine if the E. faecalis and Lactobacillus johnsonii bacteria isolated from the post-cefoperazone treatment murine cecum were susceptible to cefoperazone. An in vitro cefoperazone susceptibility assay indicated that both E. faecalis and L. johnsonii were susceptible to concentrations of cefoperazone that were far lower than the concentration administered in the mouse drinking water (Fig. 7C). Thus, despite being susceptible to cefoperazone in vitro, these two species of LAB grew out from the murine cecum within a week post-cefoperazone treatment.
DISCUSSION
This study investigated the ability of C. albicans to influence the indigenous microbiota of the murine cecum during reassembly following broad-spectrum antibiotic treatment. We utilized culture-independent and culture-dependent approaches to demonstrate that colonization by nonpathogenic C. albicans can significantly alter the bacterial microbiome during recovery from cefoperazone treatment. The presence of C. albicans in the antibiotic-disrupted bacterial community of the murine cecum was associated with suppressed regrowth of Lactobacillus populations, implicating C. albicans in antagonizing Lactobacillus in vivo. The presence of C. albicans also promoted the recovery of Bacteroidetes populations during antibiotic recovery. While previous studies have focused on the ability of bacteria to alter C. albicans, this study addressed the ability of C. albicans to alter the host microbiota during nonpathogenic colonization.
Within a few days or weeks after birth, nonpathogenic C. albicans colonizes the GI tracts of humans (27). C. albicans often persists in the GI tract for long periods without causing any overt disease, and mouse models have relied upon major disruptions of the host immune system of the GI microbiota to promote the development of disease by C. albicans (8, 28, 29). Our germfree and conventional data confirm previous studies demonstrating that the bacterial microbiota plays an important role in preventing Candida dissemination and disease (10, 13, 20–22, 36). C. albicans adapts to the GI environment through the expression of genes, such as the transcription factors encoded by EFH1 and CPH2, to maintain colonization in the GI tract during bacterial-microbiota disruption (25, 36). Other factors involved with adherence, such as ECE1, can promote GI colonization (19). To minimize alterations in the bacterial microbiota in our studies, all mice were female C57BL/6 mice, 7 to 9 weeks old, from Jackson Laboratories. The standardization of our mouse genetics, age, and vendor source helped to minimize changes in the GI microbiota due to these factors. This study is one of the first to investigate the ability of C. albicans to alter the microbiota in a nonpathogenic state, resulting in increased fungal GI colonization. Further studies must be conducted to determine the mechanisms behind the C. albicans-induced alterations in bacterial populations.
We propose that the subsequent changes in the bacterial biota may be in response to the change in C. albicans gene expression during cecal colonization following antibiotic-induced disruption of the microbiota. Candida colonization varies by both mucosal site and Candida species and strain (24, 31). It is important to note that the differences between C. albicans strains are not well understood, and even Candida species show altered organ specificity during GI colonization, as demonstrated by Candida pintolopesii preferentially colonizing the murine stomach (2). Gene expression studies of C. albicans during colonization or systemic infection demonstrate that cecal colonization results in altered C. albicans gene expression compared to that in a disease state. Secreted aspartic proteases, well-known C. albicans virulence factors, are not strongly upregulated during normal colonization of the murine cecum (25). Other genes typically found during invasive growth in the host (i.e., DEF1 and DFG16) were also not upregulated during cecal colonization. CPH2, a transcription factor, is required for the establishment of normal levels of C. albicans in the murine ceca in an EFG1-independent mechanism (25, 36). This suggests that C. albicans responds and adapts to its presence in different environments within the host. Broad-spectrum antibiotics work by reducing bacterial populations to create niches for fungal colonization where C. albicans normally does not colonize. Additional studies are required to reveal further features of C. albicans adaptation to the host environment during antibiotic recolonization.
One interesting finding of this study was the ability of C. albicans to promote Enterococcus populations and to antagonize Lactobacillus population recovery following cefoperazone treatment. The ability of Lactobacillus to antagonize C. albicans growth, adhesion, and hyphal transformation is well documented. Lactobacillus can displace Candida from the epithelium (29), prevent germ tube formation (21, 22), and inhibit hyphal invasion (29, 35). Here, we demonstrate that this antagonism can be a bidirectional process. Further, the presence of C. albicans during antibiotic recovery promoted the persistence of E. faecalis. E. faecalis is a species of major concern in hospital settings due to its ability to acquire antibiotic resistance genes and survive in a broad range of pH environments (18). Enterococcus is typically found in relatively low abundance in the GI tract but is well adapted to survival along the mucosa through its ability to adhere to multiple epithelial and extracellular matrix proteins (5). Recent work has demonstrated that oral antibiotics in mice downregulate RegIIIγ, a C-type lectin that inhibits the growth of Enterococcus spp. (3). Regardless of the antibiotic treatment, RegIIIγ has no fungicidal activity (4). A potential mechanism of our model may be the downregulation of RegIIIγ by antibiotics and/or by C. albicans, resulting in Enterococcus overgrowth. Little is known about LAB niche competition within the GI tract or the C. albicans-Enterococcus agonism. However, due to the medical relevance of both species, further studies investigating the potential symbiosis may provide new insights for treatments.
The interactions between C. albicans and the Bacteroidetes are not well investigated. Previous studies have demonstrated the ability of C. albicans to interact or compete with bacteria, but most of these studies demonstrate interactions with members of the Firmicutes (14). Our work demonstrates that C. albicans can promote the recovery of Bacteroidetes populations during antibiotic recovery. The mechanism behind this is not understood, but potential interactions include the following: C. albicans could provide a binding or attachment mechanism for Bacteroidetes to promote their recolonization in the cecum, yeast glucans could serve as a potential food source for Bacteroidetes, or C. albicans may suppress bacteria that usually compete with Bacteroidetes. Bacteroidetes is a prominent phylum in the human GI tract, and alterations in Bacteroidetes populations have been associated with changes in host health (12). Further studies are needed to dissect the potential interaction between Bacteriodetes and C. albicans during antibiotic recovery.
This study demonstrated the ability of C. albicans to alter the microbiota of the murine gut during antibiotic recolonization. During nonpathogenic colonization, C. albicans promoted the recovery of Bacteroidetes populations, antagonized L. johnsonii populations, and promoted the persistence of E. faecalis populations in the cecum. These data demonstrate that while the microbiota can prevent C. albicans overgrowth, C. albicans can also alter the microbiota. Unpublished data from our laboratory demonstrate that changes in LAB in the cecum are long term (up to 58 days posttreatment), showing that the changes in the bacterial microbiota are not transient. In the absence of Candida-induced inflammation or invasion, there is a bidirectional interaction between normal members of the fungal and bacterial microbiota of the human gut. A more complete understanding of the interactions occurring during antibiotic recovery could aid in our understanding of the relationship between the microbiota, C. albicans, and the host, leading to novel treatments for diseases in the future.
ACKNOWLEDGMENTS
We thank Rod McDonald for his technical support.
This work was supported in part by grant R21-AI087869 (G.B.H.), NIH NIDDK grant P30DK034933 (G.B.H.), NIH grant UL1 RR024986 (Michigan Institute for Clinical and Health Research) and a Frederick G. Novy Fellowship (K.L.M.), NIDDK R01DK070875 (V.B.Y.), and KO8 DK0669907-01 (J.Y.K.).
Footnotes
Published ahead of print 9 July 2012
REFERENCES
- 1. Antonopoulos DA, et al. 2009. Reproducible community dynamics of the gastrointestinal microbiota following antibiotic perturbation. Infect. Immun. 77:2367–2375 [DOI] [PMC free article] [PubMed] [Google Scholar]
- 2. Artwohl J, McCLain A, Cera L. 1988. Population changes of indigenous murine Candida pintolopesii under various experimental conditions and routes of inoculation. Appl. Environ. Microbiol. 54:2371–2374 [DOI] [PMC free article] [PubMed] [Google Scholar]
- 3. Brandl K, et al. 2008. Vancomycin-resistant enterococci exploit antibiotic-induced innate immune deficits. Nature 455:804–807 [DOI] [PMC free article] [PubMed] [Google Scholar]
- 4. Cash HL, Whitham CV, Behrendt CL, Hooper LV. 2006. Symbiotic bacteria direct expression of an intestinal bactericidal lectin. Science 313:1126–1130 [DOI] [PMC free article] [PubMed] [Google Scholar]
- 5. Franz CM, Holzapfel WH, Stiles ME. 1999. Enterococci at the crossroads of food safety? Int. J. Food Microbiol. 47:1–24 [DOI] [PubMed] [Google Scholar]
- 6. Hummel RP, Oestreicher EJ, Maley MP, Macmillan BG. 1973. Inhibition of Candida albicans by Escherichia coli in vitro and in the germfree mouse. J. Surg. Res. 15:53–58 [DOI] [PubMed] [Google Scholar]
- 7. Kennedy MJ. 1981. Inhibition of Candida albicans by the anaerobic oral flora of mice in vitro. Sabouraudia 19:205–208 [PubMed] [Google Scholar]
- 8. Kennedy MJ, Volz PA. 1985. Ecology of Candida albicans gut colonization: inhibition of Candida adhesion, colonization, and dissemination from the gastrointestinal tract by bacterial antagonism. Infect. Immun. 49:654–663 [DOI] [PMC free article] [PubMed] [Google Scholar]
- 9. Kennedy MJ, Volz PA. 1985. Effect of various antibiotics on gastrointestinal colonization and dissemination by Candida albicans. Sabouraudia 23:265–273 [DOI] [PubMed] [Google Scholar]
- 10. Koh AY, Kohler JR, Coggshall KT, Van Rooijen N, Pier GB. 2008. Mucosal damage and neutropenia are required for Candida albicans dissemination. PLoS Pathog. 4:e35 doi:10.1371/journal.ppat.0040035 [DOI] [PMC free article] [PubMed] [Google Scholar]
- 11. Kuehl CJ, Wood HD, Marsh TL, Schmidt TM, Young VB. 2005. Colonization of the cecal mucosa by Helicobacter hepaticus impacts the diversity of the indigenous microbiota. Infect. Immun. 73:6952–6961 [DOI] [PMC free article] [PubMed] [Google Scholar]
- 12. Ley RE, et al. 2005. Obesity alters gut microbial ecology. Proc. Natl. Acad. Sci. U. S. A. 102:11070–11075 [DOI] [PMC free article] [PubMed] [Google Scholar]
- 13. Mason KL, et al. 2012. Interplay between the gastric bacterial microbiota and Candida albicans during postantibiotic recolonization and gastritis. Infect. Immun. 80:150–158 [DOI] [PMC free article] [PubMed] [Google Scholar]
- 14. Morales DK, Hogan DA. 2010. Candida albicans interactions with bacteria in the context of human health and disease. PLoS Pathog. 6:e1000886 doi:10.1371/journal.ppat.1000886 [DOI] [PMC free article] [PubMed] [Google Scholar]
- 15. Nagalingam NA, Kao JY, Young VB. 2011. Microbial ecology of the murine gut associated with the development of dextran sodium sulfate-induced colitis. Inflamm. Bowel Dis. 17:917–926 [DOI] [PMC free article] [PubMed] [Google Scholar]
- 16. Nagalingam NA, Lynch SV. 2012. Role of the microbiota in inflammatory bowel diseases. Inflamm. Bowel Dis. 18:968–984 [DOI] [PubMed] [Google Scholar]
- 17. Naglik, Fidel PL, Jr, Odds FC. 2008. Animals models of mucosal Candida infection. FEMS Microbiol. Lett. 283:129–139 [DOI] [PMC free article] [PubMed] [Google Scholar]
- 18. Nakajo K, et al. 2006. Resistance to acidic and alkaline environments in the endodontic pathogen Enterococcus faecalis. Oral Microbiol. Immunol. 21:283–288 [DOI] [PubMed] [Google Scholar]
- 19. Nobile CJ, Mitchell AP. 2005. Regulation of cell-surface genes and biofilm formation by the C. albicans transcription factor Bcr1p. Curr. Biol. 15:1150–1155 [DOI] [PubMed] [Google Scholar]
- 20. Noverr MC, Falkowski NR, McDonald RA, McKenzie AN, Huffnagle GB. 2005. Development of allergic airway disease in mice following antibiotic therapy and fungal microbiota increase: role of host genetics, antigen, and interleukin-13. Infect. Immun. 73:30–38 [DOI] [PMC free article] [PubMed] [Google Scholar]
- 21. Noverr MC, Huffnagle GB. 2004. Regulation of Candida albicans morphogenesis by fatty acid metabolites. Infect. Immun. 72:6206–6210 [DOI] [PMC free article] [PubMed] [Google Scholar]
- 22. Noverr MC, Noggle RM, Toews GB, Huffnagle GB. 2004. Role of antibiotics and fungal microbiota in driving pulmonary allergic responses. Infect. Immun. 72:4996–5003 [DOI] [PMC free article] [PubMed] [Google Scholar]
- 23. Paster BJ, et al. 2001. Bacterial diversity in human subgingival plaque. J. Bacteriol. 183:3770–3783 [DOI] [PMC free article] [PubMed] [Google Scholar]
- 24. Rahman D, Mistry M, Thavaraj S, Challacombe SJ, Naglik JR. 2007. Murine model of concurrent oral and vaginal Candida albicans colonization to study epithelial host-pathogen interactions. Microbes Infect. 9:615–622 [DOI] [PMC free article] [PubMed] [Google Scholar]
- 25. Rosenbach A, Dignard D, Pierce JV, Whiteway M, Kumamoto CA. 2010. Adaptations of Candida albicans for growth in the mammalian intestinal tract. Eukaryot. Cell 9:1075–1086 [DOI] [PMC free article] [PubMed] [Google Scholar]
- 26. Ruiz-Sanchez D, Calderon-Romero L, Sanchez-Vega JT, Tay J. 2002. Intestinal candidiasis. A clinical report and comments about this opportunistic pathology. Mycopathologia 156:9–11 [DOI] [PubMed] [Google Scholar]
- 27. Russell C, Lay KM. 1973. Natural history of Candida species and yeasts in the oral cavities of infants. Arch. Oral Biol. 18:957–962 [DOI] [PubMed] [Google Scholar]
- 28. Samonis G, Anaissie EJ, Bodey GP. 1990. Effects of broad-spectrum antimicrobial agents on yeast colonization of the gastrointestinal tracts of mice. Antimicrob. Agents Chemother. 34:2420–2422 [DOI] [PMC free article] [PubMed] [Google Scholar]
- 29. Savage DC. 1969. Microbial interference between indigenous yeast and lactobacilli in the rodent stomach. J. Bacteriol. 98:1278–1283 [DOI] [PMC free article] [PubMed] [Google Scholar]
- 30. Schloss PD, et al. 2009. Introducing mothur: open-source, platform-independent, community-supported software for describing and comparing microbial communities. Appl. Environ. Microbiol. 75:7537–7541 [DOI] [PMC free article] [PubMed] [Google Scholar]
- 31. Taylor BN, Jr, et al. 2000. In vivo virulence of Candida albicans isolates causing mucosal infections in people infected with the human immunodeficiency virus. J. Infect. Dis. 182:955–959 [DOI] [PubMed] [Google Scholar]
- 32. van der Waaij D. 1987. Colonization resistance of the digestive tract—mechanism and clinical consequences. Nahrung 31:507–517 [DOI] [PubMed] [Google Scholar]
- 33. van der Waaij D, Berghuis JM. 1974. Determination of the colonization resistance of the digestive tract of individual mice. J. Hyg. 72:379–387 [DOI] [PMC free article] [PubMed] [Google Scholar]
- 34. Van der Waaij D, Van der Waaij BD. 1990. The colonization resistance of the digestive tract in different animal species and in man; a comparative study. Epidemiol. Infect. 105:237–243 [DOI] [PMC free article] [PubMed] [Google Scholar]
- 35. Wagner RD, et al. 2000. Probiotic effects of feeding heat-killed Lactobacillus acidophilus and Lactobacillus casei to Candida albicans-colonized immunodeficient mice. J. Food Prot. 63:638–644 [DOI] [PubMed] [Google Scholar]
- 36. White SJ, et al. 2007. Self-regulation of Candida albicans population size during GI colonization. PLoS Pathog. 3:e184 doi:10.1371/journal.ppat.0030184 [DOI] [PMC free article] [PubMed] [Google Scholar]


