Abstract
We previously showed that two thyroid hormone receptor (TR) isoforms – TRα1 and TRβ1 – differentially regulate thyroid hormone (triiodothyroxine, T3)-stimulated adipogenesis in vivo. This study aims to understand the role of the nuclear receptor corepressor, NCoR1, in TR isoform-dependent adipogenesis. We found that T3-stimulated adipogenesis of 3T3-L1 cells was accompanied by progressive loss of NCoR1 protein levels. In 3T3-L1 cells stably expressing a mutated TRα1, PV (L1-α1PV cells), the T3-stimulated adipogenesis was more strongly inhibited than that in 3T3-L1 cells stably expressing an identical mutation in TRβ1 (L1-β1PV cells). The stronger inhibition of adipogenesis in L1-α1PV cells was associated with a higher NCoR1 protein level. These results indicate that the degree of loss of NCoR1 correlates with the extent of adipogenesis. siRNA knockdown of NCoR1 promoted adipogenesis of control 3T3-L1 cells and reversed the inhibited adipogenesis of L1-α1PV and L1-β1PV cells, indicating that NCoR1 plays an essential role in TR isoform-dependent adipogenesis. An ubiquitin ligase, mSiah2, that targets NCoR1 for proteasome degradation was upregulated on day 1 before the onset of progressive loss of NCoR1. NCoR1 was found to associate with mSiah2 and with TR, TRα1PV, or TRβ1PV, but a stronger interaction of NCoR1 with TRα1PV than with TRβ1PV was detected. Furthermore, TRα1PV–NCoR1 complex was more avidly recruited than TRβ1PV–NCoR1 to the promoter of the C/ebpα gene, leading to more inhibition in its expression. These results indicate that differential interaction of NCoR1 with TR isoforms accounted for the TR isoform-dependent regulation of adipogenesis and that aberrant interaction of NCoR1 with TR could underlie the pathogenesis of lipid disorders in hypothyroidism.
Introduction
Thyroid hormone (triiodothyroxine, T3) plays a critical role in the regulation of thermogenesis and maintenance of lipid homeostasis. T3 deficiency in hypothyroidism leads to increased body weight and cold intolerance. Excess T3 in hyperthyroidism reduces plasma low-density lipoprotein cholesterol, lipoproteins, and triglycerides and leads to weight loss. T3 acts via binding to thyroid hormone receptors (TRs), which are members of the nuclear receptor superfamily. TRs are ligand-dependent transcription factors encoded by two different genes, THRA and THRB, to give rise to T3-binding TR isoforms, α1, β1, β2, and β3. TRs regulate transcription by binding to the thyroid hormone response elements (TREs) in the promoter regions of T3 target genes (Cheng 2000).
We previously created two knockin mutant mice by targeting an identical mutation (denoted as PV) to the Thra gene (Thra1PV mouse) (Kaneshige et al. 2001) or the Thrb gene (ThrbPV mouse) (Kaneshige et al. 2000) at the corresponding C-terminus. The PV mutation, identified in a patient with resistance to thyroid hormone (RTH), is due to a C-insertion at codon 448 of the TRβ1 that leads to complete loss of T3 binding activity and transcription activation capacity (Parrilla et al. 1991, Meier et al. 1992). The Thra1PV mouse displays a lean phenotype, partly owing to the reduction in white adipose tissue (WAT) mass (Ying et al. 2007). Though no abnormality in the WAT of ThrbPV mice was detected, the liver of ThrbPV mice was enlarged with excess accumulation of lipids. These observations indicate that TRα1 and TRβ1 differentially regulate lipid metabolism in vivo (Ying et al. 2007, Araki et al. 2009). Subsequently, using the model cell line of adipogenesis, we found that 3T3-L1 cells stably express equal abundance of TRα1PV (L1-α1PV) or TRβ1PV (L1-β1PV) (Mishra et al. 2010), but the T3-stimulated adipogenesis is more severely impaired in L1-α1PV than in L1-β1PV cells. The expression of two master regulators, the peroxisome proliferator-activated receptor γ (Pparγ) and CCAAT/enhancer-binding protein α (C/ebpα), is more repressed in L1-α1PV than in L1-β1PV cells (Mishra et al. 2010). The studies indicated that TR isoforms have intrinsic differential roles in the differentiation and maturation of preadipocyte 3T3-L1 cells. However, the mechanism of these intrinsic differential roles in adipogenesis is not well understood.
The nuclear receptor corepressor, NCoR1, is a TR interacting protein that mediates ligand-independent inhibition of gene transcription for positively regulated T3 target genes (Horlein et al. 1995). In the absence of T3, NCoR1 is recruited by TRs to mediate transcription repression (Cohen et al. 2001, Astapova et al. 2009). In the presence of T3, however, NCoR1 is released and coactivators are recruited for the gene activation (Perissi et al. 2010). Thus, transcription repression by NCoR1 plays a critical role in the gene regulatory activity of TRs (Perissi et al. 2010). Studies have indicated that aberrant interaction of NCoR1 with TRβ mutants, leading to its impaired dissociation from TR by T3, is implicated in the pathogenesis of RTH (Yoh et al. 1997, Yoh and Privalsky 2000). Moreover, the fact that NCoR1 plays a role in adipogenesis of 3T3-L1 cells was demonstrated by Yu et al. 2005 in which the recruitment of NCoR1 by the unliganded PPARγ, the master of adipogenesis, leads to the repression of its transcriptional activity, thereby impairing adipogenesis of 3T3-L1 cells.
In view of these findings, we hypothesized that NCoR1 could differentially interact with the unliganded TR isoforms to regulate TR isoform-dependent adipogenesis. The availability of 3T3-L1 cell lines stably expressing either TRα1PV (L1-α1PV cells) or TRβ1PV (L1-β1PV cells) (Mishra et al. 2010) allows us to test this possibility. Indeed, we found that in control 3T3-L1 cells that express wild-type TRs, T3-stimulated adipogenesis was accompanied by progressive loss of NCoR1 protein. The downregulation of NCoR1 depended on the TRs and the ubiquitin ligase mSiah2. A more severe impairment of T3-stimulated adipogenesis in L1-α1PV cells than in L1-β1PV cells was associated with a stronger inhibition of the degradation of NCoR1 in L1-α1PV than in L1-β1PV cells. NCoR1 was more resistant to mSiah2-mediated degradation when associated with TRα1PV than with TRβ1PV. This study indicates that the differential interaction of TR isoforms with NCoR1, at least in part, underlies the TR isoform-dependent regulation of adipogenesis.
Materials and methods
3T3-L1 cell lines stably expressing TRα1PV or TRβ1PV
Establishment of 3T3-L1 cell lines stably expressing mutant TRα1PV or TRβ1PV was previously described (Ying et al. 2007). The expression of TRα1PV or TRβ1PV protein was verified by western blot analysis using anti-Flag mouse monoclonal antibody (M2, 0·5 µg/ml, F-3165, Sigma Co.), anti-TRβ1 antibody (C4, 1 µg/ml (Bhat et al. 1995)), or monoclonal anti-PV antibody (#302, 2 µg/ml (Zhang et al. 2002)).
Lentiviral transduction in 3T3-L1 cells
A plasmid set expressing NCoR1 siRNA was purchased from Open Biosystems (Huntsville, AL, USA). The NCoR1 lentiviral stock was prepared at the NIH in-house facility (Frederick, MD, USA). Infection of 3T3-L1 cells with the NCoR1 lentiviruses was performed in serum-free DMEM medium for 12 h at 37 °C at a defined multiplicity of infection (MOIs) after preliminary testing. The medium was removed and replaced with fresh medium supplemented with puromycin at concentrations between 0·75 and 5·0 µg/ml for 2 days. After 48 h, cells were expanded in 6-well plates for the induction of differentiation.
Induction of adipocyte differentiation
Adipocyte differentiation was induced as described previously (Ying et al. 2007, Mishra et al. 2010). Briefly, the 3T3-L1 cells were maintained in DMEM with 4·5 g/l glucose, 10% calf serum, and penicillin–streptomycin at 5% CO2. After cells reached confluence, they were treated with 1 µM dexamethasone and 0·5 mM 3-isobutyl-1-methyl xanthine in the presence or absence of 2 nM T3 for 60 h. Thereafter, the cells were fed every other day with DMEM containing 10% resin-stripped fetal bovine serum with or without 2 nM T3 until being analyzed for matured adipocytes stained by Oil Red-O or harvested for other analyses. Quantification of the staining intensities was carried out by drying the stained plates, adding 10 ml isopropanol per 10-cm dish or 0·8 ml isopropanol per 3·5-cm dish and reading at OD510 against the control using a stained dish without cells.
RNA extraction and quantitative real-time PCR
On days 1, 2, and 6 after induction of differentiation, total RNA from 3T3-L1 cells (control cells), L1-α1PV cells, or L1-β1PV cells was isolated using TRIzol (Invitrogen) according to the manufacturer’s instructions. To determine NCoR1 expression level, quantitative real-time PCR was performed using a QuantiTect SYBR green RT-PCR kit (Qiagen). The following primers were used. NCoR1 forward: 5′-GCTGCAGGAGAGGTTTATCG-3′, NCoR1 reverse: 5′-CCTGCATCTGCTGTGAGGTA-3′ or the internal control, 18S forward: 5′-CTCAACACGGGAAACCTCAC-3′, 18S reverse: 5′-CGCTCCACCAACTAAGAACG-3′.
Western blot analysis
Western blot analysis was carried out as described previously (Ying et al. 2007, Mishra et al. 2010). The primary antibodies used in this analysis were anti-Flag mouse monoclonal antibody (M2, 0·5 µg/ml, F-3165, Sigma Co.), anti-TR antibody (C4, 1 µg/ml (Bhat et al. 1995)), anti-PV monoclonal antibody (#302, 2 µg/ml (Zhang et al. 2002)), anti-mSiah2 antibody (1:1000 dilution, ab72064, Abcam, Cambridge, MA, USA), or anti-GAPDH antibody (1:3000, #2118, Cell Signaling Technology, Danvers, MA, USA), and anti-NCoR1 #1975/1976 antibodies (1:100 dilution). The anti-NCoR1 #1975/1976 antibodies were prepared by immunizing the rabbits with keyhole limpet hemocyanin-conjugated peptide corresponding to amino acid residues 2321–2335 of the murine NCoR1 protein (ARRDEGEPSPHAGVC) (Sigma Genosys).
Co-immunoprecipitation assay
For co-immunoprecipitation (Co-IP) of NCoR1, TRs, and mSiah2, cells were treated in the absence or presence of T3 (2 nM). Cells were extracted with lysis buffer (100 mM Tris, 500 mM NaCl, 10 mM EDTA, and 1% NP-40) in the presence of 1×Halt phosphatase inhibitor cocktail solution (ThermoFisher Scientific, Waltham, MA, USA) and a proteinase inhibitor tablet solution (Complete Mini EDTA-free; Roche Diagnostics). Cellular lysates (each, 600–1000 µg) were immunoprecipitated with 4 µg anti-NCoR1 antibodies (#1975/1976), anti-TR, or anti-mSiah2 antibody, followed by western blot analysis using anti-NCoR1 (#1975/1976), anti-TRs, or anti-mSiah2 antibody to detect NCoR1, TRs, or mSiah2 respectively.
Chromatin immunoprecipitation
The chromatin immunoprecipitation (ChIP) assay was performed according to the manufacturer’s instructions and using the commercially available ChIP-IT kit (Active Motif, Carlsbad, CA, USA). Control 3T3-L1 cells and 3T3-L1 cells stably expressing flag-tagged TRα1PV or TRβ1PV were induced as described previously (Ying et al. 2007). On day 6 after induction of differentiation, chromatin was immunoprecipitated with IgG (control) and anti-NCoR1 antibody (PHQQ; 4 µg/ml, a generous gift from Dr Anthony N Hollenberg, Harvard Medical School). The amplification and analysis of precipitated chromatin DNAs were carried out as described previously (Mishra et al. 2010).
Statistical analysis
Experiments were performed with three to five replicates. All data are expressed as means±s.d. Statistical analysis was performed with the use of ANOVA; P value <0·05 was considered significant. ANOVA with Bonferroni’s post-test was performed using GraphPad Prism version 5·0 for Mac OS X (GraphPad Software, San Diego, CA, USA).
Results
TR isoform-dependent downregulation of NCoR1 during adipogenesis of 3T3-L1 cells
In previous studies using the model cell line of adipogenesis, we found that in 3T3-L1 cells stably expressing equal abundance of TRα1PV (L1-α1PV cells) and TRβ1PV (L1-β1PV cells) (Mishra et al. 2010), the T3-stimulated adipogenesis is more severely impaired in L1-α1PV than in L1-β1PV cells. Consistently, the expression of the master regulators, the Pparγ and the C/ebpα genes, and the key adipocyte differentiation marker, such as the lipoprotein lipase (Lpl) and aP2 (aP2) genes are more repressed in L1-α1PV than in L1-β1PV cells (Mishra et al. 2010). Because NCoR1 plays a critical role in TR-mediated gene repression, we reasoned that the differential interaction between NCoR1 and the two TR isoforms might also mediate TR isoform-dependent adipogenesis.
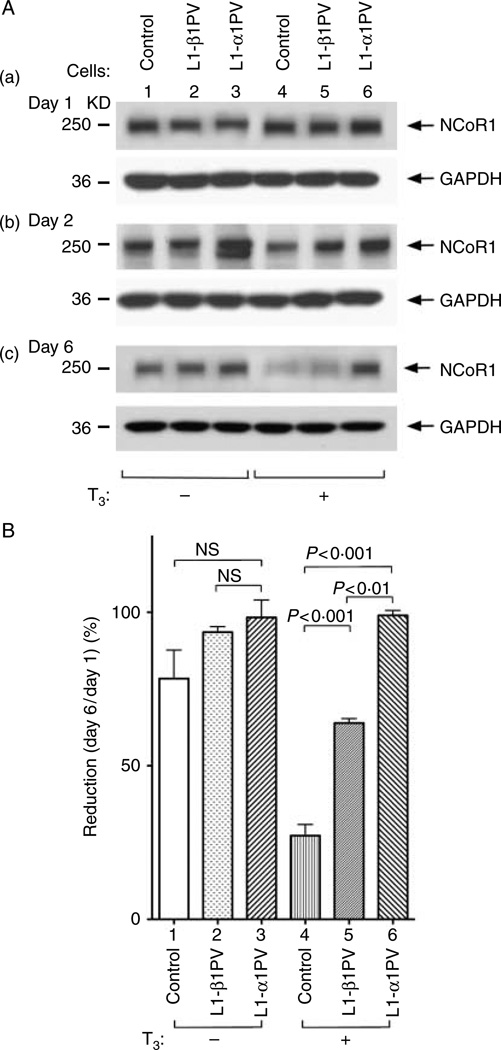
To explore the possibility that NCoR1 could regulate TR isoform-dependent adipogenesis, we compared the NCoR1 protein abundance during adipogenesis of 3T3-L1 cells (control cells), L1-α1PV cells, and L1-β1PV cells. Figure 1A shows that in the absence of T3, no significant difference of NCoR1 abundance was observed among the three cell lines on days 1 and 2 after induction of adipogenesis. On day 6, except for a very small reduction of NCoR1 protein abundance in control cells compared with that on day 1 (lane 1, Fig. 1A), no apparent changes in NCoR1 protein abundance were noted in either L1-β1PV or L1-α1PV cells, compared with the data from day 1 (lanes 2 and 3, Fig. 1A). In the presence of T3, different expression patterns of NCoR1 emerged. Although a similar abundance of NCoR1 was detected in all three cell lines on day 1 after induction (lanes 4–6 on day 1, Fig. 1A-a, upper panel), the level of NCoR1 in control cells was decreased on day 2 (lane 4, upper panel, Fig. 1A-b). A marked reduction was evident on day 6 after induction of differentiation when control 3T3-L1 cells became matured adipocytes (Fig. 1A, compare A-a with A-c in lane 4). However, as shown in Fig. 1A-c (lanes 4–6, upper panel), in cells stably expressing mutant receptors TRβ1PV or TRα1PV, downregulation of NCoR1 was repressed. Importantly, the repression was TR mutant isoform dependent. We detected a stronger inhibition of NCoR1 downregulation in L1-α1PV cells than in L1-β1PV cells (lanes 5–6, Fig. 1A-c and bars 5–6, Fig. 1B). As a result, on day 6 after induction of adipogenesis, NCoR1 protein abundance was in the rank order of control <L1-β1PV cells <L1-α1PV cells (lanes 4–6, upper panel, Fig. 1A-c). The band intensities of NCoR1 proteins were quantified to show that in the absence of T3, no statistically significant differences were detected (bars 1–3, Fig. 1B), whereas in the presence of T3, there were 76, 36, and 3% reductions of NCoR1 protein abundance on day 6 compared with that on day 1 for control, L1-β1PV cells, and L1-α1PV cells respectively (bars 4–6, Fig. 1B). Therefore, the level of NCoR1 was inversely correlated to the degree of adipogenesis in control cells, L1-β1PV cells, and L1-α1PV cells on day 6 when the cells were differentiated into mature adipocytes as shown in our previous studies (Mishra et al. 2010). Our data indicated that NCoR1 was not only important for adipogenesis in control 3T3-L1 cells but also critical for TR isoform-dependent adipogenesis in L1-β1PV cells and L1-α1PV cells.
Figure 1.
Abundance of NCoR1 protein in control cells, L1-β1PV cells, and L1-α1PV cells on day 1 (A-a), day 2 (A-b), and day 6 (A-c) after differentiation induction in the absence of T3 or in the presence of T3 (2 nM). (A) Representative results of western blot analysis. Cellular extracts were prepared from adipocytes, and western blot analysis was carried out using anti-NCoR1 #1975/1976 antibody as described in ‘Materials and methods’. The experiments were performed with five replicates in each cell line. GAPDH was used as a loading control. (B) Quantitative analysis for the relative abundance of NCoR1 protein on day 6 (A-c) compared with that on day 1 (A-a) in the absence of T3 (bars 1–3) or in the presence of T3 (bars 4–6). NCoR1 protein level was normalized against the GAPDH protein level. The P values are indicated. NS, not significant.
Decreased abundance of NCoR1 is obligatory for the T3-stimulated adipogenesis of 3T3-L1 cells
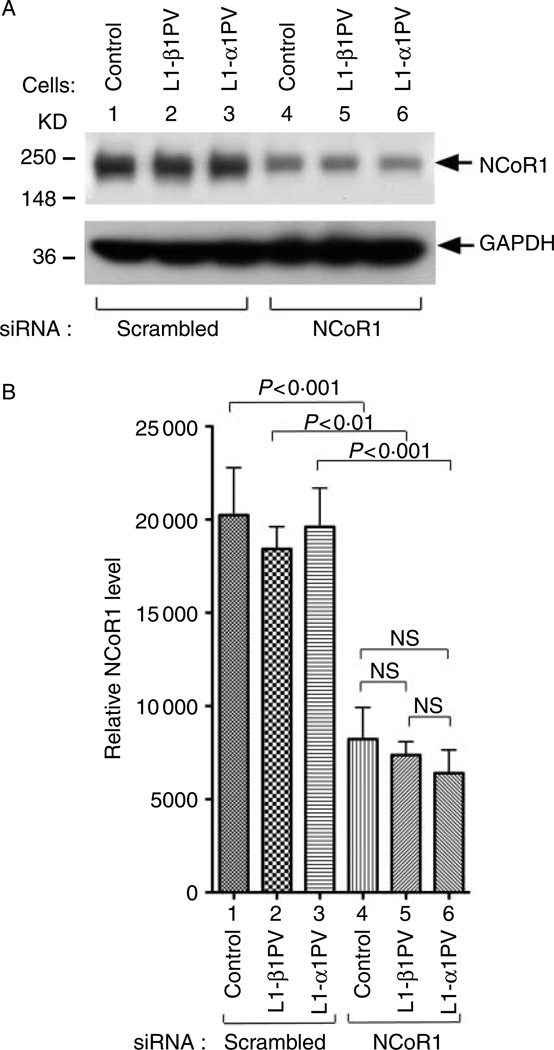
To confirm that a decreased level of NCoR1 is critical in the TR isoform-mediated differentiation of preadipocytes to adipocytes, we used lentiviral-mediated siRNA transduction to knock down the expression of NCoR1 in 3T3-L1 cells. As shown in Fig. 2, compared with the cells treated with scrambled siRNA (lanes 1–3), NCoR1 protein abundance was markedly lower in cells treated with siRNA specific against NCoR1 (lanes 4–6) compared with those treated with scramble siRNA (lanes 1–3) in control cells, L1-β1PV cells, and L1-α1PV cells respectively (compare lanes 4 with 1, 5 with 2 and 6 with 3; Fig. 2A). The band intensities of NCoR1 protein were quantified and the data are shown in Fig. 2B to indicate that the siRNA treatment significantly decreased 41, 40, and 33% of NCoR1 protein abundance in control cells, L1-β1PV cells, and L1-α1PV cells, as compared with cells treated with scrambled siRNA respectively (compare bars 4 with 1, 5 with 2, and 6 with 3; Fig. 2B).
Figure 2.
Abundance of NCoR1 protein in control cells, L1-β1PV cells, and L1-α1PV cells after transduction with scrambled-siRNA or NCoR1-siRNA lentiviruses. (A) Representative results of western blot analysis. Cellular extracts were prepared and western blot analysis was carried out using anti-NCoR1 #1975/1976 antibody (upper panel) and anti-GAPDH antibody (lower panel) as loading control. The experiments were performed with three replicates for each cell line. (B) Quantitative analysis for the relative abundance of NCoR1 protein. NCoR1 protein levels were normalized against the GAPDH protein level. The P values are indicated. NS, not significant.
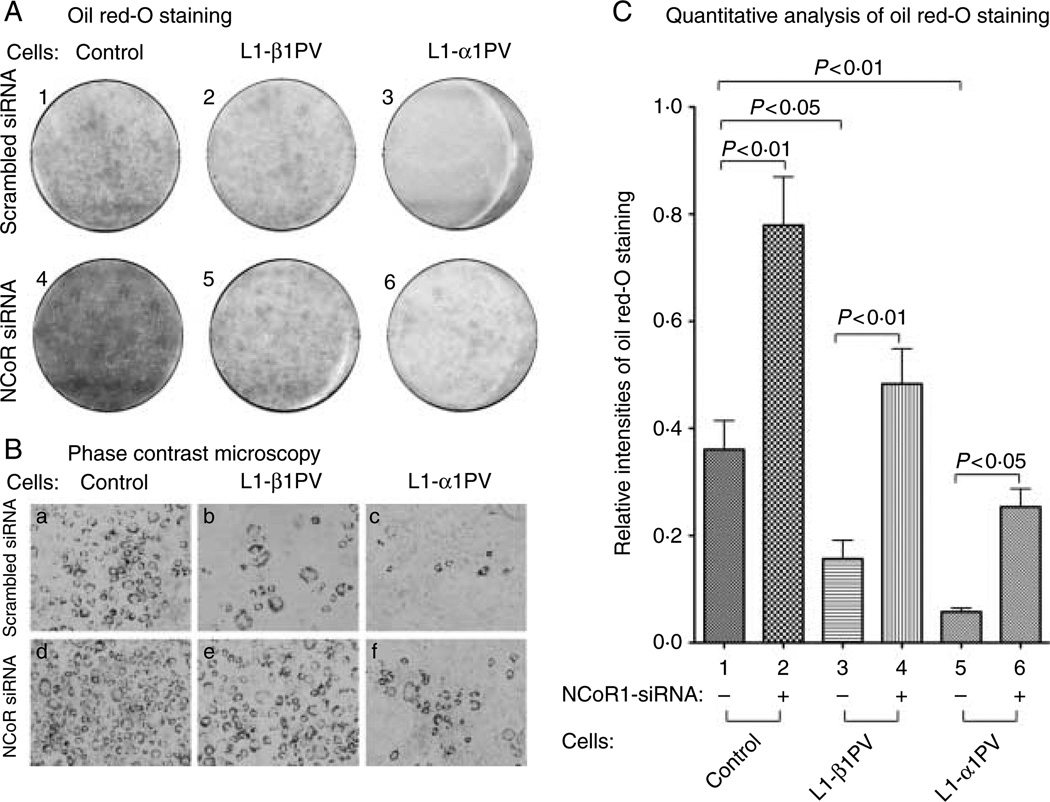
To evaluate the effect of NCoR1 knockdown on T3-stimulated adipogenesis, we induced adipogenesis in three cell lines in the presence of T3. Induced adipogenesis in control cells was indicated by an accumulation of lipid droplets stained with Oil Red-O (plate 1, Fig. 3A). T3-stimulated adipogenesis was reduced in L1-β1PV cells (compare plate 2 with plate 1, Fig. 3A), and a further decrease in adipogenesis was observed in L1-α1PV cells (compare plate 3 with plate 1, Fig. 3A). TRα1PV was more potent than TRβ1PV to block the T3-stimulated adipogenesis (compare plate 3 with plate 2, Fig. 3A). The inhibition of T3-induced adipogenesis by TRβ1PV or TRα1PV was also visualized by phase contrast microscopy (compare panel b with panel a for L1-β1PV cells; panel c with panel a for L1-α1PV cells, Fig. 3B). The results are consistent with what we observed in our previous studies (Mishra et al. 2010). However, in cells where NCoR1 was knocked down by siRNA treatment, a prominent increase in the T3-stimulated adipogenesis was clearly visible, as indicated by increased accumulation of Oil Red-O stained lipid droplets not only in control cells (compare plate 4 with plate 1; Fig. 3A) but also, remarkably, in L1-β1PV cells (compare plate 5 with plate 2; Fig. 3A) and L1-α1PV cells (compare plate 6 with plate 3; Fig. 3A). The increased adipogenesis in the cells where NCoR1 was knocked down was also apparent as visualized by phase contrast microscopy (Fig. 3B; compare panels d with a, e with b, and f with c, for control cells, L1-β1PVcells, and L1-α1PV cells respectively). Quantification of the staining intensities indicated that 2·2-, 3·1-, and 4·4-fold increases in adipogenesis were observed for control, L1-β1PV cells, and L1-α1PV cells respectively, after NCoR1 was knocked down (Fig. 3C). All together, these findings further support the notion that a decreased abundance of NCoR1 proteins is obligatory for T3-stimulated adipogenesis of 3T3-L1 cells. Importantly, NCoR1 protein is differentially correlated with TR isoform-dependent adipogenesis.
Figure 3.
Knocking down of NCoR1 expression by NCoR1-specific siRNA promotes adipogenesis in control cells, L1-β1PV cells, and L1-α1PV cells. Cells treated with scrambled siRNA (plates 1–3 of A and panels a–c of B) or NCoR1-specific siRNA (plates 4–6 of A and panels d–f of B) were induced to differentiate into mature adipocytes in the presence of T3 (2 nM). The experiments were performed with three replicates for each cell line. Mature adipocytes with lipid droplets were visualized by staining with Oil Red-O (A) and by phase contrast microscopy (B). (C) Quantitative analysis for the relative intensities of Oil Red-O staining in control cells (bars 1–2), L1-β1PV cells (bars 3–4), and L1-α1PV cells (bars 5–6). The P values are indicated.
Regulation of NCoR1 mRNA expression during T3-stimulated TR-mediated adipogenesis
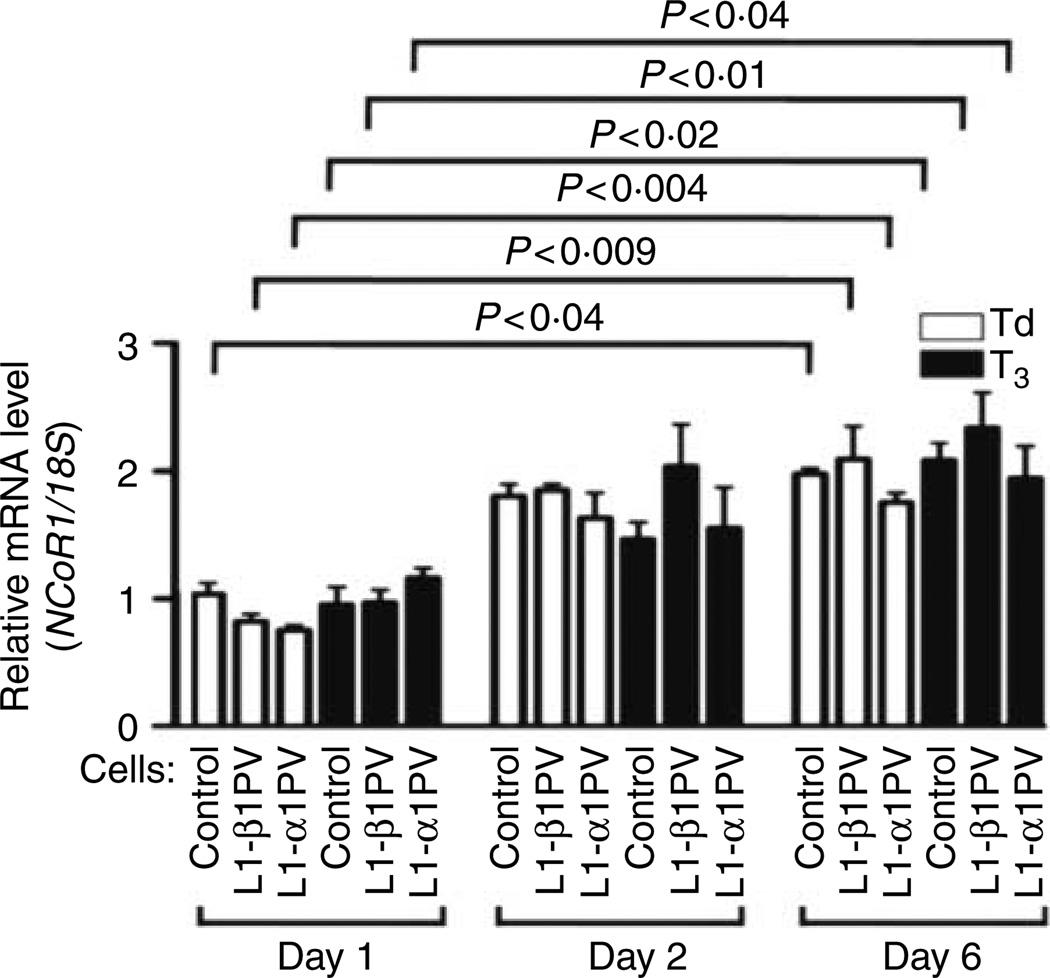
To examine whether the downregulation of NCoR1 during adipogenesis resulted from the reduced expression of NCoR1 mRNA, the level of NCoR1 mRNA was determined on days 1, 2, and 6 after induction of differentiation in the absence or presence of T3 (Fig. 4). The mRNA expression of NCoR1 was increased during adipogenesis from days 1 to 6 (approximately twofold increase). However, no apparent T3 effect on mRNA expression was detected on days 1, 2, or 6, and no differences in the mRNA levels were apparent among the three cell lines during adipogenesis. These results showed that the decreased NCoR1 protein abundance observed during adipogenesis (see Fig. 1) was not due to the repression of NCoR1 expression at the transcriptional level.
Figure 4.
Expression of NCoR1 mRNA in control cells, L1-β1PV cells, and L1-α1PV cells on days 1, 2, and 6 after induction of adipogenesis. Total RNAs were prepared from control, L1-β1PV, and L1-α1PV cells in the absence of T3 or in the presence of T3 (2 nM) after induction of adipogenesis. An aliquot of RNAs (200 ng) was used in quantitative real-time PCR reaction with mouse-specific NCoR1 primers or 18S primers (control primer). Relative NCoR1 mRNA expression was normalized against 18S rRNA level. The experiments were performed with three replicates for each cell line. The P values are indicated.
Interaction of TR and NCoR1 in 3T3-L1 cells
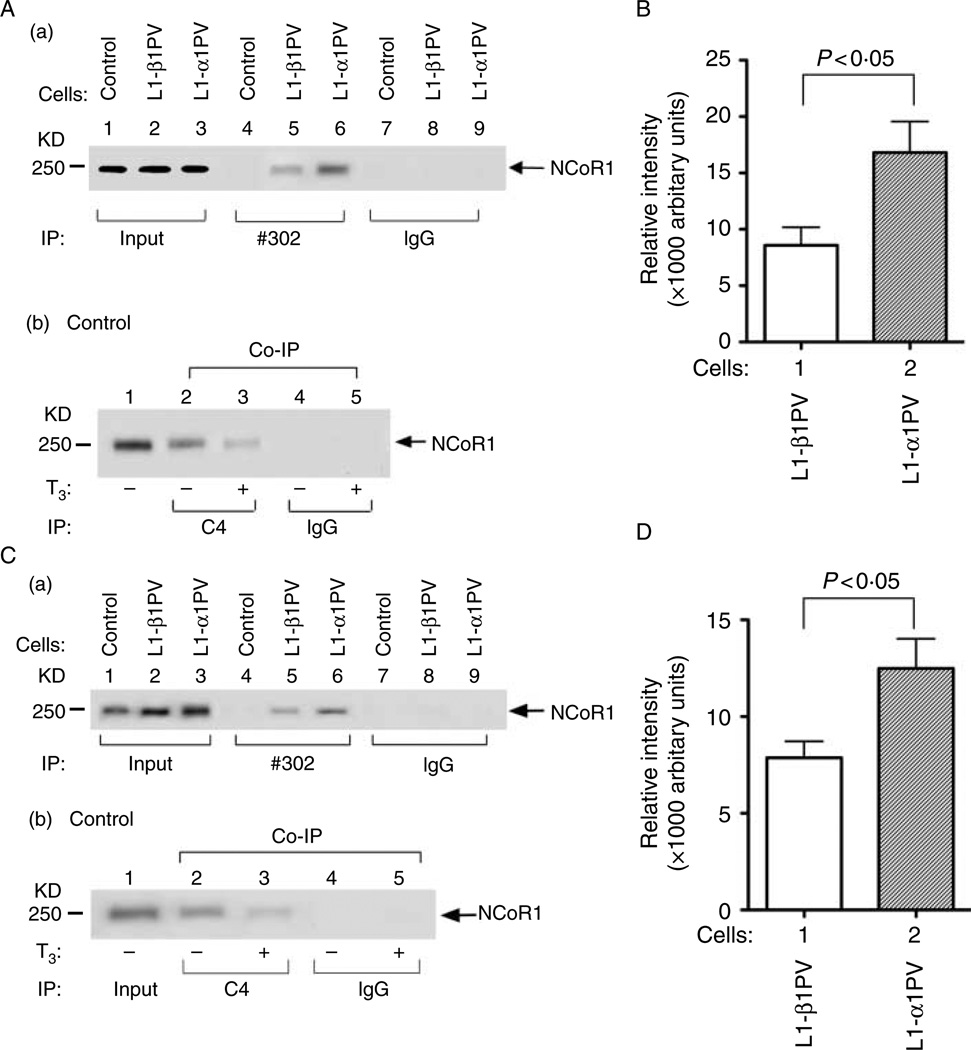
Given that NCoR1 mRNA was not decreased in 3T3-L1 cells during adipogenesis, we explored the possibility that the decreased NCoR1 protein levels could be from increased degradation of NCoR1 proteins. Since NCoR1 has been shown to physically interact with TR or TRβ1PV (Furuya et al. 2007), we hypothesized that the differential recruitment of NCoR1 by TRs might be due to the differential degradation of NCoR1 in control cells, L1-β1PV cells, and L1-α1PV cells. Therefore, we ascertained whether the recruitment of NCoR1 by TR mutants was isoform-dependent by using anti-PV-specific monoclonal antibody #302 in matured adipocytes on day 6 after induction of differentiation. This PV-specific antibody recognizes the common mutated sequence in the C-terminal region of TRβ1PV and TRα1PV. An interaction of NCoR1 with TRβ1PV (lane 5) or TRα1PV (lane 6) was clearly detected (Fig. 5A-a). Lanes 7–9 of Fig. 5A-a show the negative controls using IgG in the Co-IP. Quantitative analysis indicated that 2·0-fold more NCoR1 in L1-α1PV cells was recruited to TRα1PV than that recruited to TRβ1PV in L1-β1PV cells (Fig. 5B). As a positive control, we used a specific monoclonal antibody against the C-terminal sequence of wild-type TR in the Co-IP. A clear signal of NCoR1 was detected in the absence of T3 (lane 2, Fig. 5A-b) but much less in the presence of T3 (lane 3), indicating that NCoR1 was recruited to the wild-type TR to form TR/NCoR1 complexes. Again, such interaction was specific as no signals were detected when irrelevant IgG was used in the immunoprecipitation (lanes 4–5, Fig. 5A-b).
Figure 5.
Interaction of TRs and NCoR1 in control cells, L1-β1PV cells, and L1-α1PV cells on day 6 after induction of adipogenesis (A and B) or before induction of adipogenesis (C and D). The experiments were performed with three replicates for each cell line. (A) Co-immunoprecipitation (Co-IP) of TRα1PV, TRβ1PV, and wild-type TRβ1 with NCoR1 on day 6 after induction of adipogenesis was performed with antibody against mutant PV at the carboxyl terminus (#302) (lanes 4–6, panel A-a), antibody against wild-type TR (C4) (lanes 2–3, panel A-b), or IgG (lanes 7–9, panel A-a and lanes 4–5 of panel A-b). Western blot analysiswascarried out using anti-NCoR1 #1975/1976 antibody. For input controls, 20% of cell lysate were used. (B) Quantitative analysis for the relative abundance of NCoR1 protein in L1-β1PV cells and L1-α1PV cells after Co-IP with TRβ1PV and TRα1PV as shown in panel A-a (lanes 5–6). (C) Co-IP of TRα1PV, TRβ1PV, and wild-typeTRβ1 with NCoR1 before induction of adipogenesis was performed with antibody against mutant PV at the carboxyl terminus (#302) (lanes 4–6, panel C-a), antibody against wild-type TR (C4) (lanes 2–3, panel C-b), or IgG (lanes 7–9 of panel C-a and lanes 4–5 of panel C-b). Western blot analysis was carried out using anti-NCoR1 #1975/1976 antibody. For input control, 5% of cell lysates were used. (D) Quantitative analysis for the relative abundance of NCoR1 protein in L1-β1PV cells and L1-α1PV cells after Co-IP with TRβ1PV and TRα1PV as shown in panel C-a (lanes 5–6).
As shown in Fig. 1, the level of NCoR1 was down-regulated on day 6 after induction of adipogenesis. To exclude the possibility that the greater recruitment of NCoR1 to TRα1PV in L1-α1PV cells than to TRβ1PV in L1-β1PV cells is due to different levels of NCoR1 in matured adipocytes on day 6, we also examined the recruitment of NCoR1 in undifferentiated cells (preadipocytes) that have a similar abundance of NCoR1 (Fig. 5C). An interaction of NCoR1 with TRβ1PV (lane 5) or TRα1PV (lane 6) was clearly detected (Fig. 5C-a). It is important to note that more NCoR1 was associated with TRα1PV than with TRβ1PV (compare lane 6 with lane 5, Fig. 5C-a). Quantitative analysis indicated that 1·6-fold more NCoR1 was recruited to TRα1PV in L1-α1PV cells than to TRβ1PV in L1-β1PV cells (Fig. 5D). As expected, no signals were detected in the control cells as these cells express endogenous wild-type TR that was not recognized by the anti-PV antibody (lane 4, Fig. 5C-a). For positive controls, a specific monoclonal antibody against the C-terminal sequence of wild-type TR was used in the immunoprecipitation, a clear signal was detected (lane 2, Fig. 5C-b), indicating that in the absence of T3, NCoR1 was recruited to the wild-type TR to form TR/NCoR1 complexes. Again, such interaction was specific as no signals were detected when irrelevant IgG was used in the immunoprecipitation (lanes 7–9, Fig. 5C-a and lanes 4–5, Fig. 5C-b). These data indicated that NCoR1 was differentially recruited to TRα1PV and TRβ1PV in both undifferentiated and differentiated cells, indicating differential interaction of NCoR1 with TR isoforms.
Regulation of mSiah2 expression during T3-stimulated TR-mediated adipogenesis
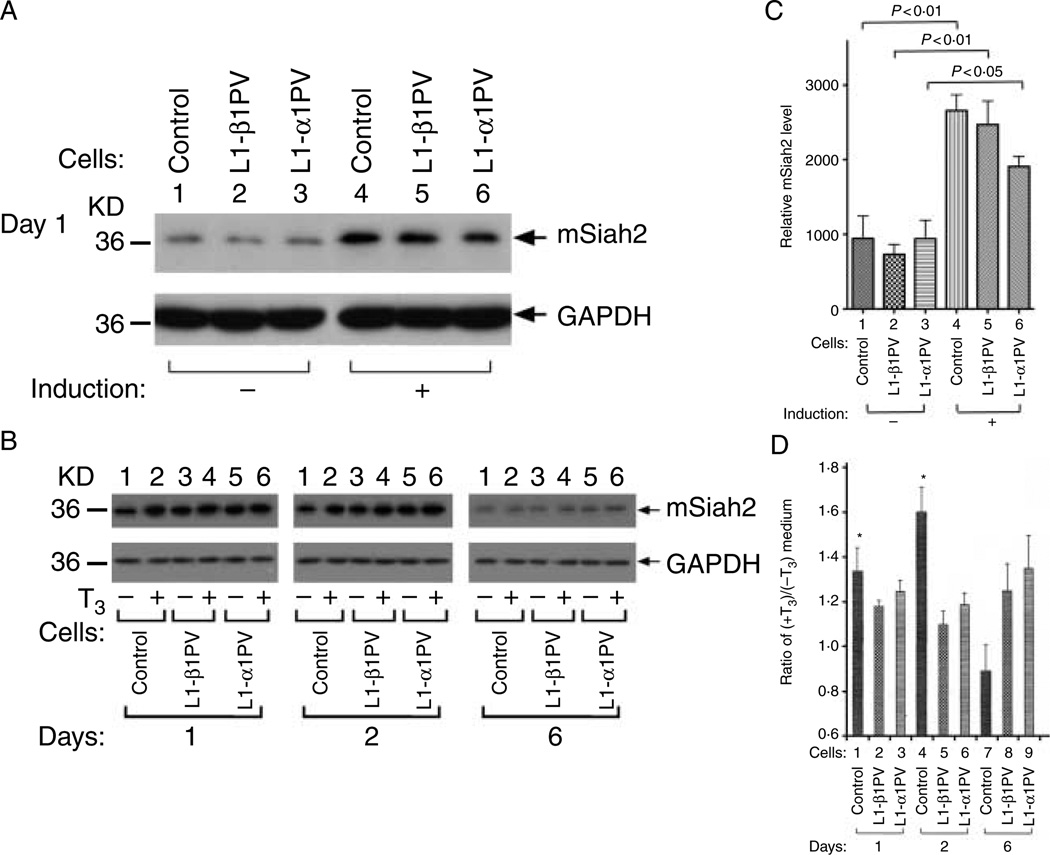
To understand how NCoR1 protein was decreased during T3-stimulated adipogenesis of 3T3-L1 cells, we turned our attention to mSiah2, a mammalian homolog of Drosophila Seven in absentia. mSiah2, by interacting with NCoR1, targets NCoR1 for proteasomal degradation (Zhang et al. 1998). By targeting NCoR1 for proteolytic degradation, mSiah2 blocks the functional repression of several nuclear receptors, including TR, caused by NCoR1 (Zhang et al. 1998). Furthermore, ectopically over-expressed mSiah2 can almost completely abolish the repression activity of NCoR1. These observations prompted us to first examine the expression of mSiah2 at the protein level in control, L1-β1PV, and L1-α1PV cells because its expression is cell-type specific (Zhang et al. 1998). The western blot analysis shows that in the absence of T3, the abundance of mSiah2 protein was increased after induction of adipogenesis on day 1 in three cell lines (compare lanes 4–6 with lanes 1–3, upper panel, Fig. 6A and compare bars 4–6 with bars 1–3, Fig. 6C). These data show that mSiah2 was expressed in 3T3-L1 cells and that its expression was rapidly increased upon induction of adipogenesis. This correlative sharply increased expression of mSiah2 on day 1 upon induction of adipogenesis raised the possibility that mSiah2 could mediate the proteolytic degradation of NCoR1 protein. We therefore next compared the level of mSiah2 on days 1, 2, and 6 during adipogenesis in the absence (lanes 1, 3 and 5, upper panel, Fig. 6B) or presence of T3 (lanes 2, 4 and 6, upper panel, Fig. 6B) to examine how T3 increased the degradation of NCoR1 during adipogenesis. As shown in Fig. 6B, in the absence of T3, the level of mSiah2 was higher on days 1 and 2 before matured adipocytes could be observed during induction. On day 6 when the adipogenesis peaked, the level of mSiah2 had markedly dropped (upper panel, Fig. 6B), indicating that the expression of mSiah2 was activated upon induction of adipogenesis and repressed when adipocytes were fully matured. We further ascertained whether T3 had an additional effect on the expression of mSiah2 during adipogenesis. As shown in Fig. 6B, in control cells, the protein level of mSiah2 was increased by T3 on days 1 and 2, but this T3-induced increase was lost on day 6 in matured adipocytes (see also bar 7, Fig. 6D). Interestingly, no apparent effect of T3 on the mSiah2 protein level was detected in L1-β1PV and L1-α1PV cells during adipogenesis (Fig. 6D, compare bars 2, 5, and 8 for L1-β1PV cells and bars 3, 6, and 9 for L1-α1PV cells). The findings that the mSiah2 protein levels were sharply increased upon commencing of adipogenesis, but dropped when adipogenesis was completed, support the notion that mSiah2 could, at least in part, mediate the degradation of NCoR1 during adipogenesis. However, the elevated protein abundance of mSiah2 alone could not fully account for the differential degradation of NCoR1 between L1-β1PV cells and L1-α1PV cells during adipogenesis.
Figure 6.
Abundance of mSiah2 protein during adipogenesis. (A) Abundance of mSiah2 protein in control cells, L1-β1PV cells, and L1-α1PV cells without induction or on day 1 after induction of adipogenesis. Cellular extracts were prepared from adipocytes and western blot analysis was carried out using anti-mSiah2 antibody. GAPDH was used as loading controls. The experiments were performed with four replicates in each cell line. (B) Abundance of mSiah2 protein in control cells, L1-β1PV cells, and L1-α1PV cells on days 1, 2, and 6 after induction of adipogenesis in the absence of T3 (lanes 1, 3 and 5) or in the presence of T3 (lanes 2, 4 and 6). Cellular extracts were prepared from adipocytes and western blot analysis was carried out using anti-mSiah2 antibody. GAPDH was used as loading controls. The experiments were performed with three replicates for each cell line. (C) Quantitative comparison for the relative intensities of mSiah2 protein in control cells, L1-β1PV cells, and L1-α1PV cells without induction or after induction of adipogenesis as shown in panel A. (D) Quantitative comparison for the relative intensity of mSiah2 protein in control cells, L1-β1PV cells, and L1-α1PV cells in the presence of T3 versus in the absence of T3 as shown in panel B. *Indicates P<0·05.
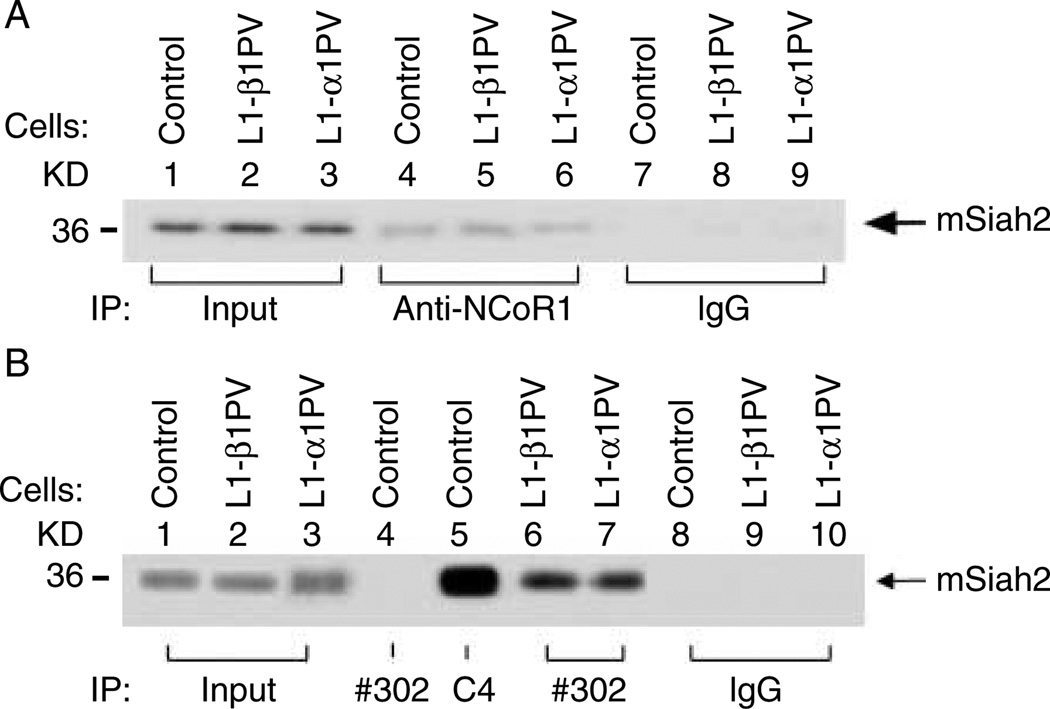
Because mSiah2 binds NCoR1 (Zhang et al. 1998), it is reasonable to propose that differential interaction of NCoR1 with TRβ1PV and TRα1PV could affect the mSiah2-mediated degradation of NCoR1, thereby leading to the different extent of loss of NCoR1 protein observed in L1-β1PV and L1-α1PV cells during adipogenesis (See Fig. 1). We therefore used Co-IP assays to test this hypothesis. We first determined whether in undifferentiated 3T3-L1 cells the expressed mSiah2 interacted with NCoR1 as shown in other mammalian cell lines such as 293T cells (Zhang et al. 1998). Indeed, we found that NCoR1 interacted with mSiah2 in control 3T3-L1 cells (lane 4, Fig. 7A), as well as in L1-β1PV cells (lane 5) and L1-α1PV cells (lane 6). No apparent difference in the extent of interaction between NCoR1 and mSiah2 was discerned among these three cell lines. But it is important to note that such interaction was specific as when a negative control, IgG, was used in the immunoprecipitation, no signals were detected (lanes 7–9, Fig. 7A).
Figure 7.
Interaction of TR/NCoR1/mSiah2 proteins. (A) Interaction of mSiah2 with NCoR1 in control cells, L1-β1PV cells, and L1-α1PV cells before induction of adipogenesis. For input controls, 5% of cell lysate were used. Co-IP of mSiah2 with NCoR1 was performed with anti-NCoR1 #1975/1976 antibody (lanes 4–6) or IgG (control) (lanes 7–9). The immunoprecipitated proteins were analyzed by western blot analysis with antibody against mSiah2. (B). After Co-IP with antibody C4 (lane 5), #302 (lanes 4 and 6–7), or IgG (lanes 8–10), the immunoprecipitated proteins were analyzed by western blot analysis using antibody against mSiah2.
To confirm that mSiah2 was associated with TR/PV-NCoR1 complexes, we used Co-IP to detect mSiah2 protein. Indeed, we found that mSiah2 was detected in the immunoprecipitated proteins with antibody against wild-type TR (lane 5, Fig. 7B) and antibody against mutant PV in both L1-β1PV cells (lane 6, Fig. 7B) and L1-α1PV cells (lane 7, Fig. 7B). These results indicate that mSiah2-NCoR1 can complex with TR, TRβ1PV, or TRα1PV. For wild-type TR, in the absence of T3, NCoR1 favors the binding to TR, therefore reducing the degradation of NCoR1. In the presence of T3, NCoR1 was released from wild-type TR, facilitating the degradation of NCoR1 (see Fig. 1A-c). As the mutant cannot bind to T3, the interaction of NCoR1 with either TRβ1PV or TRα1PV was less likely disturbed. Thus, the association of mutated TR (i.e. TRβ1PV or TRα1PV) with NCoR1 prevents the mSiah2 from targeting NCoR1 for the proteasomal degradation. As more TRα1PV than TRβ1PV was recruited to the NCoR1 complex (Fig. 5A-a and C-a), NCoR1 is presumably more stabilized by association with TRα1PV. The present data so far have indicated that the loss of NCoR1 favors T3-stimulated adipogenesis, and these findings could explain the observation of a stronger inhibition of adipogenesis by TRα1PV than by TRβ1PV (see Fig. 3 and Mishra et al. (2010)).
More NCoR1 in L1-α1PV cells than in L1-β1PV cells is recruited to the promoter of the C/ebpα gene
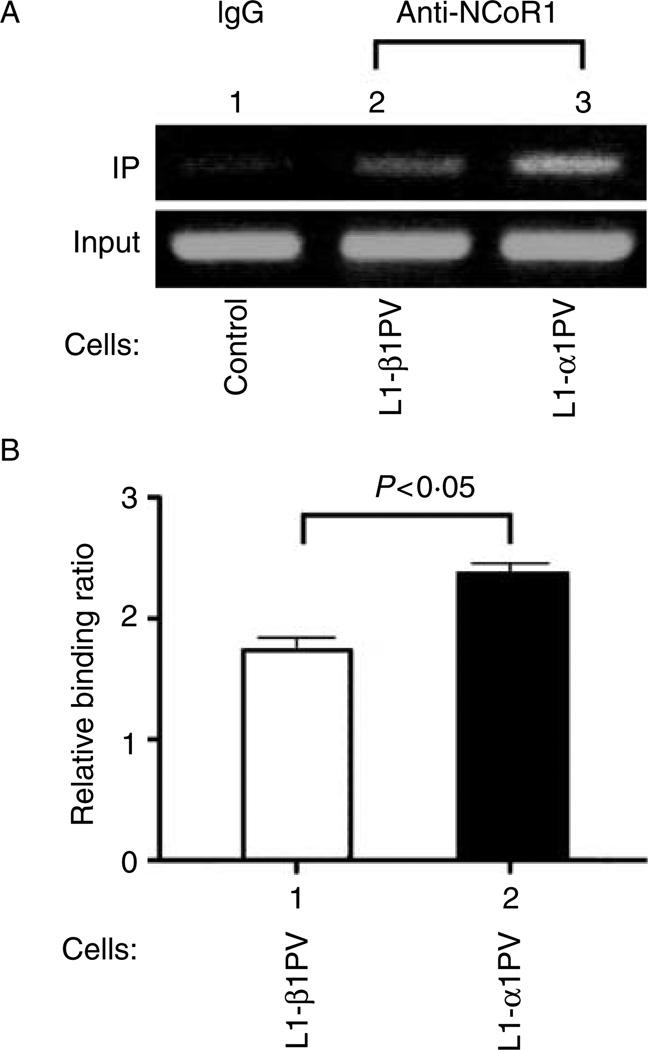
One of the direct T3 target genes during adipogenesis of 3T3-L1 cells is the C/ebpα gene (C/ebpα), which has several TREs in its promoter to interact with TR-coregulator complexes (Menendez-Hurtado et al. 2000). C/EBPα is one of master regulators in adipogenesis. Previously, we showed that this critical adipogenic gene is more repressed by TRα1PV than by TRβ1PV during adipogenesis of 3T3-L1 cells (Mishra et al. 2010). It is known that association of NCoR1 with unliganded TR leads to repression of genes positively regulated by T3 (Horlein et al. 1995, Perissi et al. 2010). As TRα1PV and TRβ1PV have lost T3-binding activity, a stronger association of NCoR1 with TRα1PV is expected to lead to a more potent inhibition of T3 positively regulated genes than TRβ1PV does. To assess whether the preferential association of TRα1PV (versus TRβ1PV) with NCoR1 results in stronger recruitment of NCoR1 to T3 target genes, we performed ChIP assays to examine the recruitment of NCoR1 to the promoter of the C/ebpα gene using antibody directly against NCoR1 protein. Indeed, as shown in Fig. 8A, more NCoR1 in L1-α1PV cells than in L1-β1PV cells was recruited to the promoter of C/ebpα in adipocytes (compare lane 3 with lane 2, Fig. 8A). There was more binding of NCoR1 to the C/ebpα promoter in L1-α1PV cells than to that in L1-β1PV cells (Fig. 8B). Collectively, these data indicate that a stronger interaction of NCoR1 with TRα1PV than with TRβ1PV results in more stabilized NCoR1–TRα1PV complexes in the promoter and less degradation of NCoR1, thus leading to a stronger repression of critical adipogenic genes such as C/ebpα and thereby more impaired adipogenesis in L1-α1PV cells than in L1-TRβ1PV cells.
Figure 8.
Preferential recruitment of NCoR1 by TRα1PV versus TRβ1PV to the promoter of the C/ebpα gene. (A) Chromosomal DNA was prepared from control, L1-β1PV, and L1-α1PV cells on day 6 after induction of adipogenesis and ChIP was carried out as described in ‘Materials and methods’. The chromosomal DNA was incubated with IgG (control) and anti-NCoR1 (PHQQ) antibody. The purified DNA from immunoprecipitated chromatin was used as a template for PCR amplification of the receptor-binding region in the promoter of C/ebpα gene (A, upper panel). For the input DNA, 1% of the chromatin solution (10 µl) was used as a control (A, lower panel). The experiments were performed with three replicates for each cell line. (B) DNA gel images were scanned and subjected to band densitometry analysis with imageJ software. Data are expressed as means±s.d.
Discussion
T3 plays a critical role in the regulation of thermogenesis and maintenance of lipid homeostasis. Two TR isoforms mediate different aspects of T3 actions in lipid metabolism as recently shown by using loss-of-function approach in vivo (Zhu & Cheng 2010). Two knockin mutant mice harboring identical PV mutations in the Thra gene (Thra1PV mouse) (Kaneshige et al. 2001) or the Thrb gene (ThrbPV mouse) (Kaneshige et al. 2000) display distinct phenotypes in the liver and WAT. WAT mass is reduced in Thra1PV mice, but not in ThrbPV mice (Ying et al. 2007). The liver of ThrbPV mice is enlarged with excess accumulation of lipids, but the liver of Thra1PV mice is decreased in size with scarcity in lipids. These observations indicate that TRα1 and TRβ1 differentially regulate lipid metabolism in vivo (Ying et al. 2007, Araki et al. 2009). We found that in 3T3-L1 cells stably expressing equal amounts of TRα1PV cells or TRβ1PV, the T3-stimulated adipogenesis is more severely impaired in L1-α1PV cells than in L1-β1PV (Mishra et al. 2010). The availability of these model cell lines provides a powerful tool to explore and understand how TR isoforms differentially regulate adipogenesis. We discovered that the loss of NCoR1 is accompanied by T3-stimulated adipogenesis of 3T3-L1 cells. L1-α1PV cells, which had less loss of NCoR1 than did L1-β1PV cells, displayed a more severe impairment in adipogenesis. Thus, this study identified a new regulatory mechanism that underscores the differential regulation of adipogenesis by TR isoforms.
To understand the molecular basis underlying the finding that NCoR1 is more stabilized in L1-α1PV cells than in L1-β1PV cells, we studied the role of a known ubiquitin ligase of NCoR1, mSiah2, in adipogenesis of 3T3-L1 cells (Zhang et al. 1998). We found that the expression of mSiah2 protein level was rapidly increased at the time when adipogenesis was initiated by induction. mSiah2 formed complexes with NCoR1 similarly in 3T3-L1 cells, L1-α1PV cells, and L1-β1PV cells. However, TRα1PV associated with NCoR1 complexes stronger than TRβ1PV did. It is known that ectopic expression of mSiah2 can almost completely abolish the repression activity of NCoR1 (Zhang et al. 1998). These results prompted us to propose that liganded TR facilitates NCoR1 to be targeted by mSiah2 for degradation during T3-stimulated adipogenesis (see Fig. 1). In the presence of T3, the wild-type TR is released from the NCoR1–TR complex in the promoter of T3 target genes, resulting in mSiah2-mediated degradation. In contrast, TRα1PV and TRβ1PV do not bind T3, thereby hindering the mSiah2-targeted degradation of NCoR1. However, TRα1PV was shown to associate with NCoR1 complexes stronger than TRβ1PV did. This stronger association resulted in a more potent inhibition of the mSiah2-targeted degradation of NCoR1 than occurred with TRβ1PV. At present, the structural basis of the differential interaction of these two TR mutant isoforms with NCoR1 is not clear. These two mutant isoforms have identical C-terminal mutations, but differ in the amino terminal A/B domain. Thus, it is reasonable to speculate that the amino terminal A/B domain of TRα1PV could affect the folding of the tertiary structure such that TRα1PV could interact stronger than TRβ1PV with the C-terminal receptor interacting domain of NCoR1. Consistently, we also found that more NCoR1 in L1-α1PV cells was recruited to the TRα1PV–TRE complexes on the promoter of the C/ebpα gene (Fig. 8). The more favorable recruitment of NCoR1–TRα1PV to TREs on the promoter of the C/ebpα gene leads to a stronger repression of the C/ebpα gene and more severe impairment of adipogenesis of 3T3-L1 cells than occurs with TRβ1PV (see Fig. 3).
In addition to the PV mutation, two other TRβ mutations first isolated from human RTH syndrome patients have been re-engineered as TRα1 mutation constructs and introduced into mice. Unlike the lean mouse phenotype described here for the TRα1-PV mutation, a TRα1-P398H mutation produced visceral adiposity, hyperleptinemia, reduced sensitivity to catecholamine-stimulated lipolysis, and hepatic steatosis (Liu et al. 2003). These divergent metabolic outcomes may be mediated by divergent mechanisms. The elevated ability of the TRα1-PV mutant to bind NCoR1, as reported here, probably reflects the loss of the normal helices 11 and 12 sequences from this frame-shift mutant (Rosen & Privalsky 2009). The P398H-TRα1 mutant, in contrast, retains a wild-type helices 11 and 12 sequence and is therefore unlikely to bind or stabilize NCoR1 in the elevated manner seen for the TRα1-PV mutant. Conversely, the hepatic steatosis phenotype described for the TRα1-P398H mutant was shown to reflect, in part, the ability of this mutant to suppress fatty acid oxidation by inhibiting PPARα target gene expression. A third dominant-negative mutant of RTH origin, when expressed as TRα1-R384C in mice, displays a reduced adiposity phenotype that is reversed at 30 °C (Sjogren et al. 2007). The TRα-R384C mutant is only a weak inhibitor of PPARα and would not be anticipated to display enhanced NCoR recruitment or protection. It is possible that the TRα1-R384C functions through a yet-to-be discovered mechanism that is presumably also under autonomic influence. Taken as a whole, these experiments indicate that despite their shared ability to mediate RTH syndrome as TRβ isoforms, these three mutations possess an underlying heterogeneity in their actions that is unmasked when re-evaluated in the TRα1 context.
Obesity and disorders of lipid metabolism are major health issues. The identification of NCoR1 as a critical regulator of T3-stimulated adipogenesis has important implications in disorders of lipid metabolism. In hypothyroidism, TRα1 and TRβ1 are unliganded; thus, as shown for TRα1PV and TRβ1PV in this study, the unliganded TRα1 could be more strongly associated with NCoR1 than could the unliganded TRβ1. The aberrant expression of NCoR1 in target tissues involved in lipid metabolism, particularly in tissue where TRα1 is predominantly expressed, could lead to severe lipid-related disorders (e.g. WAT (Ying et al. 2007)). On the other hand, in view of the importance of NCoR1 in T3-stimulated TR-isoform-mediated adipogenesis, NCoR1 could be considered as a potential therapeutic target in the abnormalities of lipid metabolism.
Acknowledgments
Funding
This research was supported by the Intramural Research Program of Center for Cancer Research, National Cancer Institute, National Institutes of Health.
Footnotes
Declaration of interest
The authors declare that there is no conflict of interest that could be perceived as prejudicing the impartiality of the research reported.
References
- Araki O, Ying H, Zhu XG, Willingham MC, Cheng SY. Distinct dysregulation of lipid metabolism by unliganded thyroid hormone receptor isoforms. Molecular Endocrinology. 2009;23:308–315. doi: 10.1210/me.2008-0311. [DOI] [PMC free article] [PubMed] [Google Scholar]
- Astapova I, Dordek MF, Hollenberg AN. The thyroid hormone receptor recruits NCoR via widely spaced receptor-interacting domains. Molecular and Cellular Endocrinology. 2009;307:83–88. doi: 10.1016/j.mce.2009.02.028. [DOI] [PMC free article] [PubMed] [Google Scholar]
- Bhat MK, McPhie P, Ting YT, Zhu XG, Cheng SY. Structure of the carboxy-terminal region of thyroid hormone nuclear receptors and its possible role in hormone-dependent intermolecular interactions. Biochemistry. 1995;34:10591–10599. doi: 10.1021/bi00033a034. [DOI] [PubMed] [Google Scholar]
- Cheng SY. Multiple mechanisms for regulation of the transcriptional activity of thyroid hormone receptors. Reviews in Endocrine and Metabolic Disorders. 2000;1:9–18. doi: 10.1023/a:1010052101214. [DOI] [PubMed] [Google Scholar]
- Cohen RN, Brzostek S, Kim B, Chorev M, Wondisford FE, Hollenberg AN. The specificity of interactions between nuclear hormone receptors and corepressors is mediated by distinct amino acid sequences within the interacting domains. Molecular Endocrinology. 2001;15:1049–1061. doi: 10.1210/mend.15.7.0669. [DOI] [PubMed] [Google Scholar]
- Furuya F, Guigon CJ, Zhao L, Lu C, Hanover JA, Cheng SY. Nuclear receptor corepressor is a novel regulator of phosphatidylinositol 3-kinase signaling. Molecular and Cellular Biology. 2007;27:6116–6126. doi: 10.1128/MCB.00900-07. [DOI] [PMC free article] [PubMed] [Google Scholar]
- Horlein AJ, Naar AM, Heinzel T, Torchia J, Gloss B, Kurokawa R, Ryan A, Kamei Y, Soderstrom M, Glass CK, et al. Ligand-independent repression by the thyroid hormone receptor mediated by a nuclear receptor co-repressor. Nature. 1995;377:397–404. doi: 10.1038/377397a0. [DOI] [PubMed] [Google Scholar]
- Kaneshige M, Kaneshige K, Zhu X, Dace A, Garrett L, Carter TA, Kazlauskaite R, Pankratz DG, Wynshaw-Boris A, Refetoff S, et al. Mice with a targeted mutation in the thyroid hormone beta receptor gene exhibit impaired growth and resistance to thyroid hormone. PNAS. 2000;97:13209–13214. doi: 10.1073/pnas.230285997. [DOI] [PMC free article] [PubMed] [Google Scholar]
- Kaneshige M, Suzuki H, Kaneshige K, Cheng J, Wimbrow H, Barlow C, Willingham MC, Cheng S. A targeted dominant negative mutation of the thyroid hormone alpha 1 receptor causes increased mortality, infertility, and dwarfism in mice. PNAS. 2001;98:15095–15100. doi: 10.1073/pnas.261565798. [DOI] [PMC free article] [PubMed] [Google Scholar]
- Liu YY, Schultz JJ, Brent GA. A thyroid hormone receptor alpha gene mutation (P398H) is associated with visceral adiposity and impaired catecholamine-stimulated lipolysis in mice. Journal of Biological Chemistry. 2003;278:38913–38920. doi: 10.1074/jbc.M306120200. [DOI] [PubMed] [Google Scholar]
- Meier CA, Dickstein BM, Ashizawa K, McClaskey JH, Muchmore P, Ransom SC, Menke JB, Hao EH, Usala SJ, Bercu BB, et al. Variable transcriptional activity and ligand binding of mutant beta 1 3,5,3’-triiodothyronine receptors from four families with generalized resistance to thyroid hormone. Molecular Endocrinology. 1992;6:248–258. doi: 10.1210/mend.6.2.1569968. [DOI] [PubMed] [Google Scholar]
- Menendez-Hurtado A, Santos A, Perez-Castillo A. Characterization of the promoter region of the rat CCAAT/enhancer-binding protein alpha gene and regulation by thyroid hormone in rat immortalized brown adipocytes. Endocrinology. 2000;141:4164–4170. doi: 10.1210/endo.141.11.7756. [DOI] [PubMed] [Google Scholar]
- Mishra A, Zhu XG, Ge K, Cheng SY. Adipogenesis is differentially impaired by thyroid hormone receptor mutant isoforms. Journal of Molecular Endocrinology. 2010;44:247–255. doi: 10.1677/JME-09-0137. [DOI] [PMC free article] [PubMed] [Google Scholar]
- Parrilla R, Mixson AJ, McPherson JA, McClaskey JH, Weintraub BD. Characterization of seven novel mutations of the c-erbA beta gene in unrelated kindreds with generalized thyroid hormone resistance. Evidence for two "hot spot" regions of the ligand binding domain. Journal of Clinical Investigation. 1991;88:2123–2130. doi: 10.1172/JCI115542. [DOI] [PMC free article] [PubMed] [Google Scholar]
- Perissi V, Jepsen K, Glass CK, Rosenfeld MG. Deconstructing repression: evolving models of co-repressor action. Nature Reviews. Genetics. 2010;11:109–123. doi: 10.1038/nrg2736. [DOI] [PubMed] [Google Scholar]
- Rosen MD, Privalsky ML. Thyroid hormone receptor mutations found in renal clear cell carcinomas alter corepressor release and reveal helix 12 as key determinant of corepressor specificity. Molecular Endocrinology. 2009;23:1183–1192. doi: 10.1210/me.2009-0126. [DOI] [PMC free article] [PubMed] [Google Scholar]
- Sjogren M, Alkemade A, Mittag J, Nordstrom K, Katz A, Rozell B, Westerblad H, Arner A, Vennstrom B. Hypermetabolism in mice caused by the central action of an unliganded thyroid hormone receptor alpha1. EMBO Journal. 2007;26:4535–4545. doi: 10.1038/sj.emboj.7601882. [DOI] [PMC free article] [PubMed] [Google Scholar]
- Ying H, Araki O, Furuya F, Kato Y, Cheng SY. Impaired adipogenesis caused by a mutated thyroid hormone alpha1 receptor. Molecular and Cellular Biology. 2007;27:2359–2371. doi: 10.1128/MCB.02189-06. [DOI] [PMC free article] [PubMed] [Google Scholar]
- Yoh SM, Privalsky ML. Resistance to thyroid hormone (RTH) syndrome reveals novel determinants regulating interaction of T3 receptor with corepressor. Molecular and Cellular Endocrinology. 2000;159:109–124. doi: 10.1016/s0303-7207(99)00201-4. [DOI] [PubMed] [Google Scholar]
- Yoh SM, Chatterjee VK, Privalsky ML. Thyroid hormone resistance syndrome manifests as an aberrant interaction between mutant T3 receptors and transcriptional corepressors. Molecular Endocrinology. 1997;11:470–480. doi: 10.1210/mend.11.4.9914. [DOI] [PMC free article] [PubMed] [Google Scholar]
- Yu C, Markan K, Temple KA, Deplewski D, Brady MJ, Cohen RN. The nuclear receptor corepressors NCoR and SMRT decrease peroxisome proliferator-activated receptor gamma transcriptional activity and repress 3T3-L1 adipogenesis. Journal of Biological Chemistry. 2005;280:13600–13605. doi: 10.1074/jbc.M409468200. [DOI] [PubMed] [Google Scholar]
- Zhang J, Guenther MG, Carthew RW, Lazar MA. Proteasomal regulation of nuclear receptor corepressor-mediated repression. Genes and Development. 1998;12:1775–1780. doi: 10.1101/gad.12.12.1775. [DOI] [PMC free article] [PubMed] [Google Scholar]
- Zhang XY, Kaneshige M, Kamiya Y, Kaneshige K, McPhie P, Cheng SY. Differential expression of thyroid hormone receptor isoforms dictates the dominant negative activity of mutant beta receptor. Molecular Endocrinology. 2002;16:2077–2092. doi: 10.1210/me.2002-0080. [DOI] [PubMed] [Google Scholar]
- Zhu X, Cheng SY. New insights into regulation of lipid metabolism by thyroid hormone. Current Opinion in Endocrinology, Diabetes, and Obesity. 2010;17:408–413. doi: 10.1097/MED.0b013e32833d6d46. [DOI] [PMC free article] [PubMed] [Google Scholar]


