

Abstract
In the current study, we developed a HPLC method to quantitatively measure the permeability of the BpT-based chelators, 2-benzoylpyridine 4-ethyl-3-thiosemicarbazone (Bp4eT) and 2-benzoylpyridine 4-allyl-3-thiosemicarbazone (Bp4aT), across human colorectal adenocarcinoma (Caco-2) monolayers as a model of gut absorption. In aqueous solution, Bp4eT and Bp4aT formed inter-convertible Z and E isomers that were resolved by HPLC. Peak area was linear with respect to chelator concentration. Acceptable within-day and between-day precision (<22%) and accuracy (85–115% of true values) were obtained over a range of 1.0 – 100 µM for Bp4eT and 1.5 – 300 µM for Bp4aT. Limits of detection were 0.3 µM and 1 µM for Bp4eT and Bp4aT, respectively, while corresponding limits of quantification were 1 µM and 5 µM. Both chelators showed significant ability to chelate iron in THP-1 cells using a calcein-based assay and no apparent cytotoxicity was observed within 24 h. Ratios of the apical to basolateral and basolateral to apical transport for Bp4eT were 1.10 and 0.89 at 100 µM and 300 µM respectively, indicating equal bi-directional movement of the compounds. Similarly, ratios were 0.77 and 0.92 for Bp4aT, respectively. This study demonstrates that Bp4eT and Bp4aT can be efficiently transported through Caco-2 cells and can potentially be formulated for oral delivery.
1. Introduction
Thiosemicarbazone compounds are chelators that bind a variety of transition metals, including iron (Fe), copper (Cu), and zinc (Zn) [1, 2]. The di-2-pyridylketone thiosemicarbazone (DpT) group of thiosemicarbazones (Fig. 1) possesses potent and selective anti-tumor activity [3]. Recently, the 2-benzoylpyridine (BpT) analogs were synthesized from the DpT series by replacing one of the 2-pyridyl groups of the DpT compounds with a phenyl ring (Fig. 1) [4]. The presence of the 2-benzoylpyridine moiety within the BpT compounds enhanced the redox activity of their Fe complexes and also enhanced their lipophilicity, iron mobilization efficacy and ability to inhibit iron uptake from the iron transport protein, transferrin [4]. Overall, members of the DpT and BpT series of compounds are highly effective iron chelators in cell culture [3].
Figure 1. Structures of the chelators discussed in this article.
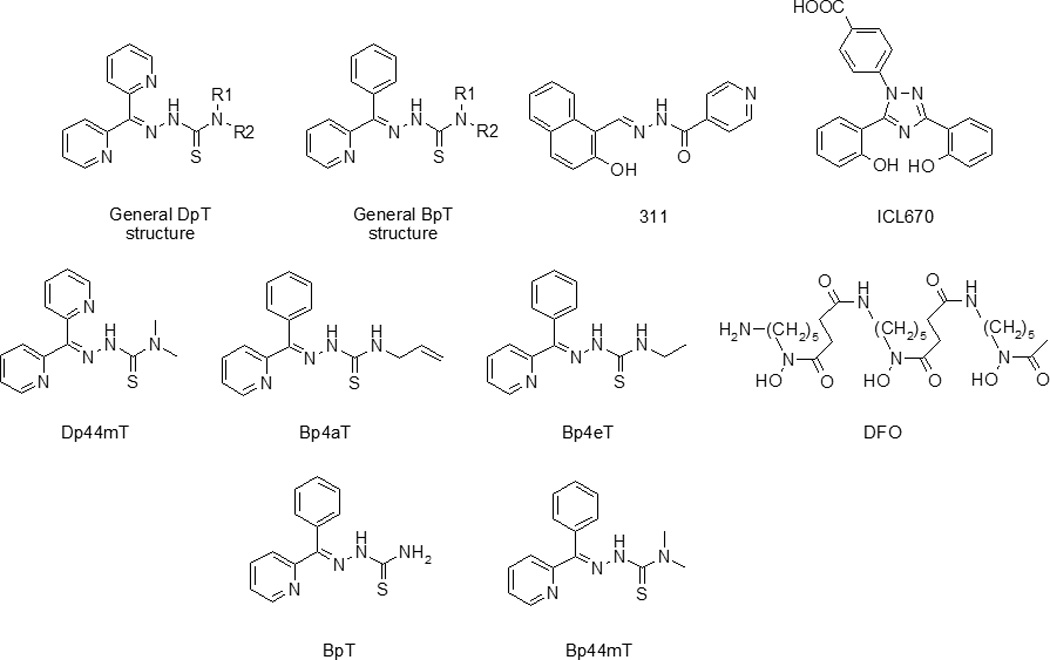
General structure of the DpT analogs; general structure of the BpT analogs; 2-hydroxy-1-naphthylaldehyde isonicotinoyl hydrazone (311); 4-[3,5-bis-(hydroxyphenyl)-1,2,4-triazol-1-yl]-benzoic acid (ICL670); di-2-pyridylketone 4,4-dimethyl-3-thiosemicarbazone (Dp44mT); 2-benzoylpyridine 4-allyl-3-thiosemicarbazone (Bp4aT); 2-benzoylpyridine 4-ethyl-3-thiosemicarbazone (Bp4eT); desferrioxamine (DFO); 2-benzoylpyridine thiosemicarbazone (BpT); and 2-benzoylpyridine-4,4-dimethyl-3-thiosemicarbazone (Bp44mT).
Human immunodeficiency virus-1 (HIV-1) infection is associated with progressive iron deposition in bone marrow, liver, brain and other organs [5]. The higher levels of iron in these tissues have a number of effects, including: (1) enhancement of HIV-1 replication, in which iron plays a role in the synthesis of viral particles by HIV-infected host cells [6–8]; (2) facilitation of the growth of bacterial invaders, for which iron serves as an important nutrient [9]; (3) depression of granulocyte, macrophage and lymphocyte function and potential promotion of neoplastic growth [10, 11]; and (4) down-regulation of stress protein production [12]. Therefore, iron chelators which reduce iron levels may have a dual benefit in HIV-1 therapeutic intervention by both relieving the effects of HIV-1-induced iron overload and directly inhibiting HIV replication.
Several studies have reported the potential of iron chelators to act as HIV-1 replication inhibitors [7, 13]. Previously, we reported the inhibition of HIV-1 transcription in cultured cells by the iron chelators, 2-hydroxy-1-naphthylaldehyde isonicotinoyl hydrazone (311; Fig. 1) and 4-[3,5-bis-(hydroxyphenyl)-1,2,4-triazol-1-yl]-benzoic acid (ICL670, or desferasirox; Fig. 1), the latter of which is an FDA-approved orally-adminstered iron chelator currently in clinical use [14]. Recently, we showed that the BpT chelators inhibit HIV-1 transcription and viral replication in vitro in cultured T cells and primary peripheral blood mononuclear cells (PBMCs) [15]. In this previous study, we screened a library of BpT- and DpT-based iron chelators for their ability to inhibit HIV-1 transcription and identified di-2-pyridylketone 4,4-dimethyl-3-thiosemicarbazone (Dp44mT; Fig. 1), 2-benzoylpyridine 4-allyl-3-thiosemicarbazone (Bp4aT; Fig. 1) and 2-benzoylpyridine 4-ethyl-3-thiosemicarbazone (Bp4eT; Fig. 1) as the most potent inhibitors. We demonstrated that these compounds down-regulate the cellular activity of cyclin-dependent kinases-2 and -9 (CDK-2 and CDK-9), both of which are involved in the regulation of HIV-1 transcription [16]. Based on these promising data, we concluded that these novel compounds may have potential use in anti-retroviral regimens and may be useful as components of combination therapy.
The most widely used iron chelator on the market today is desferrioxamine (DFO; Fig. 1), which has been in clinical use for over 40 years for the treatment of iron overload. Though clinically effective, DFO has the drawback of having relatively high hydrophilicity, which reduces its ability to cross the lipid bilayer of cell membranes [17] and lowers its potential for absorption from the gastrointestinal tract. Consequently, the drug must be given parenterally, as a continuous subcutaneous infusion, or as a continuous intravenous infusion over long periods of time (12–24 h/day; 5–6 days/week) [18, 19]. On the other hand, ICL670 is absorbed more effectively by the intestine and also has a longer half-life than DFO [20]. Unfortunately, ICL670 was less than optimal in its inhibition of HIV-1 replication, with an IC50 value in the high micromolar range [14]. Thus, our focus has shifted to evaluating the therapeutic effectiveness of the new chelators, Bp4eT and Bp4aT. To this end, in the studies reported herein, we sought to investigate the cellular permeability of Bp4eT and Bp4aT as an initial indicator for assessing how they are absorbed from the gut. First, we developed and validated a HPLC method to measure the levels of the E and Z isomeric forms of Bp4eT and Bp4aT in transport media. Second, we employed this method to: (1) determine the iron chelating properties of the compounds in cultured THP-1 cells; (2) measure their cytotoxicity; and (3) assess their permeability across Caco-2 monolayers.
2. Materials and Methods
2.1. Chemicals and Materials
Acetic acid, ammonium acetate, ethylenediaminetetraacetic acid (EDTA) and HPLC-grade acetonitrile and water were purchased from Sigma-Aldrich Chemical Co. (St. Louis, MO).
2.2. Preparation and Analysis of Chelator Solutions
The DpT- and BpT-series chelators used in this study were synthesized and characterized by standard methods in our laboratory [4]. Stock solutions were prepared in DMSO at 100 mM concentrations. Chelator solutions were prepared by making further dilutions in HBSS buffer from the stock solution. The final DMSO concentration was 0.5% in the 500 µM preparation which was the highest concentration used in the cytotoxicity study. In addition, the final DMSO concentration was 0.3% in the 300 µM preparation which is the highest concentration used in the transport study. After dilution, the chelator solutions were then ultrasonicated to ensure complete solubility. The solutions were warmed to 37°C prior to the transport study or prior to injection into the HPLC system to prevent precipitation. The stability of the chelator solutions was tested under the following storage conditions: (i) 4°C for one week with more than one freeze-thaw; (ii) room temperature for 4 h and (iii) 40°C for 4 h. Sample solutions were prepared in the range of 10 – 200 µg/mL.
2.3. Chromatographic Separations
The HPLC system employed included a Waters 2695 Alliance peristaltic pump and a Waters 996D UV detector (Waters Corp., Milford, MA). Separations were carried out on a reversed-phase Discovery HS F5 column (250 mm × 4.0 mm × 5 µm, Sigma-Aldrich). The column was kept at 40°C with a flow rate of 1 mL/min. The mobile phase was composed of 2 mM ammonium acetate/10 mM EDTA buffer and acetonitrile (50:50 v/v) at pH 5.8. The UV detector wavelength was set at 318 nm and 20 µL samples were injected in all experiments. 10 µM Dp44mT was used as an internal standard. The limit of detection (LOD) of the method was defined as the lowest concentration of an analyte that gave a signal-to-noise ratio of 3:1. On the other hand, the limit of quantitation (LOQ) was defined as the minimum concentration of the analyte that can be estimated quantitatively with suitable precision and accuracy. The linearity of the method was evaluated using standard solutions at five different concentrations of each of the chelators within the range of 1–150 µM in quadruplicate. Mean peak area values were plotted against the corresponding concentrations. Within-day (intra-day) precision was determined from the analysis of six individually-prepared chelator standard solutions in the range of 1 – 300 µM. The same measurement at three different concentrations (15, 30, and 100 µM) was repeated over the course of the next five days to determine between-day (inter-day) precision. Accuracy is defined in the literature as an estimation of the nearness of test data procured by a method to the true value. Method accuracy was estimated based on the calculated recovery of the analyte from prepared solutions compared to blank samples. The HPLC data were analyzed using Waters Breeze HPLC software (Waters Corp.).
2.4. Iron Chelation Assays
The iron chelation assay we employed involved comparing the effects of the various chelators on the labile iron pool (LIP) in human acute monocytic leukemia (THP-1) cells. We followed the protocol of Cabantchik and colleagues [21] who saturated cells with calcein, a weak iron chelator, the fluorescence of which is quenched upon binding iron. A cell-permeable derivative of calcein, namely calcein-AM, was added to washed THP-1 cells. Once inside the cells, calcein-AM was cleaved by endogenous intracellular esterases to give calcein, which bound the available iron. Treatment of the cells with iron chelators removed the calcein-bound iron, releasing the calcein and causing an increase in its fluorescence; this was a measure of the amount of cellular iron that had been effectively removed by the iron chelators [21]. We used the following formula to analyze the data: F/Fi = 1 + k(Q), where Fi = fluorescence in the presence of quencher (iron) at time 0; F = fluorescence at a given time after addition of chelator; and Q is the concentration of the quencher (iron). Thus, the value of (F−Fi)/Fi is proportional to the concentration of chelated iron when equilibrium has been reached and the calcein fluorescence has been de-quenched. This latter index is a measure of the chelator’s activity in cells.
2.5. Preparation of Cell Monolayer Cultures
Human epithelial colorectal adenocarcinoma (Caco-2) cells (HTB-37, passage 18) used in this study were purchased from American Type Culture Collection (ATCC; Manassas, VA) and were cultured in complete Dulbecco's Modified Eagles Medium (DMEM) containing 10% fetal bovine serum (FBS; Invitrogen, Carlsbad, CA), 1% glutamine and 1% each of the antibiotics, penicillin and streptomycin, at 37°C in a 5% CO2 atmosphere. Cells were passaged at 80–90% confluency using 0.05% trypsin-EDTA and the medium was changed every other day. For the permeability study, cells were cultured as monolayers in 12-well polycarbonate transwell inserts (with a pore size of 0.4 µm and a diameter of 12 mm) obtained from Corning-Costar (Corning, NY) at a density of 62,000 cells/cm2.
2.6. Measurement of labile iron
The labile iron pool (LIP) was analyzed following the protocol of Cabantchik and colleagues, where an incubation with calcein-AM, followed by treatment with the iron chelator, SIH, was used to detect the amount of chelatable cellular iron [21]. THP-1 cells were treated with 25 µM ferric sulfate for 1 h and then supplemented with 0.2 µM calcein-AM (Invitrogen/Molecular Probes) for 10 min at 37°C. The cells were then washed with PBS, resuspended in PBS and placed in 96-well plates. Then the iron chelators, 10 µM Bp4eT, 10 µM Bp4aT or 30 µM SIH, were added and fluorescence was immediately measured using the Light Cycler 480 (Roche) which was programmed for continuous cycles of 2 min incubation at 37°C and then fluorescent measurement in the SYBR Green I detection format (excitation at 465 nm and emission at 510 nm). The first measurement was designated as zero measurement. We used the following formula to plot the data: F/Fi = 1 + k(Q), where Fi is the fluorescence in the presence of quencher at time 0, F is the fluorescence at given time, and Q is the concentration of quencher. Thus, the (F−Fi)/Fi value is proportional to the concentration of chelatable iron when equilibrium is reached, and calcein fluorescence is dequenched.
2.7. Cytotoxicity Assay
Caco-2 cells were grown in 96-well plates at 37°C and incubated with the iron chelators at concentrations of up to 500 µM for 24 h at 37°C. To assess cytotoxicity, media was removed and the cells were washed with Dulbecco’s Phosphate Buffered Saline (DPBS) to remove any extracellular serum esterase activity that might interfere with the assay (see below). We then used the LIVE/DEAD Viability/Cytotoxicity Kit (Invitrogen/Molecular Probes; Cat#: L3224) which utilizes a standard protocol implementing calcein-AM. Cells were supplemented with 0.2 µM calcein-AM (Molecular Probes, Invitrogen), a compound that, when hydrolyzed by intracellular esterase activity, releases the fluorescent, iron-binding compound, calcein. The cells were incubated with calcein-AM for 10 min at 37°C. Fluorescence intensity, which was proportional to the number of viable cells present, was measured using a model LS50B Luminescence Spectrometer (Perkin-Elmer, Waltham, MA) equipped with a robotic 96-well plate scanner using an excitation wavelength of 495 nm and an emission wavelength of 515 nm. A positive control containing 100% dead cells was prepared by treating the cells with Triton X-100 (1% v/v), incubating them with calcein-AM at 0.2 µM, and measuring fluorescence intensity.
2.8. Drug Transport (Permeability) Assays
The movement of Bp4eT and Bp4aT across Caco-2 monolayers was studied by adapting a published protocol [22] with minor changes. Briefly, Caco-2 cells were grown on 24-well transwell plates containing DMEM complete media, which was changed every other day until cells became totally confluent and a monolayer was evident. The transport study was performed on the twenty-first day after initiation of the growth of the cells. The Caco-2 cell monolayers were washed twice with Hank’s Balanced Salt Solution (HBSS) containing 20 mM HEPES and then treated with one or the other of the iron chelators at concentrations of 100 and 300 µM. Chelators were added to the apical (AP) or basolateral (BL) wells in 0.3 mL or 0.6 mL of transport buffer for bidirectional transport evaluation. After incubating the culture at 37°C for 30, 60 and 120 min, 100 µL aliquots were removed from each receiving chamber and replaced with the same volume of transport buffer to maintain experimental homeostasis. The aliquots were analyzed by HPLC in quadruplicate. The apparent permeability coefficients (Papp), expressed in cm/s, were calculated by using the following equation [23]:-
Papp = ΔQ/Δt * 1/60 * 1/A * 1/Co,
where ΔQ/Δt is the permeability rate (nmol/min) and is the same as the slope of the plot of the amount (in nmol) of chelator traversing the monolayer versus time (in min); A is the surface area of the cell membrane (cm2); and Co is the initial concentration of chelator in the donor chamber (µM).
2.9. Lucifer Yellow (LY) Permeability Assay
The lucifer yellow (LY) permeability assay was performed both at the beginning and at the end of the transport study. The purpose of this assay was to test the integrity of the Caco-2 monolayers used for the drug transport investigations, described above. In this assay, LY, a fluorescent compound, was placed on one side of the monolayer, and fluorescence was measured on the opposite side. An absence of fluorescence on the opposite side was indicative of a tightly-sealed, intact monolayer. Briefly, Caco-2 cells grown on 12-well transwell plates were washed three times with HBSS. Then, 300 µL of LY solution (100 µg/mL) were added to each well in the donor tray and 600 µL of HBSS were added to each well in the receiver tray for the apical-to-basolateral (AP-to-BL) transport study. For the basolateral-to-apical (BL-to-AP) transport study, the converse was conducted: 600 µL of LY solution (100 µg/mL) was added to each well in the donor tray and 300 µL of HBSS were added to each well in the receiver tray. The culture plate was incubated for 2 h at 37°C and 100 µL aliquots were collected and transferred to a 96-well plate for measurement of fluorescence intensity. Excitation and emission wavelengths were set at 485 nm and 535 nm, respectively. In this manner, the extent of “leakage” through the monolayer was assessed.
2.10. Statistical analysis
The program, Statistical Package for the Social Sciences (SPSS) version 11.0, procured from IBM Corp. (Somers, NY), was employed for statistical analysis. Results are presented as mean ± standard deviation (n=3 determinations) in a typical experiment of 3 performed. Data were compared using Student’s t-test. Results were considered significant when p<0.05.
3. Results
3.1. Development and Validation of an HPLC Method to Measure Bp4eT and Bp4aT Levels
We developed and validated a HPLC method with UV detection to measure levels of Bp4eT and Bp4aT, and have applied this protocol to chelation and transport (permeability) studies. A method originally developed to measure Dp44mT [24], a thiosemicarbazone with a structure similar to those of Bp4eT and Bp4aT (Fig. 1), served as a starting point for our method development and validation protocols. Chromatographic separations were achieved by using a reversed-phase column with the mobile phase composed of a mixture of ammonium acetate buffer and acetonitrile (62:38 v/v). The temperature of the system was maintained at 40°C. The mobile phase buffer pH was found to be optimal at pH 5.8, both in terms of the solubility of the compounds and peak resolution. The method we developed enabled the successful separation of Bp4eT, Bp4aT and Dp44mT, the latter of which was employed as an internal standard (IS) for the study.
Both Bp4eT and Bp4aT were eluted as two separate peaks, and we identified these peaks as corresponding to the E and Z isomeric forms of the compounds (Fig. 2). This assignment was based on a study by Stariat et al. [25] that used an LC-MS/MS method to demonstrate that Bp4eT exists in the E and Z isomeric forms. Under the chromatographic conditions employed, the retention times were 6.8 min and 12.0 min for Bp4eT (Figs. 2A and B); 7.5 min and 13.2 min for Bp4aT (Figs. 2C and D); and 3.75 min for the IS, Dp44mT (Figs. 2A and B). The combined (E plus Z) peak area of Bp4eT was twofold greater than that of Bp4aT (compare Figs. 2A and C), despite the fact that equal amounts of each were loaded onto the column. This indicates that the extinction coefficient at 318 nm is higher for Bp4eT than Bp4aT.
Figure 2. Representative chromatograms showing Z-to-E isomer conversion over time for Bp4eT and Bp4aT in aqueous solution.

(A) Blank HBSS buffer; (B) 50 µM Bp4eT and 10 µM Dp44mT in HBSS buffer (20 µL) injected immediately after preparation of the solution from the solid; (C) Under the same conditions as (B), but after a 24 h incubation at 4°C; (D) 50 µM Bp4aT and 10 µM Dp44mT in HBSS buffer (20 µL) injected immediately after preparation from the solid; and (E) under the same conditions as (C), but after a 24 h incubation at 4°C. IS, internal standard, Dp44mT. Results are mean ± SD (3 determinations) in a typical experiment of three performed.
The HPLC data also showed that immediately after solution preparation from the powder form, the majority of each compound existed predominately as the Z isomer (Figs. 2A and C). However, a major Z-to-E shift was observed after 24 h at 4°C (Figs. 2B and D). Therefore, for validation of the HPLC method and for the drug transport studies, sample solutions were prepared in HBSS and stored at 4°C for a minimum of one day before they were used. This temperature and buffer condition resulted in the same peaks for the two isomers at the same concentration. Therefore, data analysis was performed using the ratio of the sum of the peak areas of the two isomers to the area of the IS compound, Dp44mT. No major interfering peaks were observed for either the compounds in HBSS or HBSS buffer alone (blank). Furthermore, the size of the peak corresponding to Dp44mT (IS) was not affected by the presence of the chelators (data not shown).
Calibration curves were linear over the concentration range of 1.5 – 100 µM for Bp4eT and 5 – 150 µM for Bp4aT as shown in the supplemental data (Fig. S1). The mean (n=3) correlation coefficients for the linear curves were 0.9941 ± 0.0016 for Bp4eT and 0.9981 ± 0.0001 for Bp4aT. Mean y-intercepts were 0.0328 ± 0.0014 (n=3) and 0.0406 ± 0.0028 (n=3) for Bp4eT and Bp4aT, respectively. The mean slopes (n=3) were 0.0514 ± 0.0019 for Bp4eT and 0.0129 ± 0.0003 for Bp4aT.
The LODs for Bp4eT and Bp4aT, which are the minimum concentrations of chelator that give a signal-to-noise ratio of 3, were 0.3 µM and 1.0 µM, respectively. The LOQs, which are the minimum concentrations that can be determined with acceptable precision (CV<20%), were 1.0 µM for Bp4eT and 5.0 µM for Bp4aT. Assay precision was within an acceptable level in terms of both same-day (<10% CV) and between-day (<22% CV) variation within the linear range of 1.0 – 100 µM for Bp4eT and 5.0 – 150 µM for Bp4aT. The precision (and accuracy) data are shown in Table 1. Since there are no commercially available standards for the two compounds, we adapted the published International Conference on Harmonisation of Technical Requirements for Registration of Pharmaceuticals for Human Use (ICH) Guideline for estimation of accuracy when the standards are not employed [26]. The method accuracy was derived from the linearity, precision and specificity data. Specificity data is based on the comparison of calculated recovery of the analyte from prepared solutions to the blank samples. This approach was employed considering the high purity of compounds. The two chelators in HBSS solution were stable over a 5 day period when stored at 4°C with a precision of CV <22% (Table 1 – presented as interday precision data). Further, the chelators were stable for 4 h at room temperature (25 °C) and 40 °C (data not shown).
Table 1. Accuracy and Precision of the HPLC method for the analysis of the iron chelators, Bp4eT, Bp4aT and Dp44mT, in the transport buffer (HBSS).
| Theoretical concentration (µM) |
Peak Area (mean ± S.D.) |
CV (%) |
No. Samples Analyzed |
|---|---|---|---|
| Bp4eT | |||
| Intra-day Assay | |||
| 0.0 | 1433 ± 0.0 | 0.0 | |
| 0.5 | 5468 ± 284 | 5.2 | 4 |
| 1.5 | 13744 ± 528 | 3.8 | 4 |
| 5 | 84977 ± 3744 | 4.4 | 4 |
| 15 | 257376 ± 3191 | 1.2 | 4 |
| 50 | 620703 ± 18182 | 1.8 | 4 |
| 100 | 1081750 ± 20019 | 1.9 | 4 |
| Inter-day Assay | |||
| 15 | 228054 ± 49715.8 | 21.8 | 3 |
| 30 | 600321 ± 91849.11 | 15.3 | 3 |
| 100 | 1093472 ± 137777.5 | 12.6 | 3 |
| Bp4aT | |||
| Intra-day Assay | |||
| 0.0 | 39 ± 0.0 | 0.0 | |
| 1 | 985 ± 93 | 9.4 | 4 |
| 3 | 3801 ± 974 | 8.6 | 4 |
| 10 | 17983 ± 1034 | 5.8 | 4 |
| 30 | 78047 ± 1851 | 2.4 | 4 |
| 100 | 401998 ± 9390 | 2.3 | 4 |
| 300 | 535005 ± 1275 | 0.2 | 4 |
| Inter-day Assay | |||
| 15 | 30872±3859 | 12.5 | 3 |
| 30 | 60974±6463 | 10.6 | 3 |
| 100 | 512615±47160 | 9.2 | 3 |
| Dp44mT | |||
| Intra-day Assay | |||
| 0.0 | 263 ± 0.0 | 4.9 | 4 |
| 0.3 | 1511 ± 71 | 4.7 | 4 |
| 1 | 3641 ± 191 | 5.2 | 4 |
| 3 | 14790 ± 1419 | 9.6 | 4 |
| 10 | 154297 ± 10171 | 6.6 | 4 |
| 30 | 598872 ± 35040 | 5.9 | 4 |
| 100 | 2132558 ± 29299 | 1.4 | 4 |
| 300 | 6352227 ± 62680 | 1.0 | 4 |
| 1000 | 20322660 ± 270978 | 1.3 | 4 |
The two chelators in HBSS solution were stable over a 5 day period when stored at 4°C with a precision of CV < 22%, as shown in the table. Results are mean ± SD (n=3)
3.2. Iron Chelating Properties of Bp4eT and Bp4aT
The chelation properties of Bp4eT and Bp4aT were determined using a calcein-based method. For this assay, we used cultured promonocytic THP-1 cells, which have some of the characteristics of human macrophages [27], the type of cells that consume aged red blood cells and play a critical role in recycling or storing the iron derived from the breakdown of hemoglobin. The THP-1 cells were loaded with ferric sulfate (25 µM) and then treated with non-fluorescent calcein-AM, which, after being transported into the cells, is converted to calcein, a weak iron-binding fluorescent compound, the fluorescence of which is quenched upon binding to iron. After addition of iron chelators to the THP-1 cells pre-treated with calcein-AM, an increase in the fluorescence was observed as the calcein released its iron to the added chelator, which binds iron with considerably higher affinity. Thus, the iron chelating ability of experimental compounds was measured. We compared the chelating abilities of Bp4eT and Bp4aT to the well-studied aroylhydrazone chelator, salicylaldehyde isonicotinyl hydrazone (SIH), which was used as a positive control [28]. The results (Fig. 3) show that both Bp4aT and Bp4eT are slightly more effective intracellular iron chelators than SIH, binding higher levels of iron from the so-called LIP. Thus, both Bp4eT and Bp4aT showed significant ability to chelate intracellular iron in cultured cells, with Bp4aT showing greater chelation efficacy than Bp4eT.
Figure 3.

Cellular iron chelation by Bp4eT and Bp4aT using THP-1 cells in culture. THP-1 cells were treated with iron(II) sulfate (10 µM) for 3 h at 37°C. After this, the cells were loaded with calcein-AM (0.2 µM) for 10 min at 37°C, and then 10 µM of the indicated iron chelator was added. Fluorescence intensity of calcein was measured in real time starting just after the addition of chelator. Here, the size of the labile iron pool (LIP) in the cells is represented as fractional fluorescence (F−Fi)/Fi, where Fi = fluorescence in the presence of quencher at time 0, and F = fluorescence at a given time. LIP is plotted against time of incubation with chelator (in min). Results are means of 3 determinations in a typical experiment of three performed.
3.3. Cytotoxicity of short-term Bp4eT and Bp4aT incubations with Caco-2 Cells
We then analyzed the effect of Bp4eT and Bp4aT on the normal growth of Caco-2 cells over 24 h to determine whether any toxic effects would be evident during the transport experiments. The results show that both Bp4eT and Bp4aT had little effect on Caco-2 cell growth at concentrations up to 500 µM after 24 h of treatment, although the ligand BpT, which shows low anti-proliferative activity [29] did have some effect, with cell viability dropping to around 70% (relative to control) at 500 µM BpT (Fig. 4).
Figure 4. Effect of the chelators Bp4eT, Bp4aT and BpT on the growth of Caco-2 cells.

Caco-2 cells were grown on 96 well plates (2 × 10⁵ cells/well) and treated either of the chelators for 24 h/37°C. Then the cells were loaded with 0.2 µM calcein-AM for 10 min/37°C and fluorescence was measured. Fluorescence intensity of the treated cells was compared to the untreated (control) cells and expressed as % of Control Fluorescence Intensity for the chelators, Bp4eT, Bp4aT, and also BpT, a chelator with low anti-proliferative activity. Fluorescence intensity (% control) was plotted against concentration (in µM). Results are mean ± SD (3 determinations) in a typical experiment of three experiments performed.
3.4. Transport of Bp4eT and Bp4aT across Caco-2 Cell Monolayers
3.4a The Integrity of the Monolayer
The integrity of the junctions between the Caco-2 monolayers and the drug transport transwell plate walls was evaluated using Lucifer Yellow (LY) permeability assays. If a monolayer forms a tight seal against the plate wall, then leakage of the fluorescent LY through (or around) it will be negligible. The assays were conducted prior to, and after, each drug transport experiment. Our data showed no significant LY infiltration, confirming the integrity of the monolayer (Table 2). Less than 2% of LY was recovered from the receiver chambers for transport in either direction (apical-to-basolateral or basolateral-to-apical) at the ends of the experiments.
Table 2. Measurement of Caco-2 monolayer integrity by LY leakage.
| Chelator added: Bp4aT |
% LY leakage |
Chelator added: Bp4eT |
% LY leakage |
|---|---|---|---|
| 100 µM: | 100 µM: | ||
| AP-to-BL | 0.55 ± 0.1 | AP-to-BL | 0.52 ± 0.1 |
| BL-to-AP | 0.79 ± 0.2 | BL-to-AP | 1.82 ± 0.1 |
| 300 µM: | 300 µM: | ||
| AP-to-BL | 0.52 ± 0.1 | AP-to-BL | 0.49 ± 0.1 |
| BL-to-AP | 0.77 ± 0.3 | BL-to-AP | 1.1 ± 0.31 |
Results are mean ± SD (n=3)
Abbreviations: AP, apical; BL, basolateral.
3.4.b Transport Kinetics of Bp4eT and Bp4aT in Caco-2 Monolayers
The transport/movement of Bp4eT and Bp4aT across the monolayer was measured in both apical (AP)-to-basolateral (BL) and BL-to-AP directions. A bi-directional transport study helps to avoid potential bias due to back-diffusion of the drugs from the receiving chamber. The time course of transport of the compounds at 100 µM or 300 µM in both directions is shown in Fig. 5. At 30 min, the compounds were detectable in the receiving chamber in both directions. The transport of each compound in both directions increased pseudo-linearly with increasing time of incubation. The data also showed that the transport of Bp4aT was faster than that of Bp4eT by approximately 1.5-fold. The Papp values calculated from the slopes of the curves shown in Fig. 5 are summarized in Table 3. There was no significant difference between the rates of AP-to-BL and BL-to-AP transport for both chelators (Fig. 5 and Table 3). The ratio (Rnet) of the Papp values for the two directions of transport was near unity (0.8 to 1.1; Table 3), indicating that there is no inherent directional bias for the transport.
Figure 5. Transport of Bp4eT and Bp4aT across Caco-2 Monolayers.
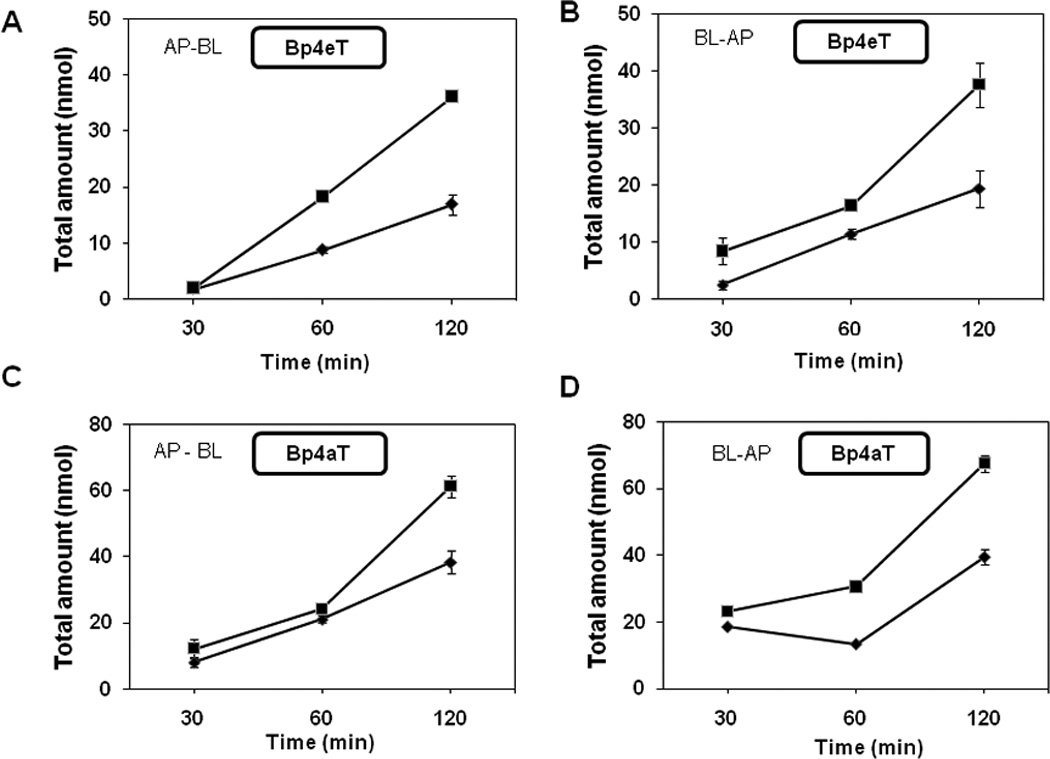
Bp4eT or Bp4aT was loaded onto either the apical (AP) or the basolateral (BL) side of Caco-2 monolayers at the indicated concentrations and incubated at 37°C for the indicated times (30, 60 and 120 min). Samples were collected from the receiving side and the total amount of chelator present was measured by HPLC. Total amount measured (in nmol) is plotted against time of incubation. A, B: Bp4eT; C, D: Bp4aT. Solid triangles: 100 µM of chelator; solid squares, 300 µM of chelator. Results are mean ± SD (3 determinations) in a typical experiment of three experiments performed.
Table 3. Apparent Permeability (Papp) values for Bp4eT and Bp4aT.
The Papp values were calculated from the slopes of the curves in Fig. 5. (ref. 22). Rnet is the ratio of Papp (BL-to-AP) to Papp (AP-to-BL).
| Bp4eT | Bp4aT | |||||
|---|---|---|---|---|---|---|
| Conc (µM) |
Papp (× 10−5) (cm/s) AP-to-BL |
Papp (× 10−5) (cm/s) BL-to-AP |
Rnet | Papp (× 10−5) (cm/s) AP-to-BL |
Papp (× 10−5) (cm/s) BL-to-AP |
Rnet |
| 100 | 0.809 ± 0.119 | 0.889 ± 0.196 | 1.10 | 1.670 ± 0.016 | 1.292 ± 0.282 | 0.77 |
| 300 | 1.819 ± 0.302 | 1.627 ± 0.107 | 0.89 | 2.756 ± 0.261 | 2.534 ± 0.454 | 0.92 |
Results are mean ± SD (n=3)
Abbreviations: AP, apical; BL, basolateral.
4. Discussion
Treatment of chronic illnesses, such as HIV-1, requires long-term drug administration. For this reason, oral administration is the method of choice for treatment. In considering the development of iron chelators as a long-term treatment in combination therapy, it is therefore critical to assess the suitability of the compounds for oral therapy. Drug absorption is a key pharmacokinetic parameter in oral drug therapy. The “gold-standard” iron chelating agent, DFO, has very poor absorption through the gastrointestinal tract and must be administered parenterally [30]. Although an alternative, ICL670 (Deferasirox), is a well-absorbed and -tolerated orally-effective iron chelator, its inhibition of HIV-1 replication is less than optimal. In fact, the IC50 value of ICL670 is at high micromolar concentrations as opposed to the nanomolar concentrations seen with Bp4eT and Bp4aT [14, 15]. Therefore, we were interested in studying the oral permeability potential of the latter two iron chelators. In order to perform these drug transport studies, a reliable analytical method to measure the chelators was critical. HPLC is a widely used technique for the analysis of compounds and has become a primary method for measurement of non-volatile small molecules [31]. We chose to develop a HPLC method, with a focus on its practical applications to future pre-clinical and clinical studies.
Here we have developed a simple and reliable HPLC method for the determination of Bp4eT and Bp4aT in drug transport buffer. Preliminary UV spectrophotometric scans of the compounds revealed a maximum absorption at 318 nm. Therefore, UV detection at this wavelength was used for all HPLC experiments. The compound Dp44mT was selected as the HPLC internal standard due to its structural similarity to the BpT series compounds (Fig. 1), combined with its significantly different retention time (see Fig. 2). Our validation data indicate that the method is sensitive and reliable in our transport studies. The developed procedure allowed acceptable separation and quantification of the compounds we analyzed, with a run time of less than 15 min. It provided acceptable accuracy (85–115% of true values) and precision (CV<22% in both intra- and inter-day assays). The LOQ values were <1 µM for both compounds, which were found to be stable in drug transport buffer for several days at 4°C. Therefore, the HPLC method developed can be generally suitable for future studies examining Bp4eT and Bp4aT.
Both Bp4eT and Bp4aT showed no apparent cytotoxicity on Caco-2 cells at concentrations of ≤ 500 µM over 24 h (Fig. 4), unlike human embryonic kidney (HEK)-293T and the HIV-1-susceptible CEM cells, where the DpT and BpT series of chelators demonstrated anti-proliferative activity [32]. Therefore, we used two concentrations of these ligands, 100 µM and 300 µM, for the transport studies. Given the results of the cytotoxicity study, these concentrations should not be toxic to Caco-2 cells, especially since the incubation time (2 h) used for the transport study was much shorter than the 24 h incubation used for the cytotoxicity assay. Moreover, the observation that cell monolayers remained intact and did not become ‘leaky’ during the course of these experiments also attests to a lack of cytotoxicity by these chelators.
Our transport studies showed that both Bp4eT and Bp4aT are permeable in Caco-2 monolayers and have permeability values similar to those for other oral drugs [33]. For example, ICL670 has been reported to have a Papp value of 1.66 ± 0.13 × 10⁻⁵ cm/s for Caco-2 cells in vitro [34], which is similar to the values of 1.7 × 10⁻⁵ cm/s and 2.6 × 10⁻⁵ cm/s we report here for Bp4eT and Bp4aT, respectively. Also, the data herein did not show much directional bias in transport, whether from AP-to-BL or from BL-to-AP, as indicated by Rnet values which were close to 1.0 for both compounds at different concentrations. Since, the BpT chelators are novel compounds, their interactions with various drug efflux transporters such as P-glycoprotein (Pgp), multidrug resistance associated protein (MRP) and breast cancer resistance protein (BCRP) is yet to be determined. Further, their carrier-mediated influx, metabolism and protein-binding needs to be estimated also. Hence, we assumed linearity in the uptake/efflux conditions to provide the best possible approximation of Papp values in the Caco-2 monolayers. In the future, the Catenary model developed by Sun et al., may be potentially useful to employ to further examine permeability under non-linear conditions [35].
Bp4aT had a relatively higher permeability in Caco-2 monolayers compared to Bp4eT (Fig. 5). The two compounds have similar structures (Fig. 1) and molecular weights. However, our calcein-based chelation experiments seem to indicate that Bp4aT is a more efficient iron chelating agent than Bp4eT. Significantly, both Bp4aT and Bp4eT sequester cellular iron by binding it through the same type of coordination site [4]. Thus, the reason for their different iron chelation activities is not apparent. It should be recognized that the higher rate of cellular permeability of Bp4aT relative to Bp4eT (Fig. 5) seen in the assay may have contributed to the higher apparent chelation efficacy of Bp4aT that was observed (see Table 3).
Data from our previous studies showed that, among the series of chelators that we tested [14, 15], Bp4eT and Bp4aT were the most effective in terms of inhibition of HIV-1 transcription. The transport data presented here suggest the BpT chelators should demonstrate good intestinal absorption. Of relevance, assessment of the oral activity of these compounds using “Lipinski’s Rule of 5” which considers characteristics such as the octanol-water partition coefficient, the number of H-bond donors/acceptors and the molecular mass, showed these agents had properties enabling absorption after oral administration [2]. The potential for oral administration of these agents has also been illustrated by recent studies demonstrating that the BpT series analog, 2-benzoylpyridine-4,4-dimethyl-3-thiosemicarbazone (Bp44mT; see Fig. 1), showed marked efficacy against lung cancer xenografts in mice when given via the oral route (35). Collectively, these data are very encouraging for future development of oral formulations of these compounds. In addition, it is likely that further structural modifications of Bp4eT and Bp4aT could lead to the discovery of even better chelators for treatment of HIV-1 infection or cancer.
5. Conclusions
In conclusion, we have developed a simple and sensitive HPLC method to detect and measure levels of the novel iron chelators, Bp4eT and Bp4aT, which are shown to have good permeability in Caco-2 cells. Our results demonstrating enhanced permeability and little or no cytotoxicity, at least over short periods of incubation (2–24 h), suggest that Bp4eT and Bp4aT could potentially be formulated for oral therapy. Our data, described both here and in our previous studies, provide evidence that Bp4eT and Bp4aT have an acceptable therapeutic window, a novel mechanism of action, and a desirable drug permeability profile. Thus, they deserve further investigation in terms of their use in future anti-HIV-1 treatment or anti-tumor regimens. Our findings are consistent with the possibility that these iron chelators may be used in oral anti-retroviral combination therapy.
Supplementary Material
HPLC injections were made in quadruplicate using 20 µL of analyte and a run time of 15 min. Data are plotted as the ratio of the sum of the peak areas of the two isomers of the analyte to the peak area of Dp44mT (IS) versus the concentration (µM). Results are mean ± SD (3 determinations) in a typical experiment of three performed.
Highlights.
We developed a sensitive HPLC method for assessment of BpT-E/Z isomers.
We demonstrated effective iron chelation of BpT-iron chelators that inhibit HIV-1.
We estimated the permeability profile of BpT-E/Z isomers in Caco2 monolayers.
We anticipate that BpT chelators could hold promise as orally-effective agents.
Acknowledgments
This project was supported by NIH grants from National Heart, Lung, and Blood Institute and The Office of Research on Minority Health (2R25 HL003679-08 to V.R.G. and F31 HL090025 to Z.D.); by a Howard University Faculty Seed Grant (U400021 to S.N. and P.K.K); by National Center for Research Resources grants (NIHKL2RR031974 and UL1RR031975 to P.K.K, and 2MO1 RR10284 to V.R.G).; by AACP New Investigator Grant (AACPNIA2012 to P.K.K.); by National Institute of General Medical Sciences MBRS-SCORE grants (1SC1GM082325 to S.N. and 1SC3GM083752 to W.M.B); by Research Centers in Minority Institutions (RCMI) Program of the Division of Research Infrastructure, National Center for Research Resources grants (RCMI-NIH 2G12RR003048 to S.N. and W.M.B); by a National Health and Medical Research Council Project Grant (to D.R.R., D.B.L. and D.S.K.); by a Senior Principal Research Fellowship (to D.R.R.); and by Cancer Institute New South Wales Early Career Development Fellowships (to D.B.L. and D.S.K). We also would like to thank Prem Ponka (McGill University) for the gift of SIH.
Footnotes
Publisher's Disclaimer: This is a PDF file of an unedited manuscript that has been accepted for publication. As a service to our customers we are providing this early version of the manuscript. The manuscript will undergo copyediting, typesetting, and review of the resulting proof before it is published in its final citable form. Please note that during the production process errors may be discovered which could affect the content, and all legal disclaimers that apply to the journal pertain.
References
- 1.Pandeya SN, Sriram D, Nath G, DeClercq E. Eur J Pharm Sci. 1999;9:25. doi: 10.1016/s0928-0987(99)00038-x. [DOI] [PubMed] [Google Scholar]
- 2.Yu Y, Kalinowski DS, Kovacevic Z, Siafakas AR, Jansson PJ, Stefani C, Lovejoy DB, Sharpe PC, Bernhardt PV, Richardson DR. J Med Chem. 2009;52:5271. doi: 10.1021/jm900552r. [DOI] [PubMed] [Google Scholar]
- 3.Jansson PJ, Sharpe PC, Bernhardt PV, Richardson DR. J Med Chem. 2010;53:5759. doi: 10.1021/jm100561b. [DOI] [PubMed] [Google Scholar]
- 4.Kalinowski DS, Yu Y, Sharpe PC, Islam M, Liao YT, Lovejoy DB, Kumar N, Bernhardt PV, Richardson DR. J Med Chem. 2007;50:3716. doi: 10.1021/jm070445z. [DOI] [PubMed] [Google Scholar]
- 5.de Monye C, Karcher DS, Boelaert JR, Gordeuk VR. AIDS. 1999;13:375. doi: 10.1097/00002030-199902250-00010. [DOI] [PubMed] [Google Scholar]
- 6.Kontoghiorghes GJ, Weinberg ED. Blood Rev. 1995;9:33. doi: 10.1016/0268-960x(95)90038-1. [DOI] [PubMed] [Google Scholar]
- 7.Hoque M, Hanauske-Abel HM, Palumbo P, Saxena D, D'Alliessi Gandolfi D, Park MH, Pe'ery T, Mathews MB. Retrovirology. 2009;6:90. doi: 10.1186/1742-4690-6-90. [DOI] [PMC free article] [PubMed] [Google Scholar]
- 8.Georgiou NA, van der Bruggen T, Oudshoorn M, Nottet HS, Marx JJ, van Asbeck BS. J Infect Dis. 2000;181:484. doi: 10.1086/315223. [DOI] [PubMed] [Google Scholar]
- 9.Weinberg ED. J Eukaryot Microbiol. 1999;46:231. doi: 10.1111/j.1550-7408.1999.tb05119.x. [DOI] [PubMed] [Google Scholar]
- 10.Boelaert JR, Weinberg GA, Weinberg ED. Infect Agents Dis. 1996;5:36. [PubMed] [Google Scholar]
- 11.Weinberg GA, Friis H, Boelaert JR, Weinberg ED. Clin Infect Dis. 2001;33:2098. doi: 10.1086/324363. [DOI] [PubMed] [Google Scholar]
- 12.Lipinski P, Starzynski RR, Stys A, Stracilo M. Postepy Biochem. 2010;56:305. [PubMed] [Google Scholar]
- 13.van Asbeck BS, Georgiou NA, van der Bruggen T, Oudshoorn M, Nottet HS, Marx JJ. J Clin Virol. 2001;20:141. doi: 10.1016/s1386-6532(00)00122-0. [DOI] [PubMed] [Google Scholar]
- 14.Debebe Z, Ammosova T, Jerebtsova M, Kurantsin-Mills J, Niu X, Charles S, Richardson DR, Ray PE, Gordeuk VR, Nekhai S. Virology. 2007;367:324. doi: 10.1016/j.virol.2007.06.011. [DOI] [PMC free article] [PubMed] [Google Scholar]
- 15.Debebe Z, Ammosova T, Breuer D, Lovejoy D, Kalinowski D, Karla P, Kumar K, Jerebtsova M, Ray P, Kashanchi F, Gordeuk V, Richardson D, Nekhai S. Mol Pharmacol. 2010 doi: 10.1124/mol.110.069062. [DOI] [PMC free article] [PubMed] [Google Scholar]
- 16.Nekhai S, Jeang K-T. Future Microbiology. 2006;1:417. doi: 10.2217/17460913.1.4.417. [DOI] [PubMed] [Google Scholar]
- 17.Hamilton KO, Stallibrass L, Hassan I, Jin Y, Halleux C, Mackay M. Br J Haematol. 1994;86:851. doi: 10.1111/j.1365-2141.1994.tb04841.x. [DOI] [PubMed] [Google Scholar]
- 18.Di Gregorio F, Romeo MA, Pizzarelli G, Aiello G, Russo G. Br J Haematol. 1997;98:601. doi: 10.1046/j.1365-2141.1997.2553072.x. [DOI] [PubMed] [Google Scholar]
- 19.Cooper B, Bunn HF, Propper RD, Nathan DG, Rosenthal DS, Moloney WC. Am J Med. 1977;63:958. doi: 10.1016/0002-9343(77)90551-4. [DOI] [PubMed] [Google Scholar]
- 20.Galanello R, Piga A, Alberti D, Rouan MC, Bigler H, Sechaud R. J Clin Pharmacol. 2003;43:565. [PubMed] [Google Scholar]
- 21.Epsztejn S, Kakhlon O, Glickstein H, Breuer W, Cabantchik I. Anal Biochem. 1997;248:31. doi: 10.1006/abio.1997.2126. [DOI] [PubMed] [Google Scholar]
- 22.Zhou S, Feng X, Kestell P, Baguley BC, Paxton JW. J Chromatogr B Analyt Technol Biomed Life Sci. 2004;809:87. doi: 10.1016/j.jchromb.2004.06.009. [DOI] [PubMed] [Google Scholar]
- 23.Tang F, Borchardt RT. Pharm Res. 2002;19:787. doi: 10.1023/a:1016196514217. [DOI] [PubMed] [Google Scholar]
- 24.Stariat J, Kovarikova P, Klimes J, Lovejoy DB, Kalinowski DS, Richardson DR. J Chromatogr B Analyt Technol Biomed Life Sci. 2009;877:316. doi: 10.1016/j.jchromb.2008.11.044. [DOI] [PubMed] [Google Scholar]
- 25.Stariat J, Kovarikova P, Klimes J, Kalinowski DS, Richardson DR. Anal Bioanal Chem. 2010;397:161. doi: 10.1007/s00216-009-3448-7. [DOI] [PubMed] [Google Scholar]
- 26.ICH Harmonized Tripartite Guideline: Validation of Analytical Procedures: Text and Methodology Q2(R1) 2005;4:9. [Google Scholar]
- 27.Asseffa A, Dickson LA, Mohla S, Bremner TA. Oncol Res. 1993;5:11. [PubMed] [Google Scholar]
- 28.Simunek T, Boer C, Bouwman RA, Vlasblom R, Versteilen AM, Sterba M, Gersl V, Hrdina R, Ponka P, de Lange JJ, Paulus WJ, Musters RJ. J Mol Cell Cardiol. 2005;39:345. doi: 10.1016/j.yjmcc.2005.05.008. [DOI] [PubMed] [Google Scholar]
- 29.Kalinowski DS, Sharpe PC, Bernhardt PV, Richardson DR. J Med Chem. 2007;50:6212. doi: 10.1021/jm070839q. [DOI] [PubMed] [Google Scholar]
- 30.Toliyat T, Jorjani M, Khorasanirad Z. Drug Deliv. 2009;16:416. doi: 10.1080/10717540903141768. [DOI] [PubMed] [Google Scholar]
- 31.Bansal S, DeStefano A. AAPS J. 2007;9:E109. doi: 10.1208/aapsj0901011. [DOI] [PMC free article] [PubMed] [Google Scholar]
- 32.Debebe Z, Ammosova T, Breuer D, Lovejoy DB, Kalinowski DS, Karla PK, Kumar K, Jerebtsova M, Ray P, Kashanchi F, Gordeuk VR, Richardson DR, Nekhai S. Mol Pharmacol. 2011;79:185. doi: 10.1124/mol.110.069062. [DOI] [PMC free article] [PubMed] [Google Scholar]
- 33.Yamashita S, Furubayashi T, Kataoka M, Sakane T, Sezaki H, Tokuda H. Eur J Pharm Sci. 2000;10:195. doi: 10.1016/s0928-0987(00)00076-2. [DOI] [PubMed] [Google Scholar]
- 34.Huang XP, Spino M, Thiessen JJ. Pharm Res. 2006;23:280. doi: 10.1007/s11095-005-9258-5. [DOI] [PubMed] [Google Scholar]
- 35.Sun H, Pang KS. Drug Metab Dispos. 2008;36:102. doi: 10.1124/dmd.107.015321. [DOI] [PubMed] [Google Scholar]
Associated Data
This section collects any data citations, data availability statements, or supplementary materials included in this article.
Supplementary Materials
HPLC injections were made in quadruplicate using 20 µL of analyte and a run time of 15 min. Data are plotted as the ratio of the sum of the peak areas of the two isomers of the analyte to the peak area of Dp44mT (IS) versus the concentration (µM). Results are mean ± SD (3 determinations) in a typical experiment of three performed.