

Abstract
Fibroblastic reticular cells (FRCs) and lymphatic endothelial cells (LECs) are nonhematopoietic stromal cells of lymphoid organs. They influence the migration and homeostasis of naive T cells; however, their influence on activated T cells remains undescribed. Here we report that FRCs and LECs inhibited T cell proliferation through a tightly regulated mechanism dependent on nitric oxide synthase 2 (NOS2). Expression of NOS2 and production of nitric oxide paralleled the activation of T cells and required a tripartite synergism of interferon-γ, tumor necrosis factor and direct contact with activated T cells. Notably, in vivo expression of NOS2 by FRCs and LECs regulated the size of the activated T cell pool. Our study elucidates an as-yet-unrecognized role for the lymph node stromal niche in controlling T cell responses.
The structural framework of secondary lymphid organs maximizes the chance that lymphocytes encountering cognate antigen initiate adaptive immune responses. Fibroblastic reticular cells (FRCs), one of the main populations of nonhematopoietic stromal cells in lymph nodes1, secrete extracellular matrix components2 to form a dense reticular network and lymph-draining conduit system3. The T cell zone is delineated by FRCs and forms a scaffold to provide essential guidance cues to cells of the immune response4. FRCs orchestrate the migration of such cells via expression of the chemokine receptor CCR7 ligands CCL19 and CCL21, as well as adhesion molecules, integrins, glycoproteins and as-yet-undefined factors5. Beyond migration, FRCs maintain the homeostasis of naive T cells6, and they have the ability to impose antigen-specific deletional tolerance, with direct presentation of viral peptides7 and self peptides8–11 to naive CD8+ T cells. The timing of deletional events in such studies, whether the inevitable outcome of an FRC-mediated activation signal to naive T cells or the result of subsequent feedback to the FRC from the activated T cell, is unknown, as are its driving molecular mechanisms. Additionally, in the context of immune responses, T cells are usually activated by dendritic cells (DCs) while in direct contact with the FRC network; therefore, any effect of FRCs on activated T cells is highly relevant.
Lymphatic endothelial cells (LECs) are a second main population of stromal cells in lymph nodes found in many compartments6. These cells line lymphatic vessels and guide migrating leukocytes toward the lymph node. Activated T cells begin emigrating from lymph nodes through cortical sinuses and make their final exit via efferent lymphatics. In these cortical sinuses, LECs have been identified as the cellular source of sphingosine 1-phosphate, which is required for the egress of activated T cells from lymph nodes12,13. In interfollicular regions and the medulla, LECs can impose antigen-specific deletional tolerance through direct presentation of peripheral tissue antigens to naive CD8+ T cells8,11,14. Under steady-state conditions, LECs are sparse in the lymph node cortex, but this population can expand after immunization to support ongoing immune responses15. Although LECs come into direct contact with activated T cells at multiple locations in the lymph node, their influence on activated T cells is poorly understood.
The production of nitric oxide is catalyzed by nitric oxide synthase (NOS) proteins, which are encoded by three genes in humans and mice. Among these, inducible nitric oxide sythase (iNOS or NOS2) is expressed by various cell types such as macrophages, fibroblasts and endothelial cells16,17. Nitric oxide is a short-lived metabolic product that acts in close proximity in an autocrine or paracrine manner16. It functions in a wide range of processes, including proliferation, apoptosis, angiogenesis, host defense and regulation of vascular resistance16. Nitric oxide has been linked to the pathogenesis of various inflammatory and autoimmune diseases18–21. It can inhibit T cell antigen receptor–induced T cell proliferation and cytokine expression22 and affect the development of T helper type 1 cells22 and regulatory T cells (Treg cells)23. Given such broad biological effects, it is not unexpected that the production of nitric oxide is subject to transcriptional, translational and post-translational regulation24. The exact regulatory mechansims differ among cell types and are thought to govern the timing, magnitude and spatial distribution of the release of nitric oxide.
Here we report a previously unrecognized function of FRCs and LECs during T cell activation. Interferon-γ (IFN-γ) and tumor necrosis factor (TNF) released from activated T cells triggered the upregulation of NOS2 by lymph node stromal cells (LNSCs). Notably, the production of nitric oxide was strictly regulated and depended on close contact with activated T cells. LNSC-derived nitric oxide in turn diminished the proliferation of T cells in close proximity in vivo. These data show that FRCs and LECs in the T cell zone, where T cell activation takes place, have an inhibitory function during immune responses.
RESULTS
FRCs dampen the proliferation of activated T cells
To investigate the effect of lymph node stroma on newly activated T cells, we isolated FRCs and LECs from primary LNSC cultures (Fig. 1a). Through the use of a combination of antibodies to the surface markers CD45, CD31 (PECAM-1) and gp38 (podoplanin (PDPN), T1a or aggrus), FRCs (CD45−gp38+CD3−) and LECs (CD45−gp38+CD31+) can be readily distinguished from each other and from other cells in the lymph node suspension. We added those stromal cells to T cell assays in which DCs served as antigen-presenting cells. We cultured ovalbumin (OVA)-pulsed splenic DCs and OVA-specific transgenic (OT-I) CD8+ T cells for 72 h with or without LNSCs across a range of stromal cell/T cell ratios. The proliferation of OT-I T cells was significantly impaired in the presence of LNSCs at all dilutions relative to that of OT-I T cells activated in the absence of stromal cells (Fig. 1b,c). At a ratio of 1:1 (stromal cells:T cells), the proliferation of OT-I T cells was completely abrogated (Fig. 1b) and the abundance of CD25+ OT-I T cells was significantly lower (Fig. 1c). At a ratio of 1:5 or 1:10 (stromal cells:T cells), the normal increase in CD25+ cells after activation was not affected (Fig. 1c), which indicated that these cells had encountered complexes of cognate major histocompatibility complex (MHC) class I and peptide on the DCs. These results suggested that LNSCs potently suppressed T cell proliferation in response to a strong T cell antigen receptor signal provided by DCs.
Figure 1.
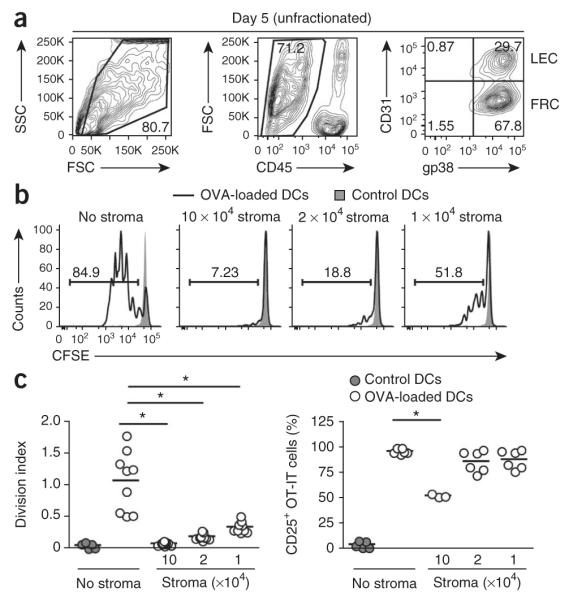
LNSCs inhibit DC-induced proliferation of CD8+ T cells. (a) Flow cytometry of LNSC populations expanded in culture for 5 d and stained with anti-CD45, anti-CD31 and anti-gp38. Numbers adjacent to outlined areas indicate percent cells in the gated population (outlined): live cells gated among total cells (left) or CD45− cells among live gated cells (middle); numbers in quadrants indicate percent cells in each throughout (right: live gated, CD45− cells). SSC side scatter; FSC, forward scatter. (b) Proliferation of CFSE-labeled OT-I T cells (1 × 10⁵; constant number) cultured with OVA-pulsed or unpulsed (control) splenic DCs (1 × 10⁵; constant number) without stromal cells (No stroma) or with the addition of various numbers of unfractionated LNSCs (1 × 10⁵, 2 × 10⁴ or 1 × 10⁴; to achieve a ratio of 1:1, 1:5 or 1:10, respectively, of stromal cells to OT-I T cells), assessed 72 h later by flow cytometry of CFSE dilution. Numbers above bracketed lines indicate percent CSFE+ cells. (c) Antigen-presentation assay of OT-I T cells cultured as in b, presented as division index (left) and frequency of CD25+ OT-I T cells (right). Each symbol represents an individual replicate; small horizontal lines indicate the mean. *P < 0.001 (Student’s t-test). Data represent three independent experiments with three replicates each (a,b) or are pooled from three independent experiments (c).
FRCs are the most abundant stromal cells in the lymph node cortex, where T cell activation occurs. Therefore, we initially chose this subset to further delineate the suppressive mechanism. We expanded and purified primary FRC populations in vitro (Fig. 2a and Supplementary Fig. 1a) and cultured them together at various ratios with splenocytes activated independently of DC-mediated antigen presentation via soluble antibody to CD3 (anti-CD3) and anti-CD28 (Fig. 2b–e). This experiment allowed us to determine whether suppression occurred via direct FRC–T cell crosstalk or required the presence of antigen-presenting cells. The proliferative responses of CD4+ T cells and CD8+ T cells were significantly lower in the presence of FRCs than were those of control cultures that lacked FRCs (Fig. 2b,c), whereas expression of the early activation markers CD25 and CD69 was unaffected (Fig. 2d,e). The provision of interleukin 2 (IL-2) did not reverse the suppression of CD4+ or CD8+ T cell proliferation (data not shown), which suggested that limited availability of IL-2 was not responsible for the impaired cell-cycle progression25. Furthermore, less lymphocyte proliferation was accompanied by only a slightly lower survival of CD8+ T cells, whereas the survival of CD4+ T cells was unaffected (Fig. 2f). Thus, the fewer T cell divisions observed in the presence of FRCs could not be explained by early apoptosis of T cells. The suppressive function of FRCs was not restricted to cell populations expanded in our primary culture system but also occurred with freshly isolated FRCs (Fig. 2g). These findings suggest that lymph node FRCs restrained T cell proliferation without substantially altering activation or survival.
Figure 2.

FRCs dampen the proliferation of activated T cells. (a) Frequency of CD45− cells after purification of stromal cultures expanded ex vivo (>99% CD45− cells; left), and surface expression of CD31 and gp38 on CD45− cells (>95% FRCs; right). Number adjacent to outlined area (left) indicates percent CD45− cells; numbers in quadrants (right) indicate percent of each stromal cell subset among CD45− cells. (b) Proliferation of CFSE-labeled splenocytes (1 × 10⁶) activated for 48 h in the presence (Act spl + FRC) or absence (Act spl alone) of FRCs (5 × 10⁴). (c) CFSE profiles of CD8+ or CD4+ T cells from cultures of nonactivated splenocytes without FRCs (Nonact spl) or activated splenocytes with or without FRCs (as in b). (d) Expression of CD25 and CD69 by activated T cells cultured as in c. (e) Frequency of CD25+ T cells among cells cultured as in c. (f) Frequency of T cells expressing activated caspase-3 and caspase-7 (FLICA+) among cells cultured as in b. (g) Proliferation of splenocytes cultured directly for 48 h with or without freshly isolated, sorted FRCs (4 × 10⁴) as in b. (h) Proliferation of purified CD4+ or CD8+ T cells (1 × 10⁵) activated for 48 h by plate-bound anti-CD3 and soluble anti-CD28 in the presence or absence of FRCs (5 × 10⁴). In b,e,f, each symbol represents an individual replicate (b) or well (e,f); small horizontal lines indicate the mean. *P < 0.001 and **P < 0.005 (Student’s t-test). Data are representative of two to three independent experiments with two to four replicates each (mean and s.d. in g,h).
To ascertain whether FRC-mediated suppression requires the involvement of an accessory cell, we did the assay with purified T cells rather than unfractionated splenocytes (Supplementary Fig. 1b). The degree of suppression by FRCs cultured alone with CD4+ or CD8+ T cells in the absence of accessory cells was similar to that of cocultures that included accessory cells such as DCs, B cells or macrophages (Fig. 2h). Having shown that FRCs directly suppressed CD8+ T cells in the absence of CD4+ T cells and that FRCs did not induce the population expansion of Foxp3+ CD4+ T cells (Treg cells; data not shown), we concluded that Treg cells did not contribute to the suppressive mechanism. Thus, FRCs directly suppressed both CD4+ T cells and CD8+ T cells without a contribution from Treg cells or other regulatory leukocytes.
IFN-γ signaling in FRCs is crucial for suppression
IFN-γ is an inflammatory cytokine secreted by activated T cells and natural killer cells26. Paradoxically, IFN-γ has also been linked to pathways that result in the dampening of T cell responses27,28. We hypothesized that IFN-γ secretion by activated T cells might switch on inhibitory pathways in FRCs that regulate the ensuing T cell response. Initially we determined whether IFN-γ was produced in the coculture system containing FRCs and splenocytes plus anti-CD3 and anti-CD28. Indeed, IFN-γ was abundantly produced in the coculture within 48 h and was produced mainly by T cells (Fig. 3a). Next we evaluated whether FRC-mediated suppression was dependent on IFN-γ. FRC-mediated suppression of CD4+ or CD8+ T cells was significantly attenuated when we used IFN-γ-deficient (Ifng−/−) splenocytes in the coculture (Fig. 3b,c). We also used Ifng−/− FRCs in the suppression assays to definitively rule out the possibility of a role for stroma-derived IFN-γ. As expected, Ifng−/− FRCs were as suppressive as their wild-type counterparts (Fig. 3b,c). These results suggested that the chief source of IFN-γ that incited the inhibitory potential of FRCs was T cells.
Figure 3.

IFNGR1 signaling in FRCs is crucial for suppression. (a) IFN-γ production by T cells (CFSE+CD4+CD8+) and non-T cells (CFSE+CD4−CD8−) among wild-type FRCs (5 × 10⁴) cultured with wild-type CFSE-labeled splenocytes (1 × 10⁶) and soluble anti-CD3 plus anti-CD28 and evaluated 48 h later by flow cytometry. Numbers in quadrants indicate percent cells in each. (b) Proliferation of CD4+ or CD8+ T cells among wild-type (WT), Ifng−/− or Ifngr1−/− FRCs (5 × 10⁴) cultured with wild-type or Ifng−/− CFSE-labeled splenocytes (1 × 10⁶) and soluble anti-CD3 plus anti-CD28 and evaluated 48 h later. Vertical dashed lines indicate final peak of the proliferation of activated splenocytes without FRCs. (c) Division of CD4+ or CD8+ T cells cultured as in b. (d) Proliferation of T cells among Ifngr1−/− CFSE-labeled splenocytes (1 × 10⁶) left nonactivated or activated with soluble anti-CD3 plus anti-CD28 and cultured for 48 h with or without wild-type FRCs (5 × 10⁴). (e) Division of CD4+ or CD8+ T cells cultured as in d. *P < 0.05, **P < 0.005 and ***P < 0.001 (Student’s t-test). Data are representative of two to three independent experiments with three to five replicates each (mean and s.d.).
To pinpoint the cell population targeted by IFN-γ in our experimental system, we did the suppression assay with various combinations of FRCs and T cells from mice deficient in the receptor for IFN-γ (Ifngr1−/− mice) or wild-type mice. When we cultured Ifngr1−/− splenocytes together with wild-type FRCs, T cell proliferation was markedly impaired (Fig. 3d,e), which suggested that IFN-γ did not directly affect the lymphocyte compartment. In contrast, when we cultured T cells with Ifngr1−/− FRCs, we observed no suppression (Fig. 3b,c). These results demonstrated that IFN-γ released from activated T cells acted directly on FRCs via IFNGR1 to elicit their immunosuppressive potential.
FRCs use NOS2 to regulate T cell proliferation
PD-L1 is a major coinhibitory molecule identified on stromal cells of lymphoid and nonlymphoid organs5,8,29,30. Consistent with published reports8,30, we found low expression of PD-L1 on FRCs under steady-state conditions (Supplementary Fig. 2a); it was upregulated after exposure to IFN-γ (Supplementary Fig. 2b). Likewise, surface expression of the PD-L1 receptor PD-1 was higher on T cells activated in the presence of FRCs (Supplementary Fig. 2a,b). Therefore, we sought to determine whether PD-L1 contributes to the immunosuppressive function of FRCs. Notably, CD4+ T cells were suppressed to an even greater extent when cultured with PD-L1-deficient FRCs than when cultured with wild-type FRCs (Supplementary Fig. 2c). CD8+ T cells were suppressed to the same extent by wild-type and PD-L1-deficient FRCs (Supplementary Fig. 2c).
IFN-γ can also upregulate molecules that impair T cell responses by interfering with metabolic pathways. Examples of such inhibitory molecules include indoleamine 2,3-dioxygenase 1 (IDO-1), arginase 1 (Arg1) and NOS2 (refs. 26,31). Indeed, the addition of recombinant IFN-γ caused considerable upregulation of Ido1 mRNA and, to an even greater extent, Nos2 mRNA (Fig. 4a). Arg1 mRNA expression remained unchanged (Fig. 4a). To determine whether these molecules are involved in the mechanism underlying the suppression of T cells by FRC, we included specific inhibitors of Arg1 (Nor-NOHA) and IDO (1-MT) and/or a competitive inhibitor of all NOS isoforms (L-NMMA) in the coculture assays. Neither the Arg1 inhibitor Nor-NOHA nor the IDO inhibitor 1-MT restored T cell proliferation to that in untreated control cultures (Fig. 4b), whereas the NOS2 inhibitor L-NMMA potently reversed the suppression of CD4+ T cell and CD8+ T cell proliferation imposed by FRCs (Fig. 4c).
Figure 4.

FRCs use NOS2 to regulate T cell proliferation. (a) Quantitative RT-PCR analysis of Arg1, Ido1 and Nos2 mRNA in FRC populations expanded ex vivo in the presence of recombinant IFN-γ (50 ng/ml); results are presented relative to those of untreated FRCs (0). (b,c) Proliferation of CD4+ T cells (b) or CD8+ T cells (c) among CFSE-labeled splenocytes (1 × 10⁶) activated with soluble anti-CD3 plus anti-CD28 and cultured for 48 h with or without FRCs (5 × 10⁴) in the presence or absence (Control) of the inhibitors Nor-NOHA (50 μM), 1-MT (5 nM) or L-NMMA (400 μM). (d) Nitric oxide in supernatants of wild-type or Nos2−/− CFSE-labeled splenocytes (1 × 10⁶) cultured for 48 h with or without wild-type or Nos2−/− FRCs (5 × 10⁴) in the presence of anti-CD3 plus anti-CD28. (e) Proliferation of CD4+ or CD8+ T cells among wild-type or Nos2−/− CFSE-labeled splenocytes (1 × 10⁶) cultured for 48 h with or without wild-type or Nos2−/− FRCs (5 × 10⁴). (f) Division of CD4+ or CD8+ T cells cultured as in e. *P < 0.05, **P < 0.005 and ***P < 0.001 (Student’s t-test). Data are representative of two to three independent experiments with three to five replicates each (mean and s.d.).
Although our results suggested that FRCs produce suppressive nitric oxide, it has also been reported that activated T cells can produce small amounts of nitric oxide32. Indeed, we detected relatively high concentrations of nitric oxide (~30 μM) in activated splenocytes cultured in the presence of FRCs but not in those cultured alone. When we cultured NOS2-deficient (Nos2−/−) FRCs with wild-type splenocytes, nitric oxide concentrations were 95% lower (Fig. 4d), which indicated that FRCs were the main source of nitric oxide.
Although most of the nitric oxide in the cocultures was derived from FRCs, it remained formally possible that a small amount of splenocyte-derived nitric oxide contributed to the suppression of T cells. To rule out this possibility, as well as the possibility of any off-target effect of the NOS chemical inhibitors, we cultured FRCs with splenocytes isolated from Nos2−/− mice. Consistent with the result of the experiments with the NOS inhibitors (Fig. 4b,c), the suppression of both CD4+ T cells and CD8+ T cells was abrogated by 80–100% in cultures with Nos2−/− FRCs (Fig. 4e,f). In contrast, NOS2 deficiency in the splenocyte compartment had no effect on T cell suppression (Fig. 4e,f). Collectively, these results demonstrated that FRCs used a NOS2-dependent mechanism to block cell-cycle progression among newly activated CD4+ or CD8+ T cells.
TNF and cell contact trigger NOS2 expression in FRCs
Stringent regulation of the production of nitric oxide is critical for avoiding tissue damage or cell death and at the same time for inducing other beneficial effects of this molecule. Nitric oxide was produced by FRCs in the presence of activated splenocytes but not in the presence of naive splenocytes (Fig. 4b and Supplementary Fig. 2f). As the inhibition of T cell proliferation was completely dependent on the expression of IFNGR1 by FRCs (Fig. 3b–d), we sought to determine whether IFN-γ itself was sufficient to induce the production of nitric oxide. Unexpectedly, the provision of recombinant IFN-γ did not result in measurable production of nitric oxide by FRCs (Fig. 5a) despite the production of 60-fold more Nos2 mRNA (Figs. 4a and 5b). However, recombinant IFN-γ triggered the production of nitric oxide when provided in combination with recombinant TNF (Fig. 5a). Indeed, we found more Nos2 mRNA and NOS2 protein in FRCs treated with IFN-γ plus TNF but did not observe the protein after treatment with either cytokine alone (Fig. 5b,c). Thus, TNF acted in synergy with IFN-γ to engage an active NOS2 pathway in FRCs (Fig. 5b,c).
Figure 5.

TNF and cell contact trigger NOS2 expression in FRCs. (a) Nitric oxide in supernatants of wild-type FRCs (5 × 10⁴) cultured for 48 h with or without (No stimuli) recombinant IFN-γ (50 ng/ml) or recombinant TNF (50 ng/ml). (b) Quantitative PCR analysis of Nos2 mRNA expression by wild-type FRCs (5 × 10⁴) incubated for 6, 24 or 48 h with recombinant IFN-γ (50 ng/ml) or recombinant TNF (50 ng/ml); results are presented relative to those of untreated FRCs. (c) Flow cytometry of NOS2 in Nos2−/− or wild-type FRCs left unstimulated or incubated for 48 h (+ stimuli) as in b (left three plots) or with splenocytes activated by soluble anti-CD3 plus anti-CD28 (far right). Numbers in plots indicate percent NOS2+ cells (top) or mean fluorescence intensity (MFI; in parentheses). (d) Proliferation of wild-type CFSE-labeled splenocytes (1 × 10⁶) left nonactivated or activated as in c and cultured for 48 h with or without wild-type FRCs or FRCs doubly deficient in TNFR1 and TNFR2 (Tnfrsf1a−/−Tnfrsf1b−/−; 5 × 10⁴). (e) Nitric oxide in supernatants of cultures as in d. (f) Proliferation of wild-type CFSE-labeled splenocytes (1 × 10⁶) activated as in d and cultured with or without wild-type FRCs (5 × 10⁴), with (+) or without (−) a Transwell insert (TW; pore size, 0.4 μm). (g) Division of T cells cultured as in f. *P < 0.001 (Student’s t-test). Data are representative of two to three independent experiments with two to four replicates each (mean and s.d.).
To assess whether TNF contributes to FRC-mediated suppression, we first examined expression of this cytokine and its receptors. Only a small proportion of FRCs produced TNF (Supplementary Fig. 3a), whereas we detected robust TNF expression in activated CD4+ T cells and CD8+ T cells during the coculture (Supplementary Fig. 3b–d). Additionally, we detected small amounts of two receptors for TNF (TNFR1 and TNFR2) on the surface of FRCs (Supplementary Fig. 3e) and neither treatment with recombinant IFN-γ nor coculture with activated splenocytes affected the surface expression of these receptors (Supplementary Fig. 3e). To assess whether TNF signaling in FRCs contributes to their immunosuppressive function, we compared FRCs from wild-type mice and mice doubly deficient in TNFR1 and TNFR2. Loss of TNF receptor signaling in FRCs partially attentuated their ability to suppress CD4+ T cells and CD8+ T cells (Fig. 5d) and resulted in 40% less production of nitric oxide (Fig. 5e). Collectively, these findings suggested that TNF signaling in FRCs potentiated the effect of IFN-γ to switch on a NOS2-dependent immunosuppressive pathway in FRCs.
In evaluating the protein abundance and enyzmatic activity of NOS2, we noted that this pathway was more active in FRCs cultured together with activated splenocytes than in cytokine-treated FRCs (Fig. 5c), which suggested that a third component may have been involved. Indeed, in Transwell assays, nitric oxide concentrations were 80% lower (Fig. 5f), which suggested a requirement for cell-cell contact for the production of nitric oxide. Consequently, the proliferation of CD8+ T cells was not inhibited and the proliferation of CD4+ T cells was only slightly lower in this setting (Fig. 5g). Thus, whereas NOS2-dependent suppression by FRCs required IFNGR1 signaling, multiple factors such as TNF and direct cell-cell contact acted synergistically to increase their inhibitory potential, which suggested a stringent, multiparametric regulation of the NOS2 pathway in the stromal niche.
LECs inhibit T cell proliferation via NOS2
In our initial studies we found that unfractionated cultures of FRCs and LECs showed a strong suppressive effect on the proliferation of OT-I T cells (Fig. 1b,c), which raised the possibility that not only FRCs but also LECs might have inhibitory potential. To investigate this possibility, we purified LECs from the cultures described above (Fig. 1a) and cultured them with splenocytes plus anti-CD3 and anti-CD28 (Fig. 6a). Indeed, the division of CD4+ T cells and CD8+ T cells was significantly impaired in the presence of LECs (Fig. 6a), which suggested active involvement of this stromal cell type in restraining T cell responses in lymph nodes.
Figure 6.

LECs inhibit T cell proliferation via NOS2. (a) Division of splenocytes (1 × 10⁶) activated for 48 h in the presence (LEC) or absence (No LEC) of LEC populations expanded ex vivo (4.5 × 10⁴ LECs). Each symbol represents an individual well; small horizontal lines indicate the mean. (b) CSFE dilution by wild-type or Ifng−/− splenocytes left nonactivated or activated with anti-CD3 plus anti-CD28 and cultured with or without wild-type LECs as in a. (c) Division of T cells in cultures as in b. (d) Nitric oxide in supernatants of wild-type or Nos2−/− splenocytes cultured for 48 h with or without wild-type or Nos2−/− LECs as in a. (e) CSFE dilution in T cells cultured as in d. (f) Division of T cells among cultures as in d. (g) Nitric oxide in supernatants of wild-type LECs (4.5 × 10⁴) incubated for 48 h with or without recombinant IFN-γ (50 ng/ml) and/or recombinant TNF (50 ng/ml). (h) NOS2 protein in Nos2−/− or wild-type LECs left unstimulated or incubated for 48 h as in g alone (left three plots) or with activated splenocytes (far right). Numbers in plots indicate percent NOS2+ cells. (i) Nitric oxide in supernatants of splenocytes cultured for 48 h with or without wild-type LECs as in a with or without a Transwell insert. (j) Division of T cells among cultures as in i. *P < 0.001 (Student’s t-test). Data are representative of two to three independent experiments with three replicates each (mean and s.d.).
To ascertain whether IFN-γ signaling was also involved in the LEC-imposed suppression of activated T cells, we cultured wild-type LECs with Ifng−/− splenocytes. Notably, the proliferation of CD4+ T cells and CD8+ T cells was completely restored (Fig. 6b,c), which raised the possibility that IFN-γ might activate the NOS2 pathway in LECs as it did in FRCs. This possibility was likely, as the cocultures of LECs and activated splenocytes had robust production of nitric oxide (Fig. 6d). When we cultured NOS2-deficient LECs with wild-type splenocytes, the proliferation of CD4+ T cells and CD8+ T cells was completely restored (Fig. 6e,f). Thus, IFN-γ signaling and NOS2 expression were essential to the immunosuppressive function of LECs.
Next we determined whether IFN-γ alone conferred the ability to produce nitric oxide by LECs or whether, as with FRCs, additional signaling was needed to impart this suppressive capacity. Treatment of LECs with recombinant IFN-γ alone did not result in NOS2 protein expression or the production of nitric oxide, whereas IFN-γ together with TNF resulted in detectable NOS2 protein and generation of nitric oxide (Fig. 6g,h). Notably, activated T cells produced TNF in this coculture setting (data not shown), which suggested that the combination of IFN-γ and TNF produced by activated T cells drove NOS2 expression and the production of nitric oxide by LECs. Furthermore, in a Transwell system, nitric oxide concentrations were lower (Fig. 6i) and T cell proliferation was restored (Fig. 6j). Together these results indicate that like FRCs, LECs used a tightly regulated NOS2-dependent mechanism to suppress T cell proliferation.
NOS2-mediated suppression operates in vivo
It has been shown that FRCs can present self antigen on MHC class I, which results in deletional CD8+ T cell tolerance8,9. Therefore, we sought to ascertain whether T cells activated by complexes of MHC class I and peptide on FRCs might also be subjected to NOS2-mediated regulation. For this, we cultured OT-I T cells together with splenic DCs or lymph node FRCs that had been pulsed with OVA peptide. As expected, DCs induced a robust proliferative response by OT-I cells, whereas FRCs triggered weaker T cell proliferation (Fig. 7a,b). Notably, nitric oxide was detectable in the FRC–T cell cocultures but not in the DC–T cell cocultures (Fig. 7c). Similar to results obtained in our experiments with bystander-activated T cells, the proliferation of OT-I T cells was significantly greater when Nos2−/− FRCs served as antigen-presenting cells than when wild-type FRCs did so (Fig. 7a,b).
Figure 7.

NOS2-mediated suppression operates in vivo. (a) Division of CFSE-labeled OT-I T cells (5 × 10⁵) cultured for 48 h with OVA peptide–loaded DCs or wild-type or Nos2−/− FRCs (5 × 10⁴). (b) CSFE dilution by T cells cultured alone (OT-I no stimuli) or as in a. (c) Nitric oxide in supernatants of cells cultured for 48 h as in a. (d) Survival of OT-I T cells in SLNs and MLNs collected from iFABP-tOVA and iFABP-tOVA Nos2−/− mice 72 h after injection of 1.5 × 10⁶ CFSE-labeled CD45.1+ congenic OT-I T cells; single-cell suspensions were stained for CD45.1 and CD8, and results are presented as percent among all living cells. (e) CFSE dilution by OT-I T cells obtained as in d. (f) Flow cytometry analysis of the number of OT-I T cells at division four (Gen 5) and division five (Gen 6) for cells obtained as in d; results are based on the CFSE dilution as in e. *P < 0.001 and **P < 0.05 (Student’s t-test). Data are representative of two to three independent experiments with three to four replicates in each (mean and s.d.).
To verify that nitric oxide–mediated control of T cell proliferation also operates in vivo, we took advantage of the iFABP-tOVA mouse model, in which a truncated form of OVA is expressed by intestinal epithelial cells and lymph node FRCs8,33. In this model, in skin-draining lymph nodes (SLNs), FRCs activate T cells via direct antigen presentation, and in the mesenteric lymph nodes (MLNs), FRCs activate T cells together with CD8+ DCs, which cross-present OVA derived from intestinal epithelial cells8,9. We compared the responses of OT-I T cells in wild-type and iFABP-tOVA Nos2−/− mice. At 72 h, when the donor OT-I T cells were responding to their cognate antigen in iFABP-tOVA lymph nodes, the frequency of T cells was greater in MLNs and SLNs of iFABP-tOVA Nos2−/− recipients than in those of wild-type control mice (Fig. 7d,e). Dilution of the cytosolic dye CSFE by OT-I T cells indicated that the CD8+ T cells divided faster in iFABP-tOVA Nos2−/− mice (Fig. 7e). That finding was supported by analysis of T cell numbers at individual division cycles, which showed more T cells at divisions five to six in iFABP-tOVA Nos2−/− mice than in wild-type control mice (Fig. 7e,f). Restimulation of OT-I T cells from wild-type and iFABP-tOVA Nos2−/− recipients showed slightly less IFN-γ production, whereas surface deposition of the lysosome marker LAMP-1 was unaffected (Supplementary Fig. 4a,b), which suggested that nitric oxide only mildly impaired T cell effector function.
Having shown that OT-I T cell populations expanded more efficiently in the lymph nodes of iFABP-tOVA Nos2−/− mice, we sought to identify the local source of NOS2. We isolated lymph nodes from iFABP-tOVA mice (either injected with OT-I T cells or left untreated) and froze them for cryosectioning and immunostaining. By confocal microscopy, NOS2 protein was readily detectable in SLNs and MLNs 2 d after T cell priming but not in lymph nodes of unprimed iFABP-tOVA mice (Fig. 8). We observed NOS2 expression in the cortex but not in B cell follicles (data not shown), which placed this mechanism at the main site of T cell activation. Costaining with antibodies to podoplanin (gp38) and PECAM-1 (CD31) indicated that NOS2 colocalized almost exclusively with FRCs and LECs (Fig. 8). Likewise, we found that lymph node macrophages and DCs were either completely devoid of Nos2 mRNA or expressed trace amounts independently of T cell activation (Supplementary Fig. 5a–d). In sum, these findings suggest that NOS2 protein is selectively (‘preferentially’) upregulated by LNSCs during T cell activation in response to encounters with self antigen and in turn restrict the proliferation of T cells in their microniche.
Figure 8.

NOS2 is expressed by FRCs and LECs in vivo. Microscopy of cryosections of SLNs (a) and MLNs (b) from iFABP-tOVA mice given no cells (iFABP-tOVA (no OT-I)) or 1.5 × 10⁶ CD45.1+ congenic OT-I T cells (iFABP-tOVA + OT-I), assessed 48 h later by staining for gp38, CD31 and NOS2. Bottom row (a), enlargement of area outlined in middle row, far left. Scale bars, 50 μm (top and middle rows) or 20 μm (bottom row, a). Data are representative of two independent experiments with two mice per group and two molds per organ.
In conclusion, these results have demonstrated that lymph node FRCs and LECs upregulated NOS2 in the presence of activated T cells and secreted immunosuppressive nitric oxide. This tightly regulated pathway seemed to be restricted to stromal determinants in lymph nodes and served to dampen the proliferation of an emerging T cell clone, thereby limiting the expansion phase in secondary lymphid organs. This regulatory circuit is a previously unknown role for the stromal niche beyond its structural support of secondary lymphoid organs and pinpoints its active involvement in ongoing immune responses.
DISCUSSION
Emerging evidence suggests that stromal determinants of secondary lymphoid organs have complex regulatory roles during immune responses1,5. Stromal cells express various peripheral tissue antigens and are involved in the maintenance of peripheral tolerance, mainly through the deletion of self-reactive T cells8–11,14,30. Moreover, the stromal microenviroment of MLNs creates a tolerogenic milieu during oral tolerance34. Here we have shown that FRCs and LECs mediated direct suppression in all lymph nodes, which provided evidence of a paracrine inhibitory effect of the stromal compartment in the T cell zone. Our results obtained with in vitro–expanded primary LNSC populations showed that IFN-γ derived from activated T cells was absolutely required for this suppressive mechanism. This finding also confirmed that bidirectional crosstalk exists between lymph node stroma and T cells, whereby the presence of the inflammatory mediators IFN-γ and TNF feeds back from T cells to FRCs and LECs, which in turn suppress further inflammation. T cell–derived IFN-γ induced NOS2 expression in stromal cells. Notably, the production of nitric oxide by both FRCs and LECs was tightly regulated and required a second signal provided by TNF and direct cell-cell contact with activated T cells. The release of nitric oxide by either stromal cell type caused much less proliferation of activated T cells in close proximity.
The inhibition of T cell proliferation by stromal cells of mesenchymal origin, including skin or synovial fibroblasts, as well as mesenchymal stem cells, has been reported in several studies28,35. A feature common to those reports is that early activation of T cells is unaffected but proliferation is much less, as seen in our study. Such data could be interpreted to suggest that a brake placed on T cell proliferation by stromal cells of mesenchymal origin might be a general accompanying event of T cell activation in vivo. However, major differences exist between the cell types mentioned above and LNSCs in terms of the effector molecule(s) that mediate(s) inhibition. The involvement of IDO-1 (ref. 36), NOS2 (ref. 37), prostaglandin E2 (ref. 38), transforming growth factor-β28 and IL-10 (ref. 28), among others, was indicated variously in those earlier reports. In many cases the exact mechanism was complex and remained at least partially unresolved. In our study here, whereas FRCs upregulated various inhibitory molecules, such as PD-L1, IDO-1 and NOS2, their effect on T cell proliferation was due entirely to NOS2. Similarly, the inhibitory effect of lymph node–derived LECs was completely attributable to their expression of NOS2. Although skin-derived LECs interact directly with DCs via the integrin ligand ICAM-1 and diminish their ability to stimulate T cell responses39, it is unknown whether skin-derived LECs demonstrate any direct effect on T cells, as we observed with lymph node–derived LECs.
PD-L1 has an important role in peripheral tolerance30 and supports the induction and maintenance of natural T cells40 reg . Moreover, engagement of PD-1 inhibits cell-cycle progression in several cell types41. Although we did not observe a direct effect of the PD-1–PD-L1 pathway in this study, it is notable that IFN-γ, as a proinflammatory cytokine, induced high PD-L1 expression by FRCs; this might suggest additional as-yet-unknown functions for FRCs.
Transcription is the principal mechanism by which NOS2 is induced in almost all cell types24. This induction involves the cooperative interaction of transcription factors and coregulatory molecules that bind to the Nos2 promoter24. NF-κB is a major activator of the Nos2 gene24. NF-κB acts in synergy with interferon-regulatory factor 1 to activate the Nos2 promoter in macrophages, endothelial cells and fibroblasts in response to IFN-γ and TNF42–44. In our study, IFN-γ induced Nos2 upregulation at the transcriptional level but did not itself induce the translation of NOS2 protein or production of nitric oxide. In fact, the production of nitric oxide by FRCs and LECs required additional factors such as TNF. Further studies are needed to determine the network of transcription factors involved in Nos2 transcription in FRCs and LECs. Myeloid-derived suppressor cells45 and mesenchymal stem cell clones37 can produce nitric oxide and inhibit T cell proliferation. Similar to the results obtained in those reports37,45, we found that the production of nitric oxide and the suppressive activity of FRCs and LECs was dependent on cell-cell contact with activated T cells. Although the molecules involved in cell-surface interactions between LNSCs and activated lymphocytes remain to be elucidated, the contact-dependent release of nitric oxide ensures a highly localized inhibitory effect on T cell proliferation, which emphasizes the importance of tightly regulated release of nitric oxide.
Among the many effects of nitric oxide, it has been reported that chemical donors of nitric oxide can differentiate activated CD4+ T cells into Foxp3+ Treg cells that suppress CD8+ T cells via IL-10 (ref. 23). In our experiments, CD4+ T cells and IL-10 were dispensable for the inhibitory effect of FRCs, and Foxp3+ cells were not greater in abundance. Whether FRCs can generate Treg cells under different conditions remains to be determined.
Nitric oxide modulates the biological function of various intracellular signaling proteins either by nitrosylation of critical cysteine or tyrosine residues or indirectly by activating guanylyl cyclase17. Furthermore, transient failure in signaling via the kinase Jak3 and transcription factor STAT5 in T cells cultured together with myeloid-derived suppressor cells expressing NOS2 results in less activation of the kinases Erk and Akt, which are important in the regulation of cell-cycle progression45. Further studies are needed to identify the exact downstream signaling molecules involved in mediating impaired T cell proliferation in the presence of LNSCs.
Given that the inhibitory function of FRCs and LECs required intimate contact with T cells, it is possible that these cells generate a microniche in the T cell zone that could conceivably both regulate the magnitude of the T cell–proliferative response and generate nitric oxide–induced Treg cells23, providing a counterbalance to an ongoing immune response. We have demonstrated that both FRCs and LECs in primed mice expressed NOS2 in the T cell zone and that the frequency of OT-I T cells was greater in iFABP-tOVA Nos2−/− mice. In contrast to the non-inflammatory setting evaluated in our study, it is possible that under conditions of considerable inflammation, NOS2-expressing myeloid cells may be recruited to or accumulate in lymph nodes and contribute to this regulatory mechanism. However, it remains to be elucidated whether the myeloid compartment elicits similar or distinct effects on T cell population expansion during inflammation. Additionally, Nos2−/− mice32,46 and Ifngr1−/− mice47 are known to have a larger memory T cell pool after antigenic stimulation. Likewise, we found that proliferation of memory T cells was greater in Nos2−/− mice (data not shown), which suggested that a NOS2-dependent mechanism restricts memory cell population expansion, similar to our results obtained with newly activated T cells. In addition, it is well established that self-limitation of T helper type 1 responses depends on IFN-γ48–50. Consequently, this may be a mechanism whereby LNSCs protect the organ from structural damage that would otherwise be induced after uncontrolled proliferation of naive and possibly memory T cells.
Here we have described previously unknown cross talk between activated T cells and FRCs or LECs that endows these stromal cells with the ability to constrain the proliferation of activated T cells through regulated nitric oxide release. Production of suppressive nitric oxide required IFNGR1 signaling in FRCs and LECs and was augmented by TNF and direct contact with activated T cells. This negative regulatory feedback mechanism is probably of great relevance to the regulation of immune responses either to prevent excessive T cell population expansion or to avoid structural damage in lymph nodes caused by the expanding T cell pool. This mechanism probably operates not just in lymph nodes but in all secondary lymphoid organs.
METHODS
Methods and any associated references are available in the online version of the paper at http://www.nature.com/natureimmunology/.
ONLINE METHODS
Mice
C57BL/6 mice 5–7 weeks of age were from Jackson Laboratory or Taconic. Nos2−/− mice were from Taconic; Ifngr1−/−, Ifng−/− and Tnfrsf1a−/− Tnfrsf1b−/− mice were from Jackson Laboratories. The iFABP-tOVA mice (line 232-4) were provided by L. Lefrancois, and OT-I T cell antigen receptor– transgenic mice expressing the congenic marker CD45.1 were bred at the Dana-Farber Cancer Institute. The iFABP-tOVA mice were backcrossed to Nos2−/− mice at the Dana-Farber Cancer Institute. All mice were on the C57BL/6J background and were maintained under specific pathogen–free conditions at the Dana-Farber Cancer Institute.
Antibodies and reagents
Cells were stained with the following antibodies: anti-CD8α (53-6.7), anti-CD4 (RM4-5), anti-CD25 (PC61.5), anti-CD69 (H1.2F3), anti-MAdCAM-1 (MECA-367), anti-EpCAM-1 (G8.8), anti-VCAM-1 (429MVCAM-1), anti-CD44 (IM7), anti-CD29 (HMβ1-1), anti-CD31 (MEC13.3), anti–MHC class I (28-8-6), anti-IFN-γ (XMG1.2), anti-TNF (MP6-XT22), anti-CD45 (30-F11) and anti-LAMP-1 (ID4B; all from BioLegend); anti-PD-L1 (MIH5; BD Biosciences); and anti-CD140a (APA5; eBioscience). The gp38 hybridoma (8.1.1) was produced ‘in-house’ and was purified by affinity chromatography. Anti-NOS2 (M-19) was from Santa Cruz; Alexa Fluor 647– conjugated donkey anti-rabbit (A31573) and phalloidin–tetramethylrhodamine isothiocyanate (R415) were from Invitrogen. Functional-grade purified anti-CD3ε (145-2C11) was from BD Biosciences, and anti-CD28 (37.51) was from Biolegend. The following chemical inhibitors were used: 1-MT (1-methyl-d-tryptophan; Sigma), L-NMMA (NG-monomethyl-l-arginine; Calbiochem) and Nor-NOHA (N-hydroxy-nor-l-arginine; Calbiochem). Recombinant IFN-γ was from R&D Systems, and CFSE (5- (and -6) carboxyfluorescein diacetate, succinimidyl ester) was from Invitrogen. A FACSCalibur or FACSAria (BD Biosciences) was used for flow cytometry. Dead cells were excluded with Hoechst 33342 stain or 7-amino-actinomycin D (Invitrogen).
LNSC culture and purification of FRC populations expanded ex vivo
SLNs and MLNs were digested for 15 min at 37 °C with an enzyme mixture containing collagenase P (0.2 mg/ml; Roche), DNase I (0.1 mg/ml; Invitrogen) and dispase (0.8 mg/ml; Roche). Tissues were agitated, medium containing released cells was collected and the digestion mixture was replaced. This process proceeded for 50–60 min. Cells were collected in RPMI medium with 1% (vol/vol) FCS and 2 mM EDTA, then were filtered through 100-μm mesh. Cells were plated in six-well plates at a density of 20 × 106 cells per well in αMEM medium containing 1% (vol/vol) penicillin-streptomycin and 10%(vol/vol) FBS (Hyclone). Then, 24 h later, nonadherent cells were removed and cells were further cultured for 4 additional days. This culture contained up to 30% CD45+ hematopoietic cells, and the CD45− stromal cells were typically a mixture of FRCs (50–60%) and LECs (40–50%; Fig. 1). Cells were collected (0.1% (vol/vol) trypsin and 2 mM EDTA in PBS) and samples were depleted of CD45+ cells (with antibody 30-F11) and CD31+ cells (with antibody MEC13.3) by magentic-activated cell sorting with biotinylated antibodies (Biolegend), anti-biotin microbeads and LS separation columns (Miltenyi Biotech). LECs were isolated with biotinylated anti-CD140a (APA5) and anti-CD45 (30-F11; both from Biolegend). After purification, the stromal (CD45−) cell preparation contained less than 0.5% CD45+ cells. The purity of FRCs and LECs among total CD45− cells was typically greater than 95%.
Coculture of splenocytes and LNSCs
FRCs or LECs were purified from cultures at day 5 as described above. Cells (5 × 10⁴ or 4 × 10⁴) were plated and allowed to ‘rest’ overnight. The next day, CFSE-labeled splenocytes (1 × 10⁶) were added to the plates, together with anti-CD3 (0.25 μg/ml) and anti-CD28 (0.25 μg/ml), and cultures were analyzed 48 h later. For some experiments, a Transwell insert with a pore size of 0.4 μm was included (Corning Life Sciences). For stimulation with plate-bound anti-CD3, 96-well round-bottomed plates were coated for 2 h at 37 °C with anti-CD3 (10 μg/ml) and washed once with PBS. Then, 5 × 10⁴ FRCs and 1 × 10⁵ purified, CFSE-labeled CD4+ or CD8+ T cells were added at the same time to the wells in the presence of soluble anti-CD28 (0.25 μg/ml). Cultures were analyzed 48 or 72 h later. T cells were purified with a MACS LS25 column and a CD4+ and CD8+-T Cell Isolation Kit, Mouse, according to the manufacturer’s guidelines (Miltenyi).
Measurement of nitric oxide
Nitric oxide concentrations in coculture supernatants were calculated with the Griess Reagent System (Promega). Samples (50 μl) were added to the microtiter plates, followed by the addition of 50 μl of 1% (vol/vol) sulfanilamide and 50 μl of 0.1% (vol/vol) naphthylethylenedi-amine in 2.5% (vol/vol) H3PO4. After 15 min, absorbance was measured at 530 nm and compared with that of a standard curve of NaNO3.
Analysis of T cell proliferation in vivo
CFSE-labeled OT-I CD45.1+ T cells (1.5 × 10⁶) were transferred intravenously into C57BL/6, iFABP-tOVA or iFABP-tOVA Nos2−/− mice. After 72 h, SLNs and MLNs were collected and single-cell suspensions were prepared and stained for flow cytometry. For some experiments, cells were restimulated for 4 h with OVA peptide (1 μg/ml; amino acid sequence, SIINFEKL) with or without LAMP-1 or control immunoglobulin G. IFN-γ expression was assessed with a Cytofix/Cytoperm kit according to the manufacturer’s guidelines (BD Biosciences).
Immunofluorescence staining of frozen tissue sections
Lymph nodes were fixed for 4 h in 4% (vol/vol) paraformaldehyde in PBS, followed by overnight incubation at 4 °C in 0.1 M sodium phosphate buffer containing 30% (vol/ vol) sucrose. Tissues were ‘snap-frozen’ with a slurry of isopentane and liquid nitrogen. Cryosections 7 μm in thickness were air-dried and fixed with 2% (vol/vol) paraformaldehyde, followed by blocking for 2 h with PBS containing 3% (vol/vol) BSA. Samples were stained for 1 h with primary antibodies in 3% (vol/vol) BSA in PBS, then washed three times with 0.01% (vol/vol) Tween in PBS. The following primary antibodies were used: Alexa Fluor 488–labeled Armenian hamster anti–mouse gp38 (8.1.1; labeled with an Alexa Fluor 488 protein labeling kit from Invitrogen), biotinylated rat anti–mouse CD31 (MEC13.3) and unlabeled rabbit anti–mouse NOS2 (M-19). Sections were incubated for 30 min at 20 °C with Alexa Fluor 647–labeled secondary antibody to rabbit (Invitrogen) and streptavidin–Alexa Fluor 405 (Invitrogen). As a control, either an isotype-matched control antibody (rat immunoglobulin G2a, κ-chain; 400504; Biolegend) or a secondary reagent (rabbit immunoglobulin G; sc-2027; Santa Cruz) was used. Samples were imaged with an LSM 510 Zeiss laser-scanning confocal microscope.
Data analysis and statistics
Data were analyzed with FlowJo 8.8.6 software (TreeStar), including calculation of division indices. The division index shows the average number of divisions that a cell present in the starting population has undergone as follows: division index = proliferation index (average number of divisions) × percent dividing cells. Band intensities of DNA gels and confocal microscopy images were analyzed with ImageJ 1.41o (US National Institutes of Health). For statistical analysis, Prism 4 (GraphPad Software) was used. Data were compared with an unpaired two-tailed t-test, with 95% confidence intervals (Student’s t-test).
Additional methods
Information on intracellular staining of NOS2, sorting of various stromal and hematopoietic cell types, quantitative PCR analyses, apoptosis assays and in vitro antigen-presentation assays is available in the Supplementary Methods.
Supplementary Material
ACKNOWLEDGMENTS
We thank M. Curry for technical assistance at the Dana-Farber Cancer Institute Flow Cytometry Core Facility; A. Sharpe (Harvard Medical School) for PD-L1-deficient mice; L. Lefrancois (University of Connecticut) for iFABP-tOVA mice; L.-H. Ang, Y. Zheng and S.J. Hagen for technical assistance at the Imaging Microscopy Core of Beth Israel Deaconess Medical Center; and J. Astarita and A. Bellemare-Pelletier for critically reading the manuscript. Supported by the US National Institutes of Health (R01 DK074500 and P01 AI045757 to S.J.T.) and the Dana-Farber Cancer Institute (V.L.-K).
Footnotes
Note: Supplementary information is available on the Nature Immunology website.
AUTHOR CONTRIBUTIONS V.L.-K. designed and did most of the experiments, analyzed and interpreted data and wrote the manuscript; D.M. did individual experiments and discussed and interpreted results; A.L.F. edited the manuscript; A.L.F., S.E.A., K.G.E., P.T. and A.C. discussed and interpreted results and provided technical help for the experiments; and S.J.T. directed the study, analyzed and interpreted results and wrote the manuscript.
COMPETING FINANCIAL INTERESTS The authors declare no competing financial interests.
Reprints and permissions information is available online at http://www.nature.com/reprints/index.html.
References
- 1.Mueller SN, Ahmed R. Lymphoid stroma in the initiation and control of immune responses. Immunol. Rev. 2008;224:284–294. doi: 10.1111/j.1600-065X.2008.00657.x. [DOI] [PubMed] [Google Scholar]
- 2.Katakai T, Hara T, Sugai M, Gonda H, Shimizu A. Lymph node fibroblastic reticular cells construct the stromal reticulum via contact with lymphocytes. J. Exp. Med. 2004;200:783–795. doi: 10.1084/jem.20040254. [DOI] [PMC free article] [PubMed] [Google Scholar]
- 3.Gretz JE, Anderson AO, Shaw S. Cords, channels, corridors and conduits: critical architectural elements facilitating cell interactions in the lymph node cortex. Immunol. Rev. 1997;156:11–24. doi: 10.1111/j.1600-065x.1997.tb00955.x. [DOI] [PubMed] [Google Scholar]
- 4.Bajénoff M, et al. Stromal cell networks regulate lymphocyte entry, migration, and territoriality in lymph nodes. Immunity. 2006;25:989–1001. doi: 10.1016/j.immuni.2006.10.011. [DOI] [PMC free article] [PubMed] [Google Scholar]
- 5.Mueller SN, Germain RN. Stromal cell contributions to the homeostasis and functionality of the immune system. Nat. Rev. Immunol. 2009;9:618–629. doi: 10.1038/nri2588. [DOI] [PMC free article] [PubMed] [Google Scholar]
- 6.Link A, et al. Fibroblastic reticular cells in lymph nodes regulate the homeostasis of naive T cells. Nat. Immunol. 2007;8:1255–1265. doi: 10.1038/ni1513. [DOI] [PubMed] [Google Scholar]
- 7.Thomas S, Kolumam GA, Murali-Krishna K. Antigen presentation by nonhemopoietic cells amplifies clonal expansion of effector CD8 T cells in a pathogen-specific manner. J. Immunol. 2007;178:5802–5811. doi: 10.4049/jimmunol.178.9.5802. [DOI] [PubMed] [Google Scholar]
- 8.Fletcher AL, et al. Lymph node fibroblastic reticular cells directly present peripheral tissue antigen under steady-state and inflammatory conditions. J. Exp. Med. 2010;207:689–697. doi: 10.1084/jem.20092642. [DOI] [PMC free article] [PubMed] [Google Scholar]
- 9.Lee JW, et al. Peripheral antigen display by lymph node stroma promotes T cell tolerance to intestinal self. Nat. Immunol. 2007;8:181–190. doi: 10.1038/ni1427. [DOI] [PubMed] [Google Scholar]
- 10.Magnusson FC, et al. Direct presentation of antigen by lymph node stromal cells protects against CD8 T-cell-mediated intestinal autoimmunity. Gastroenterology. 2008;134:1028–1037. doi: 10.1053/j.gastro.2008.01.070. [DOI] [PubMed] [Google Scholar]
- 11.Nichols LA, et al. Deletional self-tolerance to a melanocyte/melanoma antigen derived from tyrosinase is mediated by a radio-resistant cell in peripheral and mesenteric lymph nodes. J. Immunol. 2007;179:993–1003. doi: 10.4049/jimmunol.179.2.993. [DOI] [PubMed] [Google Scholar]
- 12.Grigorova IL, et al. Cortical sinus probing, S1P1-dependent entry and flow-based capture of egressing T cells. Nat. Immunol. 2009;10:58–65. doi: 10.1038/ni.1682. [DOI] [PMC free article] [PubMed] [Google Scholar]
- 13.Pham TH, et al. Lymphatic endothelial cell sphingosine kinase activity is required for lymphocyte egress and lymphatic patterning. J. Exp. Med. 2010;207:17–27. doi: 10.1084/jem.20091619. [DOI] [PMC free article] [PubMed] [Google Scholar]
- 14.Cohen JN, et al. Lymph node-resident lymphatic endothelial cells mediate peripheral tolerance via Aire-independent direct antigen presentation. J. Exp. Med. 2010;207:681–688. doi: 10.1084/jem.20092465. [DOI] [PMC free article] [PubMed] [Google Scholar]
- 15.Angeli V, et al. B cell-driven lymphangiogenesis in inflamed lymph nodes enhances dendritic cell mobilization. Immunity. 2006;24:203–215. doi: 10.1016/j.immuni.2006.01.003. [DOI] [PubMed] [Google Scholar]
- 16.Bogdan C. Nitric oxide and the immune response. Nat. Immunol. 2001;2:907–916. doi: 10.1038/ni1001-907. [DOI] [PubMed] [Google Scholar]
- 17.Krumenacker JS, Hanafy KA, Murad F. Regulation of nitric oxide and soluble guanylyl cyclase. Brain Res. Bull. 2004;62:505–515. doi: 10.1016/S0361-9230(03)00102-3. [DOI] [PubMed] [Google Scholar]
- 18.Barcellos LF, et al. Genetic variation in nitric oxide synthase 2A (NOS2A) and risk for multiple sclerosis. Genes Immun. 2008;9:493–500. doi: 10.1038/gene.2008.41. [DOI] [PMC free article] [PubMed] [Google Scholar]
- 19.Kato H, et al. Effect of NOS2 gene deficiency on the development of autoantibody mediated arthritis and subsequent articular cartilage degeneration. J. Rheumatol. 2003;30:247–255. [PubMed] [Google Scholar]
- 20.Kolios G, Valatas V, Ward SG. Nitric oxide in inflammatory bowel disease: a universal messenger in an unsolved puzzle. Immunology. 2004;113:427–437. doi: 10.1111/j.1365-2567.2004.01984.x. [DOI] [PMC free article] [PubMed] [Google Scholar]
- 21.Stuart PE, et al. Genome-wide association analysis identifies three psoriasis susceptibility loci. Nat. Genet. 2010;42:1000–1004. doi: 10.1038/ng.693. [DOI] [PMC free article] [PubMed] [Google Scholar]
- 22.Niedbala W, Cai B, Liew FY. Role of nitric oxide in the regulation of T cell functions. Ann. Rheum. Dis. 2006;65(suppl. 3):iii37–iii40. doi: 10.1136/ard.2006.058446. [DOI] [PMC free article] [PubMed] [Google Scholar]
- 23.Niedbala W, et al. Nitric oxide induces CD4+CD25+ Foxp3 regulatory T cells from CD4+CD25 T cells via p53, IL-2, and OX40. Proc. Natl. Acad. Sci. USA. 2007;104:15478–15483. doi: 10.1073/pnas.0703725104. [DOI] [PMC free article] [PubMed] [Google Scholar]
- 24.Nathan C, Xie QW. Regulation of biosynthesis of nitric oxide. J. Biol. Chem. 1994;269:13725–13728. [PubMed] [Google Scholar]
- 25.Duthoit CT, Mekala DJ, Alli RS, Geiger TL. Uncoupling of IL-2 signaling from cell cycle progression in naive CD4+ T cells by regulatory CD4+CD25+ T lymphocytes. J. Immunol. 2005;174:155–163. doi: 10.4049/jimmunol.174.1.155. [DOI] [PubMed] [Google Scholar]
- 26.Hu X, Ivashkiv LB. Cross-regulation of signaling pathways by interferon-γ: implications for immune responses and autoimmune diseases. Immunity. 2009;31:539–550. doi: 10.1016/j.immuni.2009.09.002. [DOI] [PMC free article] [PubMed] [Google Scholar]
- 27.Gabrilovich DI, Nagaraj S. Myeloid-derived suppressor cells as regulators of the immune system. Nat. Rev. Immunol. 2009;9:162–174. doi: 10.1038/nri2506. [DOI] [PMC free article] [PubMed] [Google Scholar]
- 28.Uccelli A, Moretta L, Pistoia V. Mesenchymal stem cells in health and disease. Nat. Rev. Immunol. 2008;8:726–736. doi: 10.1038/nri2395. [DOI] [PubMed] [Google Scholar]
- 29.Mueller SN, et al. Viral targeting of fibroblastic reticular cells contributes to immunosuppression and persistence during chronic infection. Proc. Natl. Acad. Sci. USA. 2007;104:15430–15435. doi: 10.1073/pnas.0702579104. [DOI] [PMC free article] [PubMed] [Google Scholar]
- 30.Reynoso ED, et al. Intestinal tolerance is converted to autoimmune enteritis upon PD-1 ligand blockade. J. Immunol. 2009;182:2102–2112. doi: 10.4049/jimmunol.0802769. [DOI] [PMC free article] [PubMed] [Google Scholar]
- 31.Grohmann U, Bronte V. Control of immune response by amino acid metabolism. Immunol. Rev. 2010;236:243–264. doi: 10.1111/j.1600-065X.2010.00915.x. [DOI] [PubMed] [Google Scholar]
- 32.Vig M, et al. Inducible nitric oxide synthase in T cells regulates T cell death and immune memory. J. Clin. Invest. 2004;113:1734–1742. doi: 10.1172/JCI20225. [DOI] [PMC free article] [PubMed] [Google Scholar]
- 33.Vezys V, Olson S, Lefrancois L. Expression of intestine-specific antigen reveals novel pathways of CD8 T cell tolerance induction. Immunity. 2000;12:505–514. doi: 10.1016/s1074-7613(00)80202-2. [DOI] [PubMed] [Google Scholar]
- 34.Buettner M, Pabst R, Bode U. Lymph node stromal cells strongly influence immune response suppression. Eur. J. Immunol. 2011;41:624–633. doi: 10.1002/eji.201040681. [DOI] [PubMed] [Google Scholar]
- 35.Jones S, Horwood N, Cope A, Dazzi F. The antiproliferative effect of mesenchymal stem cells is a fundamental property shared by all stromal cells. J. Immunol. 2007;179:2824–2831. doi: 10.4049/jimmunol.179.5.2824. [DOI] [PubMed] [Google Scholar]
- 36.Krampera M, et al. Role for interferon-γ in the immunomodulatory activity of human bone marrow mesenchymal stem cells. Stem Cells. 2006;24:386–398. doi: 10.1634/stemcells.2005-0008. [DOI] [PubMed] [Google Scholar]
- 37.Ren G, et al. Mesenchymal stem cell-mediated immunosuppression occurs via concerted action of chemokines and nitric oxide. Cell Stem Cell. 2008;2:141–150. doi: 10.1016/j.stem.2007.11.014. [DOI] [PubMed] [Google Scholar]
- 38.Aggarwal S, Pittenger MF. Human mesenchymal stem cells modulate allogeneic immune cell responses. Blood. 2005;105:1815–1822. doi: 10.1182/blood-2004-04-1559. [DOI] [PubMed] [Google Scholar]
- 39.Podgrabinska S, et al. Inflamed lymphatic endothelium suppresses dendritic cell maturation and function via Mac-1/ICAM-1-dependent mechanism. J. Immunol. 2009;183:1767–1779. doi: 10.4049/jimmunol.0802167. [DOI] [PMC free article] [PubMed] [Google Scholar]
- 40.Francisco LM, et al. PD-L1 regulates the development, maintenance, and function of induced regulatory T cells. J. Exp. Med. 2009;206:3015–3029. doi: 10.1084/jem.20090847. [DOI] [PMC free article] [PubMed] [Google Scholar]
- 41.English K, Barry FP, Field-Corbett CP, Mahon BP. IFN-γ and TNF-α differentially regulate immunomodulation by murine mesenchymal stem cells. Immunol. Lett. 2007;110:91–100. doi: 10.1016/j.imlet.2007.04.001. [DOI] [PubMed] [Google Scholar]
- 42.Kamijo R, et al. Requirement for transcription factor IRF-1 in NO synthase induction in macrophages. Science. 1994;263:1612–1615. doi: 10.1126/science.7510419. [DOI] [PubMed] [Google Scholar]
- 43.Saura M, Zaragoza C, Bao C, McMillan A, Lowenstein CJ. Interaction of interferon regulatory factor-1 and nuclear factor κB during activation of inducible nitric oxide synthase transcription. J. Mol. Biol. 1999;289:459–471. doi: 10.1006/jmbi.1999.2752. [DOI] [PubMed] [Google Scholar]
- 44.Farlik M, et al. Nonconventional initiation complex assembly by STAT and NF-κB transcription factors regulates nitric oxide synthase expression. Immunity. 2010;33:25–34. doi: 10.1016/j.immuni.2010.07.001. [DOI] [PMC free article] [PubMed] [Google Scholar]
- 45.Mazzoni A, et al. Myeloid suppressor lines inhibit T cell responses by an NO-dependent mechanism. J. Immunol. 2002;168:689–695. doi: 10.4049/jimmunol.168.2.689. [DOI] [PubMed] [Google Scholar]
- 46.Wei XQ, et al. Altered immune responses in mice lacking inducible nitric oxide synthase. Nature. 1995;375:408–411. doi: 10.1038/375408a0. [DOI] [PubMed] [Google Scholar]
- 47.Huang S, et al. Immune response in mice that lack the interferon-γ receptor. Science. 1993;259:1742–1745. doi: 10.1126/science.8456301. [DOI] [PubMed] [Google Scholar]
- 48.Badovinac VP, Tvinnereim AR, Harty JT. Regulation of antigen-specific CD8+ T cell homeostasis by perforin and interferon-γ. Science. 2000;290:1354–1358. doi: 10.1126/science.290.5495.1354. [DOI] [PubMed] [Google Scholar]
- 49.Feuerer M, Eulenburg K, Loddenkemper C, Hamann A, Huehn J. Self-limitation of Th1-mediated inflammation by IFN-γ. J. Immunol. 2006;176:2857–2863. doi: 10.4049/jimmunol.176.5.2857. [DOI] [PubMed] [Google Scholar]
- 50.Kahn DA, Archer DC, Gold DP, Kelly CJ. Adjuvant immunotherapy is dependent on inducible nitric oxide synthase. J. Exp. Med. 2001;193:1261–1268. doi: 10.1084/jem.193.11.1261. [DOI] [PMC free article] [PubMed] [Google Scholar]
Associated Data
This section collects any data citations, data availability statements, or supplementary materials included in this article.