Abstract
Adipose tissue macrophages are important mediators of inflammation and insulin resistance in obesity. IFN-γ is a central regulator of macrophage function. The role of IFN-γ in regulating systemic inflammation and insulin resistance in obesity is unknown. We studied obese IFN-γ knockout mice to identify the role of IFN-γ in regulating inflammation and insulin sensitivity in obesity. IFN-γ-knockout C57Bl/6 mice and wild-type control litter mates were maintained on normal chow or a high fat diet for 13 weeks and then underwent insulin sensitivity testing then sacrifice and tissue collection. Flow cytometry, intracellular cytokine staining, and QRTPCR were used to define tissue lymphocyte phenotype and cytokine expression profiles. Adipocyte size was determined from whole adipose tissue explants examined under immunofluorescence microscopy. Diet-induced obesity induced systemic inflammation and insulin resistance, along with a pan-leukocyte adipose tissue infiltrate that includes macrophages, T-cells, and NK cells. Obese IFN-γ-knockout animals, compared with obese wild-type control animals, demonstrate modest improvements in insulin sensitivity, decreased adipocyte size, and an M2-shift in ATM phenotype and cytokine expression. These data suggest a role for IFN-γ in the regulation of inflammation and glucose homeostasis in obesity though multiple potential mechanisms, including effects on adipogenesis, cytokine expression, and macrophage phenotype.
1. Introduction
Obesity-related inflammation is based in adipose tissue but is a systemic phenomenon that underlies insulin resistance and diabetes. While adipose tissue macrophage (ATM) is a key mediator of inflammation and insulin resistance in obesity [1,2], other lymphocyte subsets have been implicated, including T-cells and NK cells [3-8]. IFN-γ is a primary product of T-cells and NK cells and regulates macrophage phenotype in multiple models [9-12] but only limited prior data implicate IFN-γ in metabolic disease [13-16]. Prior research from our group demonstrates a role for IFN-γ in regulating ATM function and insulin resistance in obesity, including inducing an inflammatory M1-cytokine expression profile in ATM [5]. Two prior reports study IFN-γ knockout mice and demonstrate modest increases in insulin sensitivity [17,18]. The goal of this study was to expand on this prior work and determine the effects of IFN-γ-knockout (KO) on systemic inflammation and ATM phenotype and function in a murine model of obesity. We hypothesized that IFN-γ-KO would increase insulin sensitivity and attenuate inflammation in murine obesity. We demonstrate that IFN-γ-KO is associated with modest improvement in systemic insulin sensitivity, decreased tissue cytokine expression, alterations in tissue macrophage, T cell, and NK cell frequencies, and reduced adipocyte size. These data suggest a role for IFN-γ in regulating systemic inflammation and insulin resistance in obesity.
2. Materials and methods
2.1. Animal care, tissue, insulin sensitivity testing
Research was conducted in accordance with the National Institutes of Health Guide for the Care and Use of Laboratory Animals and approved by the Oregon Health & Science University Animal Care and Use Committee. Five-week old wild-type or IFN-γ-KO male C57Bl6/J littermate mice from Jackson Laboratory (Jackson Laboratory, Bar Harbor, ME) were housed 3–5/cage at 21°C with ad libitum access to water. Mice were maintained on a high-fat diet (HFD, 60% fat calories, 32% saturated fat, 36% monounsaturated fat, and 32% polyunsaturated fat, Cat # D12492, Research Diets, New Brunswick, NJ) or normal chow (13% fat calories, LabDiet 5001, Purina Mills, St. Louis, MO) for 13 weeks. Insulin sensitivity testing was performed at week 12, followed by sacrifice and tissues harvest at week 13. The experiment was repeated once for mice on high-fat diet: initial cohorts of 10 obese WT and 10 obese KO mice were studied, followed by a second set of cohorts of 8 obese WT and 10 obese KO mice. Results were similar between obese groups and combined from the entire group of 20 obese KO and 18 obese WT animals. For mice on normal chow, a single WT cohort (n=10) and a single KO cohort (n=10) were studied. Fasting morning serum was harvested at the end of study for analysis of serum cytokine and insulin levels with ELISA. For insulin sensitivity testing, after a 15 h fast, mice were injected intraperitoneally with 0.75 U insulin/kg, then tail vein blood was collected at intervals and blood glucose was measured using a Precision Xtra glucometer (Abbott Laboratories, Bedford, MA). At sacrifice, liver, spleen, visceral adipose tissue (VAT, intra-abdominal epididymal fat pad), and subcutaneous adipose tissue (SAT, subcutaneous flank fat pad) were harvested, washed, and minced in PBS + 1% BSA for downstream assays.
2.2. Stromovascular cell (SVF) fraction preparation and cell culture
All reagents were certified to have endotoxin levels <0.030 EU/mL. Vessels were dissected free from adipose tissue which was digested with type II collagenase (175 U/mL in PBS + 2% BSA, Gibco, Carlsbad, CA) for 60 min at 37°C followed by centrifugation at 200g for 10 min. The stromovascular (SVF) cell pellet was retrieved, treated with ammonium chloride, washed, filtered, and used for subsequent analyses. SVF cells or splenocytes were cultured (106/mL) in RPMI + 10% fetal calf serum for 24 h then harvested and studied with QRTPCR, ELISA, or intracellular cytokine staining as described below. Recombinant murine IFN-γ (eBioscience, San Diego, CA) was used at 100 ng/mL.
2.3. QRTPCR
RNA was prepared from 10 mg of whole adipose tissue using an RNeasy lipid kit (Qiagen, Germantown, MD). Equal amounts of input RNA were used for all QRTPCR reactions. RNA was reverse-transcribed using random hexamer primers and treated with DNase. QRTPCR was performed using SYBR Green I reagent and transcript-specific primers for actin as an endogenous control. The 2−ddCT relative quantification method was used to calculate fold difference in transcript levels between samples. Amplification efficiencies for all primer pairs were verified to be equivalent over a range of template concentrations. QRTPCR was performed using an ABI7900 thermocycler (Applied Biosystems, Foster City, CA).
2.4. Primer sequences
Actin- FOR: ATGCTCCCCGGGCTGTAT; Actin-REV: CCTCGTCACCCACATAGGAG; IL-6-FOR-CTGCAAGAGACTTCCATCCAGTT; IL-6-REV: GAAGTAGGGAAGGCCGTGG; IL-10-FOR: AGCCGGGAAGACAATAACTGC; IL-10-REV: CTGCATTAAGGAGTCGGTTAG; CCL2-FOR: AGGTCCCTGTCATGCTTCTG; CCL2-REV: CGTTAACTGCATCTGGCTGA; TNF-FOR: CTGTAGCCCACGTCGTAGC; TNF-REV: TTGAGATCCATGCCGTTG.
2.5. Flow cytometry
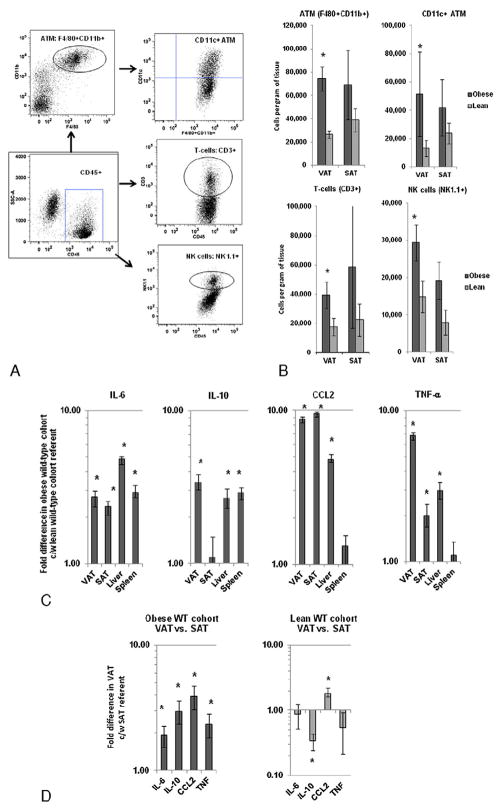
Cells were stained for 30 min in PBS with LIVE/DEAD Fixable Violet dye (Invitrogen, Carlsbad, CA), washed and incubated with appropriate surface antibodies: F4/80 -APC, CD11b-PE-CY7, CD11c-PE, CD3-PE-Cy7, NK1.1-PE, CD45-FITC (eBiosciences, San Diego, CA) for 30 min in flow buffer, PBS + .5% BSA + .1% sodium azide. Cells were further washed and fixed with Cytofix/Perm solution (BD Pharmingen, San Jose, CA) and analyzed on an LSRII flow cytometer (Becton, Dickinson, Franklin Lakes, NJ). Data were analyzed using FlowJo software (Tree Star, Ashland, OR) and compensated post-acquisition. Unstained cells and isotype controls were used to determine positive staining. All data were analyzed after exclusion of doublets and non-viable cells, and a large forward scatter and side scatter gate was used to encompass all SVF cells with subsequent analysis restricted to CD45+ cells. ATM and spleen tissue macrophages were defined as F4/80+ CD11b+ cells within the CD45+ population, and CD11c+ cell frequency was studied within the F4/80+CD11b+ tissue macrophage population (Fig. 2A). Absolute cells per gram of tissue for ATM and adipose tissue T-cells and NK cells were calculated by multiplying percent frequencies of the cell subset of interest by each successive parent population and by the total SVF cell yield per gram of tissue.
Fig. 2.
Inflammatory effects of obesity in WT mice: A: Flow cytometry gating strategy for ATM, T-cells, and NK cells within adipose tissue. After gating on CD45+ cells (square gate), ATM was defined as the F4/80+CD11b+ double-positive population (round gate), and CD11c+ cells were studied within the ATM population (right upper quadrant gate). CD3+ and NK1.1+ gates within the CD45+ gate defined T-cells and NK cells respectively (round gates). B: ATM (F4/80+CD11b+), inflammatory ATM (F480+CD11b+CD11c+), T-cell (CD3+), and NK cell (NK1.1+) numbers in adipose tissue based on flow cytometry. Ordinates are cells per gram of tissue; note different ordinate scales. Asterisk denotes P value<.050 derived from independent t test comparing data from obese WT and lean WT cohorts. C: Comparison of tissue cytokine transcript levels in obese WT mice relative to lean WT referent derived from QRTPCR. Ordinate is fold difference in transcript levels in obese WT mice relative to lean WT mice referents in log scale. Asterisk denotes P<.050 derived from independent t test comparing delta CT values. n=18 obese WT, n=10 lean WT animals for data in B and n=10 obese WT and n=10 lean WT animals for data in C. D: Comparison of adipose tissue cytokine transcript levels between VAT and SAT in obese and lean WT cohorts derived from QRTPCR. Ordinate is fold difference in transcript levels in VAT relative to SAT referents in log scale in obese and lean WT cohorts. Asterisk denotes P<.050 derived from paired t test comparing delta CT values. n=18 obese WT, n=10 lean WT animals for data in B and n=10 obese WT and n=10 lean WT animals for data in C, D.
2.6. Intracellular cytokine staining
SVF or splenocytes (one million cells/mL) were cultured for 2 h then Brefeldin A (Biolegend, San Diego, CA) was added and stimulation was continued for 16 h, after which cells were washed and stained with surface antibodies, followed by fixation/permeabilization and intracellular staining with antibody specific for TNF-α Pacific Blue (eBiosciences, San Diego, CA). Cells were washed, resuspended in flow buffer and data were acquired on an LSRII flow cytometer. Intracellular isotype control staining was used to determine positive staining.
2.7. ELISA
ELISA of cell culture supernatants and serum was performed using standard cytokine-specific ELISA kits (eBioscience, San Diego, CA) following manufacturer’s instructions. An insulin-specific ELISA kit was used to study serum insulin levels (Crystal Chem, Downers Grove, IL). Fasting morning serum was harvested at the time of sacrifice.
2.8. Adipocyte sizing
Minced whole adipose tissue explants were labeled with one microliter of 2.5 μmol/L C1-BODIPY 500/510 C12 (Invitrogen, Carlsbad, CA) for one hour, slide-mounted and visualized using an immunofluorescence Leica DM4000 B imaging system at 488 nM (Leica Microsystems, Wetzlar, Germany). Photographs were digitized using Leica Applications Suite 2.7.1 software. Diameters were measured on a minimum of 150 adipocytes per specimen using ImageJ software (Rasband, W.S., ImageJ, U.S. National Institutes of Health, Bethesda, MD, http://rsb.info.nih.gov/ij/, 1997-2009) by a blinded observer.
2.9. Statistical analysis
For weight and insulin sensitivity data, independent t test was applied to area under the curve. Delta CT values were compared for statistical analysis of QRTPCR data. Paired t test was used to compare flow cytometry, intracellular cytokine staining, QRTPCR, and ELISA data between paired VAT and SAT specimens within cohorts and between media and IFN-γ stimulated arms of in vitro cultures. Independent t test was used to compare flow cytometry, intracellular cytokine staining, QRTPCR, and ELISA data between KO and WT, and obese and lean cohorts. P values <.050 were considered significant. Error bars are standard error of the mean for all figures. Due to limitations in cell yields, not all animals were utilized for all experiments. The numbers of animals utilized for each experiment are provided in the figure legends.
3. Results
3.1. Diet-induced obesity is associated with decreased insulin sensitivity and increased systemic inflammation, and an adipose tissue pan-leukocyte infiltrate in wild-type C57Bl/6 mice
We first set out to corroborate multiple prior data demonstrating systemic insulin resistance and inflammation in murine obesity. Obese WT mice, compared to lean WT mice, demonstrated increased body weight and adipocyte size and decreased systemic insulin sensitivity (Fig. 1), along with increased numbers of ATM, T-cells, and NK cells in adipose tissue and increased tissue transcript levels of inflammatory cytokines (Fig. 2A–C). Cytokine transcripts were increased in VAT relative to SAT in the obese WT cohort, while IL-10 1evels were decreased and CCL2 levels were increased in VAT relative to SAT in the lean WT cohort (Fig. 2D).
Fig. 1.
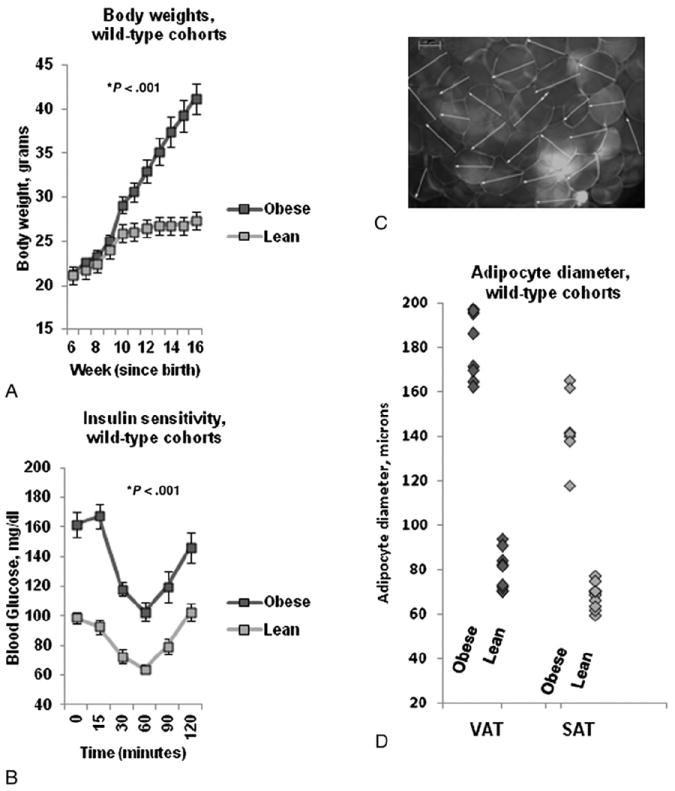
Metabolic effects of obesity in WT mice: A: Body weights in obese and lean WT animals. Ordinate is weight in grams, abscissa is weeks since birth. P value derived from independent t test comparing area under the curve for obese and lean WT animals. B: Insulin sensitivity curves. Ordinate is blood glucose, abscissa is time in minutes after intravenous insulin bolus. P value derived from independent t test comparing area under the curve for obese and lean WT animals. C: Representative photomicrograph of murine VAT explant under immunofluorescence microscopy after BODIPY-labeled fatty acid staining. Note 100 μm scale in left upper corner. D: Adipocyte diameters: Ordinate: adipocyte diameter in microns. P value compares adipocyte diameter between obese and lean cohorts using independent t test. n=18 obese WT and n=10 lean WT animals for data in A, B, and n=8 obese WT and n=10 lean WT animals for data in D.
3.2. Systemic inflammation and VAT adipocyte size are decreased and insulin sensitivity is increased in obese IFN-γ KO mice
We next compared these same metabolic and inflammatory metrics between obese WT and obese KO mice. No difference in body weights was observed between obese KO and obese WT mice at any point (Fig. 3A). Insulin sensitivity was modestly increased and adipocyte size was modestly decreased in obese KO mice (Fig. 3B, C). No difference in adipocyte size was observed between KO and WT mice in SAT (data not shown). Lean KO and WT mice demonstrated no difference in body weight or adipocyte diameter, but there was a trend towards improved insulin sensitivity in lean KO compared to lean WT mice (P=.068, data not shown).
Fig. 3.
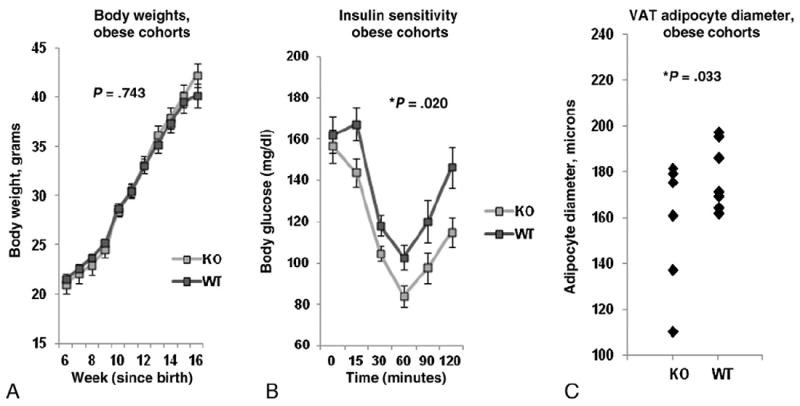
Metabolic effects of obesity in KO mice: A: Body weights in obese KO and obese WT animals. Ordinate is weight in grams, abscissa is weeks since birth. P value derived from independent t test comparing area under the curve for obese KO and obese WT animals. B: Insulin sensitivity test glucose excursion curves. Ordinate is blood glucose, abscissa is time in minutes after intravenous insulin bolus. P value derived from independent t test comparing area under the curve for obese KO and obese WT animals. C: Adipocyte diameters: Ordinate: adipocyte diameter in microns. P value compares adipocyte diameter between obese KO and obese WT cohorts using independent t test. n=20 obese KO, n=18 obese WT animals for data in A, B and n=7 obese KO, n=9 obese WT animals for data in C.
Transcript levels of IL-10, CCL2, and TNF-α, but not IL-6, were decreased in livers and spleens of obese KO mice compared to obese WT mice while no differences in these transcripts were observed in VAT or SAT (Fig. 4A). Lean KO mice, when compared to lean WT mice, demonstrated lower TNF-α transcript levels in the liver (0.58 fold, P=.040) and lower IL-10 transcripts in the liver and spleen (0.41 fold, P=.013, and 0.66 fold, P=.007, respectively). There were no significant differences between lean KO and lean WT cohorts in other transcript levels in other tissues. Comparison of cytokine transcript levels between VAT and SAT within the obese and lean KO cohorts revealed identical results as obese and lean WT cohorts as shown in Fig. 2D, with the exception that while TNF-α transcript levels were similarly increased in VAT relative to SAT in the obese KO cohort, this difference did not reach statistical significance (Fig. 4B).
Fig. 4.
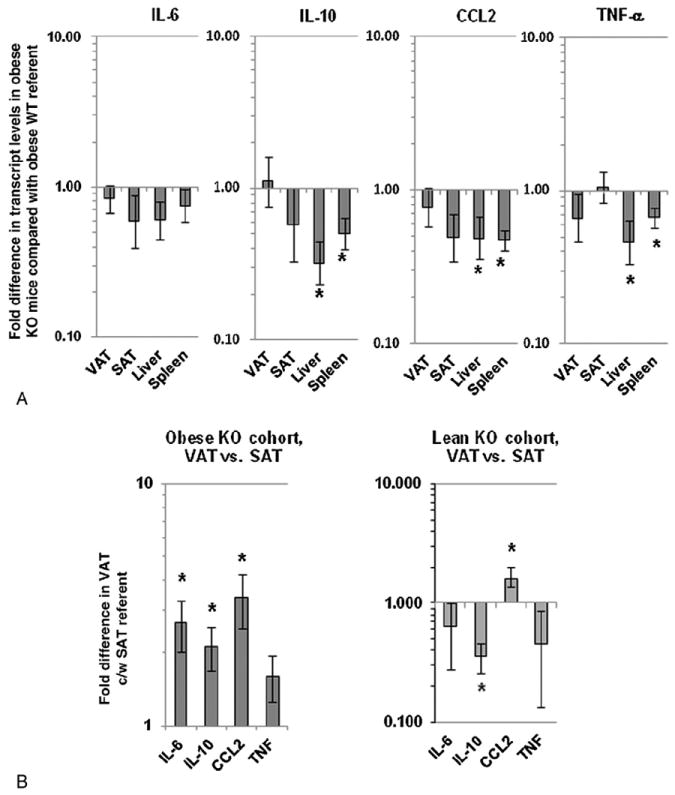
Tissue inflammatory cytokine transcript levels in KO mice: A: Comparison of tissue cytokine transcript levels in obese KO mice relative to obese WT referent. Ordinate is fold difference in transcript levels in obese KO mice relative to obese WT mice referents in log scale. Asterisk denotes P<.050 derived from independent t test comparing delta CT values between obese KO mice and obese WT mice. Similar data for comparison of lean KO and lean WT mouse cohorts is presented in text form in the results section. B: Comparison of adipose tissue cytokine transcript levels between VAT and SAT in obese and lean KO cohorts derived from QRTPCR. Ordinate is fold difference in transcript levels in VAT relative to SAT referents in log scale in obese and lean KO cohorts. For A, B, asterisk denotes P<.050 derived from independent (A) or paired (B) t test comparing delta CT values, and n=10 obese WT, n=10 lean WT, n=10 obese KO, and n=10 lean KO animals.
TNF-α, IL-10, and IL-6 were undetectable in sera of all mice based on ELISA (<1 pg/mL). Serum leptin levels were increased in obese compared to lean mice in both KO and WT cohorts (mean 29,254 pg/mL vs 4112 pg/mL for obese (KO + WT) and lean (KO + WT) mice respectively, P<.001). There were no significant differences in serum leptin levels between KO and WT mice in obese or lean cohorts.
3.3. SVF cytokine expression responses are altered in IFN-γ-KO mice
The lack of effect of IFN- γ-KO on inflammatory cytokine transcript levels in whole adipose tissue combined with only modest effects on insulin sensitivity and adipocyte size led us to hypothesize that the overall effects of IFN-γ-KO, while measurable and consistent, are subtle. To better study inflammation we focused on purified SVF, the dominant inflammatory component of adipose tissue. We studied in vitro TNF-α and IL-10 expression in VAT and SAT SVF in basal and IFN-γ-stimulated conditions. SVF from obese KO and obese WT mice demonstrated increased in vitro TNF-α expression levels and decreased IL-10 expression levels in response to stimulation with recombinant IFN-γ (Fig. 5). Furthermore basal and IFN-γ-stimulated TNF-α levels were similar between obese KO and obese WT mice, but mean basal and IFN-γ stimulated IL-10 levels were increased in SVF from obese KO mice compared to obese WT mice (Fig. 5, P values comparing KO and WT cohorts not displayed in figure, P<.050 for both basal and IFN-γ-stimulated conditions, independent t test). Similar responses and differences but of lower magnitude were observed in SAT SVF from obese KO and obese WT mice (data not shown).
Fig. 5.
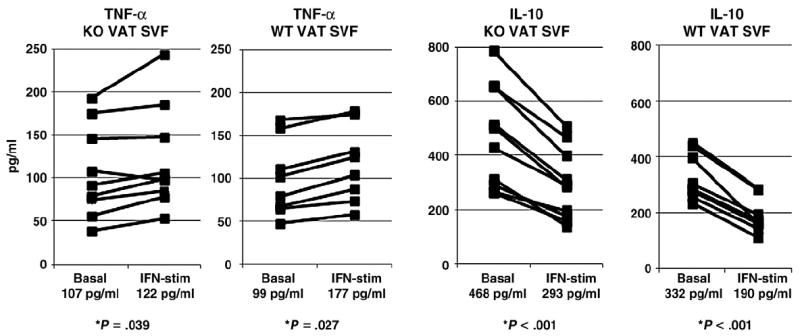
In vitro SVF cytokine expression responses in KO mice: ELISA of supernatants from VAT SVF cultured in media +/− recombinant IFN-γ for 24 h. Mean cytokine levels for each condition (basal and IFN-γ-stimulated) within each group (obese KO and obese WT) are reported under abscissa labels. Ordinates are pg/mL; note different ordinate scales. P values displayed are derived from comparison of basal and IFN-γ-stimulated arms for each cytokine within each animal cohort (obese KO and obese WT) using paired t test. No differences were observed inmean basal and IFN-γ-stimulated TNF-α levels in SVF between obese KO and obese WT, but IL-10 levels were significantly increased in both basal and IFN-γ-stimulated conditions in SVF from obese KO mice compared to SVF from obese WT mice (P<.050 in both cases, P value not shown in figure). n=8 obese WT, n=9 obese KO animals.
3.4. An M2-shift in ATM and decreased adipose tissue NK cells in IFN-γ-KO mice
In order to focus study on ATM within the SVF, we used intracellular cytokine staining. ATM from obese KO mice demonstrated reduced TNF-α-expression in ATM relative to obese WT mice (Fig. 6A, B). Since CD11c+ has been shown to designate an obesity-specific M1 inflammatory ATM subpopulation [1,19-21], we used flow cytometry to determine if IFN-γ-KO had an effect on total macrophage and CD11c+ macrophage subpopulation frequencies in VAT, SAT, and spleen. No differences in absolute ATM number were observed between obese KO and obese WT cohorts in VAT or SAT. However, the relative frequency of CD11c+ cells within the ATM population was decreased in obese KO compared to obese WT mice in VAT, SAT, and spleen (Fig. 6C). Based on flow cytometry, NK cells were decreased in number in VAT from obese KO mice compared to obese WT mice. No differences were observed in T-cell or NK cell numbers between obese KO and obese WT mice in SAT (Fig. 6D).
Fig. 6.
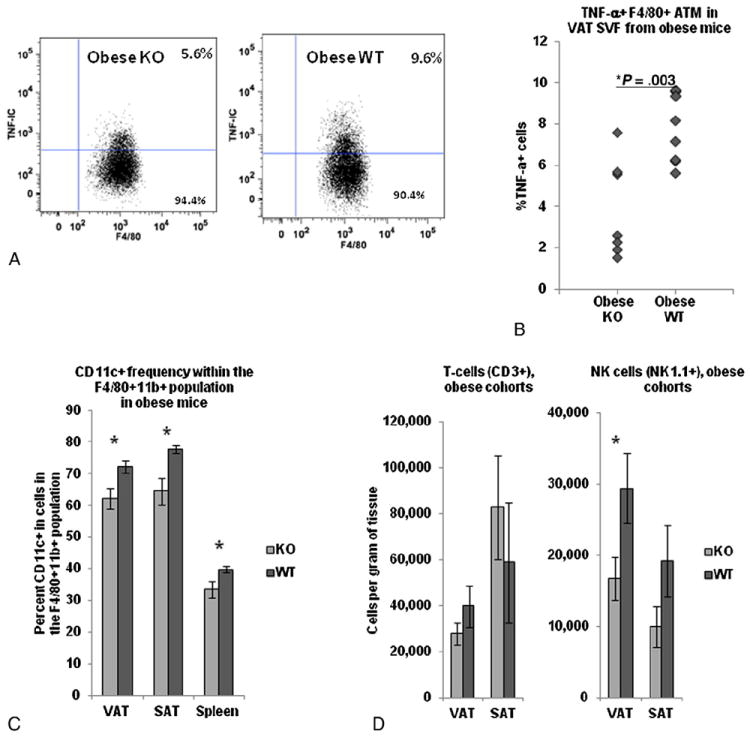
Adipose tissue macrophage inflammation and T-cell and NK cell numbers in obese KO and obese WT mice: A: Representative intracellular cytokine staining scatter plots of F4/80+ TNF-α- + cells within VAT SVF from obese KO and obese WT mice. B: Comparison of intracellular TNF-α expression between obese KO and obese WT mice in F4/80+ ATM within adipose tissue SVF using intracellular cytokine staining. Ordinate: percent of cells positive for intracellular TNF-α minus percent positive for intracellular isotype-matched control antibody. P value from independent t test comparing obese KO and obese WT cohorts. n=7 obese KO and n=8 obese WT animals. C: Frequencies of CD11c+ cells within the F4/80+CD11b+ gate in VAT, SAT, and spleen in obese KO and obese WT cohorts based on flow cytometry. P values from independent t test comparing KO and WT animals. n=14 obese KO, n=11 obese WT animals. D. T-cell (CD3+) and NK cell (NK1.1) numbers in adipose tissue in obese KO and obese WT mice. Ordinates are cells per gram of tissue—note different scales. P values from independent t test comparing obese KO and obese WT cohorts. n=10 obese WT, n=10 obese KO animals.
4. Discussion
4.1. Murine obesity is characterized by increased systemic inflammation and decreased insulin sensitivity and a pan-leukocyte infiltrate in adipose tissue
Obese WT mice, compared to lean WT mice, demonstrated decreased insulin sensitivity and increased tissue inflammation, adipocyte size, and adipose tissue macrophage, T-cell, and NK cell frequencies, consistent with multiple prior reports. These data add to a large body of literature demonstrating increased ATM in obesity, as well as an emerging body of literature implicating T-cells and NK cells in adipose tissue inflammation in obesity [3-8].
4.2. IFN-γ KO is associated with improved insulin sensitivity and decreased systemic inflammation
Obese KO mice demonstrated increased insulin sensitivity and decreased adipocyte size compared to obese WT mice despite similar body weights. Lean KO mice also demonstrated a trend towards improved insulin sensitivity as well as altered albeit qualitatively different inflammatory profiles compared to lean WT mice. These data suggest that IFN-γ regulates metabolism and inflammation independent of body weight.
TNF-α, IL-10, CCL2, and IL-6 have been implicated in adipose tissue inflammation [1,5,22-30]. Transcript levels of IL-10, CCL2, and TNF-α were decreased in the liver and spleen of obese IFN-γ KO mice compared with obese WT mice, consistent with an attenuation of systemic inflammation. IL-6 levels were not affected, suggesting that the IFN-γ is less involved in the regulation of this cytokine.
While reproducible and consistent, the effect of IFN-γ KO on insulin sensitivity was modest, a finding similar to two other published reports [13,14]. We hypothesize that the low magnitude of this effect is due to unknown developmental compensation in the germ-line KO model. Our data demonstrate a similarly modest effect of IFN-γ KO on inflammation. While the liver and spleen cytokine transcript levels were increased, consistent with a state of systemic inflammation, cytokine transcripts in RNA from whole adipose tissue were not. As the liver and spleen tissues are richer in leukocytes compared to adipose tissue, it is likely that the mild state of systemic inflammation induced by IFN-γ-KO would be detected in these tissues but not adipose tissue. Since study of whole adipose tissue RNA did not provide sufficient sensitivity to study the effects of IFN-KO on inflammation within adipose tissue, we shifted focus to study of SVF, within which we indeed demonstrated alterations in ATM phenotype and function.
4.3. IFN-γ regulates tissue inflammatory cytokine expression in SVF
ATM products TNF-α and IL-10 are central mediators of inflammation and insulin resistance in obesity with reciprocal effects on inflammation [1,5,22-26]. Our data confirm that IFN-γ regulates TNF-α and IL-10 expression in a reciprocal fashion in murine adipose tissue SVF, increasing TNF-α and inhibiting IL-10 expression, similar to previously published data in humans [4] and consistent with a pro-inflammatory effect of IFN-γ on cytokine balance.
Stimulation with IFN-γ increased in vitro TNF expression in SVF by only a modest amount, but decreased IL-10 expression to a greater degree. Similarly, basal and IFN-γ-stimulated TNF-α expression levels within SVF were not different between KO and WT animals, but IL-10 levels were increased in KO mice. Other published data demonstrate that ATM constitutively express elevated basal levels of inflammatory cytokines in basal unstimulated conditions, including TNF-α and IL-10 [27]. ATM may thus already be expressing near-maximal TNF-α levels in basal conditions and therefore resistant to further up-regulation by IFN-γ, while IFN-γ’s reciprocal effects on IL-10 would be more pronounced. Intracellular cytokine staining revealed decreased TNF-α expression in ATM from KO mice as well as decreased numbers of CD11c+ ATM, suggesting a shift away from an M1-ATM phenotype. Taken together, these data suggest that germline IFN-γ-KO modestly attenuates systemic inflammation and predisposes towards an M2-ATM environment within SVF. While further experiments will be necessary to causally link IFN-γ to insulin resistance via inflammatory pathways, these data suggest a possible mechanism for the improved insulin sensitivity observed in IFN-γ-KO animals.
4.4. IFN-γ KO is associated with alterations in adipose tissue NK cell frequencies
IFN-γ-KO had no effect on adipose tissue T-cell numbers but was associated with reduced adipose tissue NK cell numbers. T-cells and NK cells are likely sources of IFN-γ in adipose tissue, but limitations in tissue and cell yields prevented analysis of IFN-γ expression within adipose tissue. This is one of only a few reports to implicate adipose tissue NK cells in the pathogenesis of obesity-related adipose tissue inflammation [5,7,8], while also corroborating emerging data demonstrating an increase in adipose tissue T-cells in obesity [3,4]. Further research will therefore be necessary to confirm the source of adipose tissue IFN-γ in murine obesity. Our data nonetheless suggest a role for NK cells in adipose tissue inflammation in murine obesity and are consistent with published data from our group demonstrating that NK cells are important effectors of IFN-γ-mediated inflammation in human adipose tissue [5].
4.5. Limitations
Tissue and cell yields precluded thorough phenotypic or functional analysis of macrophage, NK cell, or T cell subpopulations, studies that will be pursued in future research. Similarly, the need to minimize animal stress precluded multiple metabolic tests such as glucose tolerance or insulin clamps. These data do not causally link the observed alterations in cytokine expression and leukocyte frequencies with insulin resistance. An important goal of future research will be to define the functional characteristics of the cell populations altered in IFN-γ-KO mice with respect to glucose homeostasis. Variability in leukocyte frequencies based on flow cytometry was observed despite statistically significant differences between obese and lean WT cohorts and KO and WT cohorts in specific leukocyte subpopulations. More detailed flow cytometry analysis studying a larger number of ATM, T-cell, and NK cell markers will be studied in future research as well. Specific dietary fatty acids may impact on insulin sensitivity. Nonetheless the same high fat chow was used for all animals, thus internally controlling for any putative effects of dietary constituents on insulin sensitivity. Future research will study the effects of specific dietary fatty acids and other dietary constituents on glucose homeostasis. The magnitudes of the effects of IFN-γ-KO on insulin sensitivity and inflammation were modest, as discussed above. Multiple variables in addition to IFN-γ regulate glucose homeostasis, and unidentified developmental compensation mechanisms in this germ-line transgenic model likely attenuate the effects of IFN-γ-KO in adult animals. These data nonetheless reveal subtle but reproducible effects of IFN-γ-KO on ATM phenotype and function, and thus provide a basis for future research that will study systemic neutralization of IFN-γ in wild-type obese animals as a means to modify ATM phenotype and ameliorate insulin resistance.
5. Conclusions
Few previous data study the role of IFN-γ in regulating inflammation and insulin resistance in obesity. We demonstrate that IFN-γ-KO has systemic effects on inflammation, insulin sensitivity, and adiposity, including a shift towards a less inflammatory tissue macrophage phenotype, reduced adipose tissue NK cell numbers, improved insulin sensitivity, and decreased adipocyte size. These data suggest a role for IFN-γ and NK cells in regulating inflammation and insulin resistance in obesity and suggest avenues for research directed towards developing therapy for metabolic disease.
Acknowledgments
Funding
This work was supported by an American Surgical Association Foundation Fellowship Award (RWO), National Institutes of Health grants K08 DK074397 (RWO) and R01 DK070333 (DLM), and an Oregon Clinical and Translational Research Institute (OCTRI) Summer Research Award, grant number UL1 RR024140 from the National Center for Research Resources (NCRR), a component of the National Institutes of Health (NIH), and NIH Roadmap for Medical Research (BRW).
Abbreviations
- ATM
Adipose tissue macrophage
- CD
Cluster differentiation
- HFD
High fat diet
- IFN
Interferon-gamma
- KO
Knockout
- QRTPCR
Quantitative real-time polymerase chain reaction
- SVF
Stromovascular cell fraction
- SAT
Subcutaneous adipose tissue
- VAT
Visceral adipose tissue
- WT
Wild-type
Footnotes
Author contributions: O’Rourke: study conception and design, study oversight and management, data analysis and interpretation, figure and manuscript preparation and primary manuscript writing/drafting. White, Metcalf, Winters, Zhu: data collection, data analysis.
Conflict of interest
Disclosure statement: The authors have no conflicts of interest to report.
References
- 1.Lumeng CN, Bodzin JL, Saltiel AR. Obesity induces a phenotypic switch in adipose tissue macrophage polarization. J Clin Invest. 2007;117:89–93. doi: 10.1172/JCI29881. [DOI] [PMC free article] [PubMed] [Google Scholar]
- 2.Cancello R, Henegar C, Viguerie N, Taleb S, Poitou C, Rouault C, et al. Reduction of macrophage infiltration and chemoattractant gene expression changes in white adipose tissue of morbidly obese subjects after surgery-induced weight loss. Diabetes. 2005;54:2277–86. doi: 10.2337/diabetes.54.8.2277. [DOI] [PubMed] [Google Scholar]
- 3.Feuerer M, Herrero L, Cipolletta D, Afia Naaz A, Wong J, Nayer A, et al. Lean, but not obese, fat is enriched for a unique population of regulatory T cells that affect metabolic parameters. Nat Med. 2009;15:930–9. doi: 10.1038/nm.2002. [DOI] [PMC free article] [PubMed] [Google Scholar]
- 4.Nishimura S, Manabe I, Nagasaki M, Eto K, Yamashita H, Ohsugi M, et al. CD8+ effector T cells contribute to macrophage recruitment and adipose tissue inflammation in obesity. Nat Med. 2009;15:914–20. doi: 10.1038/nm.1964. [DOI] [PubMed] [Google Scholar]
- 5.O’Rourke RW, Metcalf MD, White AE, Madala A, Winters BR, Maizlin II, et al. Depot-specific differences in inflammatory mediators and a role for NK cells and IFN-gamma in inflammation in human adipose tissue. Int J Obes (Lond) 2009;33:978–90. doi: 10.1038/ijo.2009.133. [DOI] [PMC free article] [PubMed] [Google Scholar]
- 6.Winer S, Chan Y, Paltser G, Truong D, Tsui H, Bahrami J, et al. Normalization of obesity-associated insulin resistance through immunotherapy. Nat Med. 2009;15:846–7. doi: 10.1038/nm.2001. [DOI] [PMC free article] [PubMed] [Google Scholar]
- 7.Duffaut C, Galitzky J, Lafontan M, Bouloumié A. Unexpected trafficking of immune cells within adipose tissue during the onset of obesity. Biochem Biophys Res Commun. 2009;384:482–5. doi: 10.1016/j.bbrc.2009.05.002. [DOI] [PubMed] [Google Scholar]
- 8.Caspar-Bauguil S, Cousin B, Galinier A, Segafredo C, Nibbelink M, André M, et al. Adipose tissues as an ancestral immune organ: site-specific change in obesity. FEBS Lett. 2005;579:3487–92. doi: 10.1016/j.febslet.2005.05.031. [DOI] [PubMed] [Google Scholar]
- 9.Fleetwood AJ, Lawrence T, Hamilton JA, Cook AD. GM-CSF and M-CSF-dependent macrophage phenotypes display differences in cytokine profiles and transcription factor activities: implications for CSF blockade in inflammation. J Immunol. 2007;178:5245–52. doi: 10.4049/jimmunol.178.8.5245. [DOI] [PubMed] [Google Scholar]
- 10.Ganguly D, Paul K, Bagchi J, Rakshit S, Mandal L, Bandyopadhyay G, et al. Granulocyte-macrophage colony-stimulating factor drives monocytes to CD14loCD83+ DCSIGN- interleukin-10-producing myeloid cells with differential effects on T-cell subsets. Immunology. 2007;121:499–507. doi: 10.1111/j.1365-2567.2007.02596.x. [DOI] [PMC free article] [PubMed] [Google Scholar]
- 11.Makino M, Maeda Y, Fukutomi Y, Mukai T. Contribution of GM-CSF on the enhancement of the T cell-stimulating activity of macrophages. Microbes Infect. 2009;9:70–7. doi: 10.1016/j.micinf.2006.10.011. [DOI] [PubMed] [Google Scholar]
- 12.Mantovani A, Sozzani S, Locati M, Allavena P, Sica A. Macrophage polarization: tumor-associated macrophages as a paradigm for polarized M2 mononuclear phagocytes. Trends Immunol. 2002;23:549–55. doi: 10.1016/s1471-4906(02)02302-5. [DOI] [PubMed] [Google Scholar]
- 13.Khazen W, Distel E, Collinet M, Chaves VE, M’Bika JP, Chany C, et al. Acute and selective inhibition of adipocyte glyceroneogenesis and cytosolic phosphoenolpyruvate carboxykinase by interferon gamma. Endocrinology. 2007;148:4007–14. doi: 10.1210/en.2006-1760. [DOI] [PubMed] [Google Scholar]
- 14.Memon RA, Feingold KR, Moser AH, Doerrler W, Grunfeld C. In vivo effects of interferon-alpha and interferon-gamma on lipolysis and ketogenesis. Endocrinology. 1992;131:1695–702. doi: 10.1210/endo.131.4.1396316. [DOI] [PubMed] [Google Scholar]
- 15.Pacifico L, Di Renzo L, Anania C, Osborn JF, Ippoliti F, Schiavo E, et al. Increased T-helper interferon-gamma-secreting cells in obese children. Eur J Endocrinol. 2006;154:691–7. doi: 10.1530/eje.1.02138. [DOI] [PubMed] [Google Scholar]
- 16.Waite KJ, Floyd ZE, Arbour-Reily P, Stephens JM. Interferon-gamma-induced regulation of peroxisome proliferator-activated receptor gamma and STATs in adipocytes. J Biol Chem. 2001;276:7062–8. doi: 10.1074/jbc.M007894200. [DOI] [PubMed] [Google Scholar]
- 17.Rocha VZ, Folco EJ, Sukhova G, Shimizu K, Gotsman I, Vernon AH, et al. Interferon-gamma, a Th1 cytokine, regulates fat inflammation: a role for adaptive immunity in obesity. Circ Res. 2008;103:467–76. doi: 10.1161/CIRCRESAHA.108.177105. [DOI] [PMC free article] [PubMed] [Google Scholar]
- 18.Wong N, Fam BC, Cempako GR, Steinberg GR, Walder K, Kay TW, et al. Deficiency in interferon-{gamma} results in reduced body weight and better glucose tolerance in mice. Endocrinology. 2011;152:3690–9. doi: 10.1210/en.2011-0288. [DOI] [PubMed] [Google Scholar]
- 19.Patsouris D, Li PP, Thapar D, Chapman J, Olefsky JM, Neels JG. Ablation of CD11c-positive cells normalizes insulin sensitivity in obese insulin resistant animals. Cell Metabolism. 2008;8:301–9. doi: 10.1016/j.cmet.2008.08.015. [DOI] [PMC free article] [PubMed] [Google Scholar]
- 20.Wu H, Perrard XD, Wang Q, Perrard JL, Polsani VR, Jones PH, et al. CD11c expression in adipose tissue and blood and its role in diet-induced obesity. Arterioscler Thromb Vasc Biol. 2009;30:186–92. doi: 10.1161/ATVBAHA.109.198044. [DOI] [PMC free article] [PubMed] [Google Scholar]
- 21.Nguyen MT, Favelyukis S, Nguyen AK, Reichart D, Scott PA, Jenn A, et al. A subpopulation of macrophages infiltrates hypertrophic adipose tissue and is activated by free fatty acids via Toll-like receptors 2 and 4 and JNK-dependent pathways. J Biol Chem. 2007;282:35279–92. doi: 10.1074/jbc.M706762200. [DOI] [PubMed] [Google Scholar]
- 22.Winkler G, Kiss S, Keszthelyi L, Sápi Z, Ory I, Salamon F, et al. Expression of tumor necrosis factor (TNF)-alpha protein in the subcutaneous and visceral adipose tissue in correlation with adipocyte cell volume, serum TNF-alpha, soluble serum TNF-receptor-2 concentrations and C-peptide level. Eur J Endocrinol. 2003;149:129–35. doi: 10.1530/eje.0.1490129. [DOI] [PubMed] [Google Scholar]
- 23.Esposito K, Pontillo A, Giugliano F, Giugliano G, Marfella R, Nicoletti G, et al. Association of low interleukin-10 levels with the metabolic syndrome in obese women. J Clin Endocrinol Metab. 2003;88:1055–8. doi: 10.1210/jc.2002-021437. [DOI] [PubMed] [Google Scholar]
- 24.Hotamisligil GS, Shargill NS, Spiegelman BM. Adipose expression of tumor necrosis factor-alpha: direct role in obesity-linked insulin resistance. Science. 1993;259:87–91. doi: 10.1126/science.7678183. [DOI] [PubMed] [Google Scholar]
- 25.Uysal KT, Wiesbrock SM, Marino MW, Hotamisligil GS. Protection from obesity-induced insulin resistance in mice lacking TNF-[alpha] function. Nature. 1997;389:610–4. doi: 10.1038/39335. [DOI] [PubMed] [Google Scholar]
- 26.Ventre J, Doebber T, Wu M, MacNaul K, Stevens K, Pasparakis M, et al. Targeted disruption of the tumor necrosis factor-alpha gene: metabolic consequences in obese and nonobese mice. Diabetes. 1997;46:1526–31. doi: 10.2337/diab.46.9.1526. [DOI] [PubMed] [Google Scholar]
- 27.Zeyda M, Farmer D, Todoric J, Aszmann O, Speiser M, Györi G, et al. Human adipose tissue macrophages are of an anti-inflammatory phenotype but capable of excessive pro-inflammatory mediator production. Int J Obes (Lond) 2007;31:1420–8. doi: 10.1038/sj.ijo.0803632. [DOI] [PubMed] [Google Scholar]
- 28.Eder K, Baffy N, Falus A, Fulop AK. The major inflammatory mediator interleukin-6 and obesity. Inflamm Res. 2009;58:727–36. doi: 10.1007/s00011-009-0060-4. [DOI] [PubMed] [Google Scholar]
- 29.Kamei N, Tobe K, Suzuki R, Ohsugi M, Watanabe T, Kubota N, et al. Over-expression of MCP-1 in adipose tissues causes macrophage recruitment and insulin resistance. J Biol Chem. 2006;281:26602–14. doi: 10.1074/jbc.M601284200. [DOI] [PubMed] [Google Scholar]
- 30.Weisberg SP, Hunter D, Huber R, Lemieux J, Slaymaker S, Vaddi K, et al. CCR2 modulates inflammatory and metabolic effects of high-fat feeding. J Clin Invest. 2005;116:115–24. doi: 10.1172/JCI24335. [DOI] [PMC free article] [PubMed] [Google Scholar]


