Abstract
Background
Celiac disease (CD) is an intestinal inflammatory condition that develops in genetically susceptible individuals after exposure to dietary wheat gliadin. The role of post-translational modifications of gliadin catalyzed by tissue transglutaminase (tTG) seems to play a crucial role in CD. However, it remains to be established how and where tTG is activated in vivo. We have investigated whether gliadin peptides modulate intracellular Ca2+ homeostasis and tTG activity.
Methods/Principal Findings
We studied Ca2+ homeostasis in Caco-2 cells by single cell microfluorimetry. Under our conditions, A-gliadin peptides 31–43 and 57–68 rapidly mobilized Ca2+ from intracellular stores. Specifically, peptide 31–43 mobilized Ca2+ from the endoplasmic reticulum (ER) and mitochondria, whereas peptide 57–68 mobilized Ca2+ only from mitochondria. We also found that gliadin peptide-induced Ca2+ mobilization activates the enzymatic function of intracellular tTG as revealed by in situ tTG activity using the tTG substrate pentylamine-biotin. Moreover, we demonstrate that peptide 31–43, but not peptide 57–68, induces an increase of tTG expression. Finally, we monitored the expression of glucose-regulated protein-78 and of CCAAT/enhancer binding protein-homologous protein, which are two biochemical markers of ER-stress, by real-time RT-PCR and western blot. We found that chronic administration of peptide 31–43, but not of peptide 57–68, induces the expression of both genes.
Conclusions
By inducing Ca2+ mobilization from the ER, peptide 31–43 could promote an ER-stress pathway that may be relevant in CD pathogenesis. Furthermore, peptides 31–43 and 57–68, by activating intracellular tTG, could alter inflammatory key regulators, and induce deamidation of immunogenic peptides and gliadin–tTG crosslinking in enterocytes and specialized antigen-presenting cells.
Introduction
Celiac disease (CD) is a complex inflammatory condition of the proximal small intestine caused by a specific response to peptides derived from ingested gliadin [1]. Immunotoxic gliadin peptides initiate a deleterious adaptive and innate immune response in the intestinal epithelium of CD patients. A-gliadin peptide 31-43/49 (p31–43) is the prototype of peptides that modulate the innate response [2], whereas peptide 57–68 (p57–68), which binds to HLA-DQ2/8 molecules, is one of the dominant epitopes recognized by T cells isolated from the intestine of CD patients [3]. However, the innate and adaptive immune systems may respond synergistically to gliadin peptides [1]. The role of post-translational modifications of gliadin peptides catalyzed by tissue transglutaminase (tTG) is thought to play a crucial role in CD [4], [5].
Tissue TG is a Ca2+-dependent enzyme that catalyzes the formation of isopeptide linkages between the γ-carboxamide group of protein-bound glutamine residues and the ε-amino group of protein-bound lysine residues [6]. Glutamine residues can be deamidated to glutamic acid as a side-reaction in the absence of suitable amines or at low pH. Furthermore, tTG also binds and GTP; hence the enzyme can function as a cell signal transducer in association with the α1β-adrenoreceptor [7]. Tissue TG is predominantly an intracellular protein localized in the cytosol, mitochondria, nucleus, and cell membrane compartments [6], but it is also secreted extracellularly even though it lacks a signal leader peptide. Recently, Zemskov et al. described secretion of tTG that involves phospholipid-dependent delivery into recycling endosomes [8].
Various functions have been ascribed to tTG in both the intra- and extracellular environment: in fact, it plays a role in matrix stabilization, cell adhesion and migration, and in cell death and survival [6], [9], [10]. The catalytic activity of tTG is implicated in the pathogenesis of several human diseases, including CD [10]. In celiac patients, tTG deamidates specific gliadin glutamines, thus generating a series of gliadin peptides that bind to HLA-DQ2 and DQ8 molecules with high affinity. The resulting HLA-DQ2 (DQ8)-gliadin peptide interaction triggers the proinflammatory T cell response [1]. Moreover, in accordance with the upregulation of tTG in intestinal inflamed sites, tTG may generate additional antigenic epitopes by cross-linking gliadin peptides to itself or to other cellular proteins. Gliadin-tTG complexes may elicit an immune response to tTG by stimulating normally silent autoreactive B-cells [11], [12]. In fact, active CD is associated with serum antibodies against tTG.
The exact location at which deamidation of immunogenic gliadin peptides and formation of gliadin–tTG complexes take place is not clear. Although little is known about the processing of gliadin peptides, there is evidence that they enter enterocytes [13], [14]. However, do tTG-induced gliadin modifications in CD patients occur in enterocytes and/or in other antigen-presenting cells, or in the extracellular matrix? It has been demonstrated that extracellular tTG is inactive in the intestinal mucosa in the resting state and it is only transiently activated after some inflammatory stimuli and tissue injury [15]. Moreover, under normal conditions, tTG in the intracellular environment is a latent protein due to a low Ca2+ concentration and inhibition by GTP/GDP. However, under extreme conditions of cell stress or trauma, and after disturbance or loss of Ca2+ homeostasis, tTG may be activated and cause cross-linking of intracellular proteins, as observed during apoptosis or necrosis [16], [17]. It has been reported that p31–43 causes increased production of reactive oxygen species, which leads to tTG overexpression and activation in intestinal epithelial cells; active tTG then induces ubiquitination and degradation of the peroxisome proliferator-activated receptor (PPAR)γ [18], thus contributing to the inflammatory response. Although Ca2+ is a prerequisite for activation of tTG, and for the production of reactive oxygen species, the role of this important cellular ionic mediator in the pathogenesis of CD remains unknown and unexplored.
We carried out the present study to determine the effect of gliadin peptides on Ca2+ homeostasis in the attempt to gain additional insights into the possible role exerted by gliadin peptides in the molecular mechanisms of tTG activation. Here we demonstrate that dietary wheat gliadin is able to regulate intracellular Ca2+ homeostasis. In fact, gliadin peptides rapidly mobilize Ca2+ ions from intracellular stores in a cell model of intestinal epithelial cells. However, p31–43 at a low concentration mobilizes calcium from the endoplasmic reticulum (ER), whereas both p31–43 and a higher concentration of p57–68 mobilize Ca2+ from mitochondria. We also show that Ca2+ ions released from intracellular stores as a consequence of gliadin peptide stimulation, are able to activate cytosolic and nuclear tTG. Finally, we found that p31–43, but not p57–68, increases the expression of tTG. It also increased the expression of glucose-regulated protein (GRP)-78 and of CCAAT/enhancer binding protein-homologous protein (CHOP) thereby implicating the ER-stress pathway in CD mucosal damage.
Methods
Peptides
Synthetic peptides were from Inbios (Naples, Italy). The sequences of p31–43 and p57–68 from A-gliadin were LGQQQPFPPQQPY and QLQPFPQPQLPY, respectively. In some experiments, we used N-terminal-biotin-labeled p31–43 and p57–68. Three synthetic peptide were used as irrelevant control peptides: QQPQDAVQPF from durum wheat (pCTR) [19]; PLIRPLLARPAK, which represents the 537–548 region of the human thyroid peroxidase (pHTP) [2]; LPQFEEIRNLALQTLPAM, which represents the C-terminal sequence of A-gliadin (p229–246) [20].
Cell Culture
Caco-2 cells were obtained from Interlab Cell Line Collection (Centro di Biotecnologie Avanzate, Genoa, Italy). Caco-2 cells were cultured in 100×10-mm Petri dishes containing Dulbecco’s modified Eagle’s medium supplemented with 10% (v/v) fetal bovine serum, 1% (v/v) non-essential amino acids, 0.2 mM L-glutamine, 50 units/ml penicillin and 50 µg/ml streptomycin (Invitrogen SRL, Milan, Italy). Cells were maintained at 37°C in a 5% CO2, 95% air-humidified atmosphere and passaged twice a week. Treatments were generally performed after 72–96 h after seeding.
Intracellular Ca2+ Concentration Measurement
Intracellular Ca2+ concentration ([Ca2+]i) was measured in Caco-2 cells by single cell computer-assisted videoimaging using the Ca2+ indicator Fura-2 acetoxymethyl ester, as previously described [21], [22]. Gliadin peptides were loaded at concentrations between 0.2 and 20 µg/ml for 30 min at 37°C in normal Krebs solution containing the following (in mM): 5.5 KCl, 160 NaCl, 1.2 MgCl2, 1.5 CaCl2, 10 glucose, and 10 Hepes-NaOH, pH 7.4. To selectively deplete intracellular Ca2+ stores, experiments were performed in the presence of thapsigargin (THP) (1 µM), an irreversible and selective inhibitor of the sarco(endo)plasmic reticulum Ca2+ ATPase, and in the presence of the mitochondrial uncoupler carbonylcyanide-p-trifluoromethoxyphenylhydrazone (FCCP) (300 nm).
In situ tTG Assay and Quantification of tTG Transamidating Activity
In situ tTG activity was visualized by using the tTG substrate pentylamine-biotin (Euroclone, Milan, Italy) as reported elsewhere [22]. Caco-2 cells were treated for 30 min with 10 µM ionomycin (Sigma-Aldrich, Milan, Italy), or with different amounts of gliadin peptides, or with 1 µM THP, in the presence of 0.5 mM pentylamine-biotin, before being processed for microscopy observation. To visualize biotin-labeled p31–43 and p57–68 in the cells, peptides needed to be used at a concentration of 0.2 mM. Tissue TG localization in permeabilized cells was revealed by incubating cells with the mouse anti-tTG antibody, clone CUB7402 (Bioptica, Milan, Italy), diluted 1∶200, and a secondary TRITC-conjugated antibody (1∶200). Pentylamine-biotin was also used to quantify the tTG transamidating activity by a microplate assay [22]. Briefly, after 30 min of treatment with 20 µg/ml gliadin peptides, or with 1 µM THP, cells were lysed and proteins (25 µg) were coated into the wells of a 96-well plate. The wells were blocked with 10% bovine serum albumin then incubated with 1∶5000 peroxidase-conjugated streptavidin (Euroclone) in 5% bovine serum albumin. To reveal peroxidase activity, 3,3′,5,5′-tetramethylbenzidine (Sigma-Aldrich, Milan, Italy) was added to each well and, after stopping the reaction with H2SO4, absorbances were read at 450 nm.
RNA Extraction and Real-time RT-PCR
Caco-2 cells were treated with different amounts of p31–43 or p57–68, or alternatively with 1 µM THP for 24 or 48 h. Total RNA was extracted with the Tri-Reagent (Sigma-Aldrich) according to the manufacturer’s instructions. The first-strand cDNA synthesis reaction was performed using the Maxima first-strand cDNA synthesis kit (Fermentas, Milan, Italy) and 1 µg total RNA. The cDNA was then used to amplify human tTG, GRP78, and CHOP transcripts with the following primers: tTG upper, TGCTGTGGAGGAGGGTGACT; tTG lower, ACCAGGCGTTGAAGAGCAAA; GRP78-upper, 5′-CTGGGTACATTTGATCTGACTGG-3′, GRP78-lower, 5′-GCATCCTGGTGGCTTTCCAGCCATTC-3′; CHOP-upper 5′-CTT GGC TGACTG AGG AGG AG-3′, CHOP-lower, 5′-TCA CCA TTC GGT CAATCA GA-3′. The concentration of mRNA was normalized to the concentration of GAPDH, which was obtained with the following primers: upper, 5′-TTCAACAGCGACACCCACTG-3′; lower, 5′- CACCCTGTTGCTGTAGCCA-3′. For PCR reactions cDNA samples were analyzed in triplicate with the iQ™ SYBR Green Supermix (Bio-Rad Laboratories, Milan, Italy) and using the iQ™ 5 Multicolor Real Time PCR Detection System (Bio-Rad Laboratories). PCR reactions were performed with 250 nM of each primer and 10 µl of SYBR Green Supermix, in a total volume of 20 µl. The PCR program started with 3 min of incubation at 95°C, followed by 40 cycles of 15 sec at 95°C, 15 sec at 60°C, and 20 sec at 72°C.
Western Blot Analyses
Caco-2 cells were incubated for 24 or 48 h with 20 µg/ml of p31–43 or p57–68 or, alternatively, with 1 µM THP. Cells were washed with phosphate-buffered saline solution and mechanically harvested in lysis buffer, consisting of 20 mM Tris-HCl, pH 7.5, 150 mM NaCl, 1 mM EDTA, 1 mM dithiotreitol, 0.1% sodium dodecyl sulphate, 1% triton X-100, 1 mM ortovanadate, and inhibitors cocktail (Sigma-Aldrich). After 30 min of incubation on ice, cell extracts were centrifuged at 12,000 g for 30 min at 4°C, to remove cell debris, then 75 µg of total proteins were separated by 10% sodium dodecyl sulphate-polyacrylamide gel electrophoresis and transferred to a membrane. To detect tTG, the blot was treated as described elsewhere [23]. To detect GRP78 and CHOP, the blots were treated with 5% skim milk in phosphate-buffered saline overnight at 4°C, then incubated for 2 h with an anti-GRP78 rabbit polyclonal antibody (H-129) (1∶500; Santa Cruz, CA, USA), or with an anti-CHOP mouse monoclonal antibody (1∶1,500; Santa Cruz), respectively, in phosphate-buffered saline containing 0.1% tween-20. After washing, the blots were incubated for 1 h at room temperature with an anti-rabbit-peroxidase secondary antibody (1∶10,000; Bio-Rad Laboratories), or with an anti-mouse-peroxidase secondary antibody (1∶10,000; Bio-Rad Laboratories), respectively. Immunocomplexes were revealed using a chemiluminescence detection kit (Euroclone) according to the manufacturer’s instructions.
Statistics
Data regarding Ca2+ measurements were expressed as mean ± SEM; statistical comparisons were performed using the one-way ANOVA, followed by Newman Keul’s test. Data regarding tTG transamidationg activity and tTG, GRP78, and CHOP expression were expressed as means ± SD; statistical analysis was performed by using the Student’s t test. In all experiments, differences were considered to be statistically significant at p<0.05.
Results
Gliadin Peptides 31–43 and 57–68 Increase Intracellular Ca2+ Concentrations in Caco-2 Cells
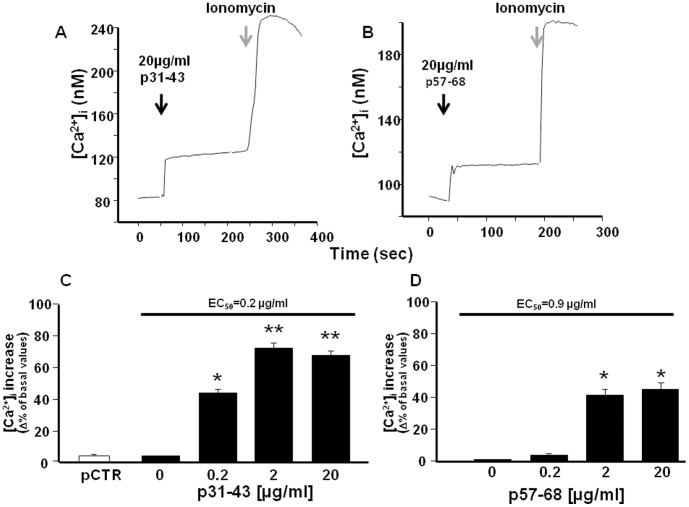
Using single-cell Fura-2 acetoxymethyl ester microfluorimetry, we first investigated whether p31–43 could alter the intracellular Ca2+ concentration ([Ca2+]i) of Caco-2 cells. At 20 µg/ml, p31–43 caused a rapid rise in [Ca2+]i when perfused in normal Krebs solution (Figure 1A). Similarly, also p57–68 (20 µg/ml) caused a rapid increase in [Ca2+]i when perfused in normal Krebs solution (Figure 1B). The effect of both peptides on [Ca2+]i was dose-dependent. However, p31–43 caused a higher [Ca2+]i increase than p57–68 (about 65% and 45%, respectively, with respect to the basal value) when tested at 20 µg/ml. At this concentration, pCTR did not affect [Ca2+]i. Interestingly, also at a low concentration, i.e. 0.2 µg/ml, p31–43 induced an increase in [Ca2+]i (45% of basal value), whereas at the same concentration, p57–68 was almost ineffective (Figure 1C and D). Consequently, the EC50 for p31–43 and p57–68 was 0.2 µg/ml and 0.9 µg/ml, respectively.
Figure 1. Effect of p31–43 and p57–68 on [Ca2+]i in Caco-2 cells.
(A) and (B) Single-cell traces representative of the effect of 20 µg/ml p31–43 and p57–68, respectively, on [Ca2+]i. Starting time of perfusion is indicated by the arrows. Ionomycin (1µM) was added as control (grey arrows) at the end of the experiment. (C) and (D) Dose-dependent effect of p31–43 and p57–68, respectively, on [Ca2+]i increase. PCTR (20 µg/ml) served as control. From 40–65 cells were monitored in each experiment. Each bar represents the mean ± SEM of data obtained in three independent experimental sessions. *p<0.05 versus its respective control (basal values); **p<0.05 versus previous concentrations and control.
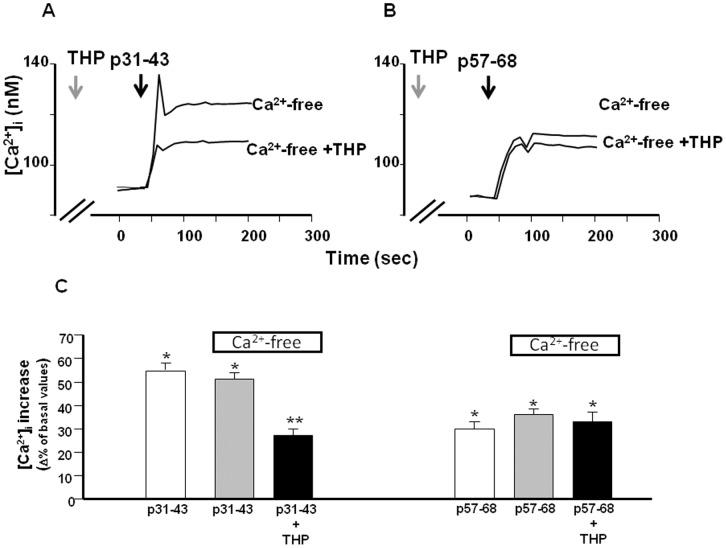
We also evaluated whether p31–43 and p57–68 exert the same effects on [Ca2+]i when perfused in a Ca2+-free solution. The data reported in Figure 2 show that extracellular Ca2+ ions flowing through the plasma membrane did not contribute to the effect of the peptides on [Ca2+]i. This suggests that the peptide-induced [Ca2+]i increase was due to the release of Ca2+ from intracellular stores.
Figure 2. Effect of Ca2+-free and THP on [Ca2+]i increase induced by gliadin peptides in Caco-2 cells.
(A) and (B) Superimposed single-cell traces representative for the effect of 20 µg/ml p31–43 and p57–68, respectively, in a Ca2+-free buffer, or in a Ca2+-free buffer plus 1 µM THP, on [Ca2+]i. Before peptide perfusion (black arrows), cells were preincubated with THP for 10 min (grey arrows), to deplete ER. (C) Quantification of the effect of the treatments reported in (A) and (B) on [Ca2+]i. Each bar represents the mean ±SEM of data obtained in three independent experimental sessions. *p<0.05 versus its respective control; **p<0.05 versus peptide alone.
Gliadin Peptides 31–43 and 57–68 mobilize Ca2+ from Different Intracellular Ca2+ Stores
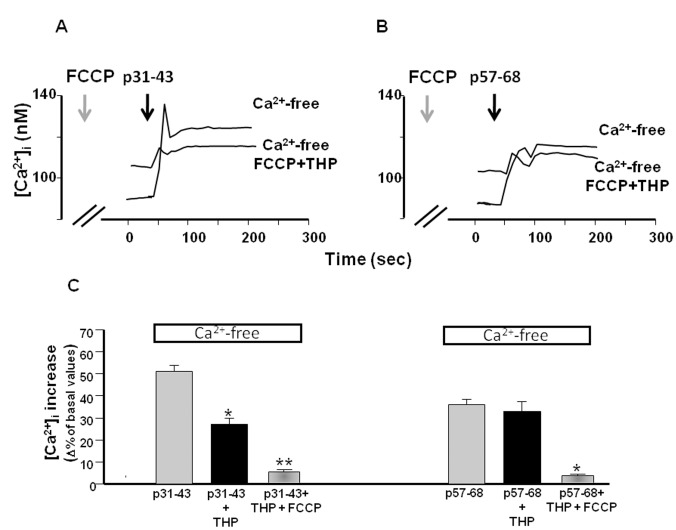
To identify the intracellular Ca2+ stores involved in the mechanism of Ca2+ release induced by p31–43 and p57–68, we first used THP to determine whether the ER was involved in the effect of the peptides. Treatment of cells with 1 µM THP significantly reduced the [Ca2+]i increase caused by p31–43 (20 µg/ml), but not that caused by p57–68 (20 µg/ml) (Figure 2A, B and C). This finding indicated that the ER was involved in the effect exerted by p31–43, but not by p57–68, on intracellular Ca2+ homeostasis. We next investigated whether the residual Ca2+ release induced by p31–43 was due to mitochondria, which are an important calcium store within the cell [24]. Using the mitochondrial uncoupler FCCP (300 nM) together with THP, we found that the effect of p31–43 on [Ca2+]i was further reduced (Figure 3A and C). In addition, the effect of p57–68 was completely inhibited in the presence of FCCP (Figure 3B and C). These data suggest that p31–43 and p57–68 modulated intracellular Ca2+ homeostasis with different mechanisms: p31–43 mobilized Ca2+ from the ER and mitochondria, while p57–68 mobilized Ca2+ only from mitochondria.
Figure 3. Effect of FCCP on [Ca2+]i increase induced by gliadin peptides in Caco-2 cells.
(A) and (B) Superimposed single-cell traces representative of the effect of 20 µg/ml p31–43 and p57–68, respectively, in a Ca2+-free buffer, and in a Ca2+-free buffer plus 1µM THP and 300 nM FCCP, on [Ca2+]i. Before peptide perfusion (black arrows), cells were preincubated with FCCP and THP for 10 min (grey arrows). (C) Quantification of the effect of the treatments reported in (A) and (B) on [Ca2+]i. Each bar represents the mean ± SEM of data obtained in three independent experimental sessions. *p<0.05 versus peptide alone; **p<0.05 versus peptide plus THP.
Gliadin Peptides Activate Intracellular tTG
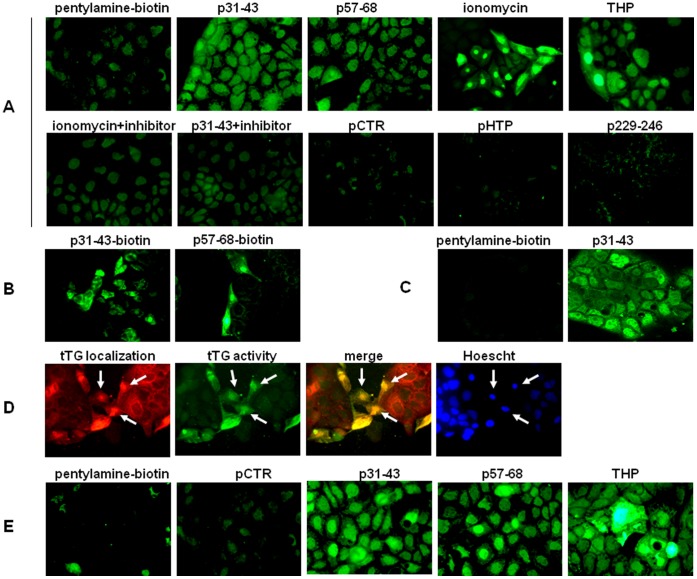
To investigate whether Ca2+ mobilization, induced by gliadin peptides, could activate the crosslinking function of intracellular tTG, we used pentylamine-biotin as tTG substrate to detect and quantify intracellular transamidating activity in Caco-2 cells. We first incubated cells in the presence of 20 µg/ml of p31–43 or p57–68. In both cases, microscopy observation of fixed and permeabilized cells after incubation with FITC-conjugated streptavidin revealed a fluorescent signal, which indicates activation of tTG crosslinking activity (Figure 4A). We obtained a similar fluorescence pattern when we treated cells with ionomycin, a Ca2+ ionophore that activates tTG intracellular activity [25]. To verify the specificity of tTG activity, we used cystamin, a well known tTG inhibitor, and found that cystamin inhibited the tTG activation induced by both ionomycin and p31–43 (Figure 4A). On the other hand, fluorescence intensity did not increase in cells treated with pCTR or with the other two irrelevant control peptides (pHTP and p229–246) (Figure 4A). Incubation with 5 µg/ml of p31–43 still produced a good fluorescence signal, whereas incubation with 5 µg/ml of p57–68 produced low fluorescence (not shown). Consequently, at a low concentration, p31–43 was more active than p57–68. We then explored the possibility that gliadin peptides could themselves be in situ tTG substrates. To this aim, we treated cells with biotinylated p31–43 or p57–68 for 30 min and we found that, in the presence of ionomycin, both peptides were able to cross-link to intracellular acyl-acceptor substrates (Figure 4B).
Figure 4. Microscopic visualization of tTG transamidating activity in Caco-2 cells.
(A) Microscopic visualization of pentylamine-biotin incorporation in situ, ×40, in the presence of a complete medium. Peptides were used at 20 µg/ml, ionomycin at 10 µM, and THP at 1µM. Where indicated, the tTG inhibitor cystamin (200 µM) was added 5 min before treatment. (B) Microscopic visualization of p31–43-biotin and p57–68-biotin incorporation in situ, x40, in the presence of ionomycin. (C) Confocal images of pentylamine-biotin incorporation in situ, x63 (LSM 510 Zeiss microscope), in the absence or presence of p31–43 20 µg/ml. (D) tTG localization (red) in ionomycin-treated cells and superimposition (merge) with intracellular tTG activity (green). Nuclei are in blue (Hoescht staining). Arrows indicate nuclei in which tTG is increased (E) Microscopic visualization of pentylamine-biotin incorporation in situ, ×40, in the presence of a Ca2+-free medium.
After Ca2+ mobilization, we observed an increase in intracellular tTG transamidating activity in both the cytosol and nucleus of ionomycin- and peptide-treated cells; this is also evident in the confocal images of cells treated with p31–43 (Figure 4C). Moreover, tTG staining revealed that nuclear tTG, which normally constitutes a significant fraction of total tTG in Caco-2 cells, was often visibly increased in cells after Ca2+ mobilization and tTG activation (Figure 4D).
Interestingly, we found that tTG was also activated when we stimulated cells with gliadin peptides in the presence of a Ca2+-free medium (i.e., phosphate-buffered saline without Ca2+ and Mg2+) (Figure 4E). This finding confirms that extracellular Ca2+ ions were not involved in tTG activation within the cells and that tTG activation was due to Ca2+ mobilization from intracellular stores. Finally, by treating cells with THP, both in the presence and in the absence of extracellular Ca2+ ions, we found that Ca2+ release from the ER was sufficient to activate intracellular tTG (Figure 4A and E).
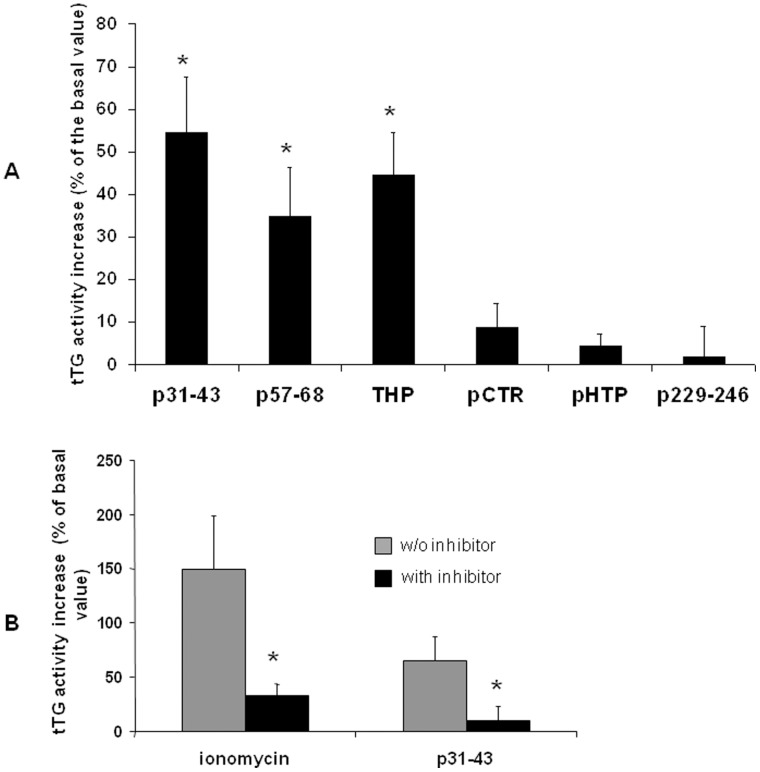
To quantify the increase of tTG activity, we carried out a microplate assay on cell homogenates obtained after treatment with p31–43 or p57–68. We found that tTG activity was more than 50% higher in p31–43-treated cells and about 40% higher in p57–68-treated cells than in cells exposed to pentylamine-biotin alone (Figure 5A). Tissue TG activation was similar in THP-treated cells, whereas control peptides had no effect. As expected, we observed a significant reduction of tTG activity, induced by ionomycin or p31–43, when we pretreated cells with cystamin (Figure 5B).
Figure 5. Quantification of tTG activity by the microplate assay.
(A) The microplate assay was performed on 25 µg of cell lysates obtained after treatment. Values are the means ± SD of at least 3 independent experiments in triplicate. *p<0.05 versus tTG basal activity. (F) Inhibition by cystamin of tTG activity induced by ionomycin and p31–43. Values are the means ± SD of three independent experiments in triplicate. *p<0.05 versus the respective activity in the absence of the inhibitor.
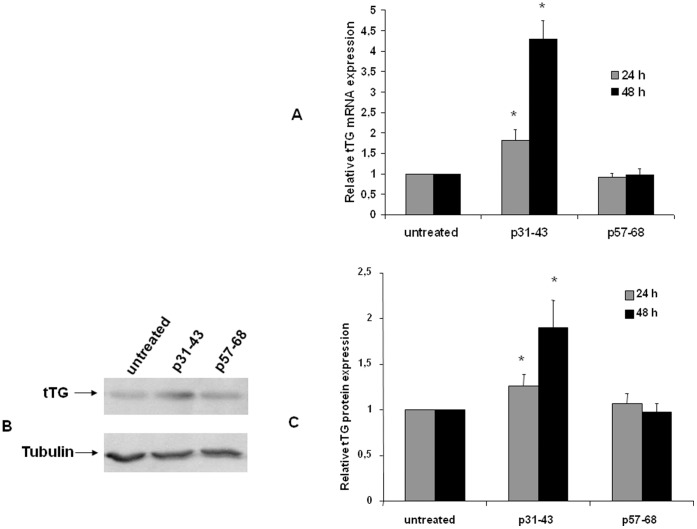
Finally, we evaluated the effect of prolonged treatment with gliadin peptides on tTG expression. As shown in Figure 6, we recorded a moderate increase of tTG mRNA and protein after 24 h of treatment with p31–43 but not with p57–68. However, treatment with p31–43 for 48 h induced a four-fold increase of tTG mRNA expression and a two-fold increase of tTG protein.
Figure 6. Analysis of p31–43 induced tTG expression in Caco-2 cells.
(A) Quantification of tTG mRNA by real-time RT-PCR after 24 and 48 h of treatment with 20 µg/ml p31–43 and p57–68. The amount of mRNA of tTG is normalized to that of GAPDH. Values are the means ± SD of three independent experiments. *p<0.05 versus untreated. (B) Western blot analysis of tTG protein level after 48 h of treatment with 20 µg/ml p31–43 and p57–68. The blot shown is representative of three independent experiments. (C) Densitometric analysis (means of three independent western blot experiments) of protein levels after 24 and 48 h of treatments. The amount of tTG is normalized to that of tubulin. Values are the means ± SD *p<0.05 versus untreated.
Gliadin Peptide 31–43 Induces GRP78 and CHOP Expression
Since p31–43 can mobilize Ca2+ ions from the ER, we asked whether persistent stimulation with p31–43 could induce the ER stress response in Caco-2 cells. To test this hypothesis, we analysed the expression of two well known biochemical marker of ER stress, GRP78 and CHOP ([26], [27].
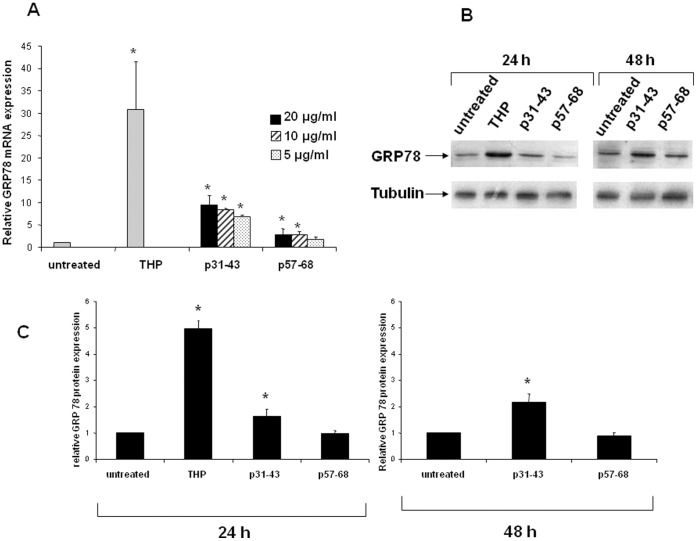
We treated Caco-2 cells for 24 h with 20 µg/ml of p31–43 or with 1 µM of THP, which is considered an ER stress-inducing agent. We found that, in the presence of THP, GRP78 mRNA expression increased about 30-fold with respect to basal GRP78 expression in untreated cells (Figure 7A). Importantly, in the presence of p31–43, GRP78 mRNA expression increased about nine-fold (Figure 7A), which indicates that p31–43 triggered an ER-stress response in Caco-2 cells. Interestingly, p31–43 induced a very similar GRP78 mRNA increase when used at lower concentrations (i.e., 10 and 5 µg/ml). However, under the afore-mentioned experimental conditions, p57–68 also induced a small but significant increase in GRP78 mRNA expression. We are unable to explain this finding. As shown in Figure 7B and C, the expression of the GRP78 protein increased by about 50% after treatment for 24 h with 20 µg/ml of p31–43. In addition, GRP78 protein expression was doubled after treatment for 48 h with p31–43. Under the same conditions, p57–68 did not induce an increase of GRP78 protein expression. As expected, after treatment with THP for 24 h, GRP78 protein expression was increased about five-fold.
Figure 7. Analysis of GRP78 expression in Caco-2 cells.
(A) Quantification of GRP78 mRNA by real-time RT-PCR after 24 h of treatment with 1 µM THP, or 20 µg/ml p31–43 and p57–68. The amount of mRNA of GRP78 is normalized to that of GAPDH. Values are the means ± SD of at least three independent experiments. *p<0.05 versus untreated. (B) Western blot analysis of GRP78 protein level after 24 and 48 h of treatments with 20 µg/ml p31–43 and p57–68. Cells were exposed to THP (1 µM) for 24 h only. The blot shown is representative of three independent experiments. (C) Densitometric analysis (means of three independent western blot experiments). The amount of GRP78 is normalized to that of tubulin. Values are the means ± SD *p<0.05 versus untreated.
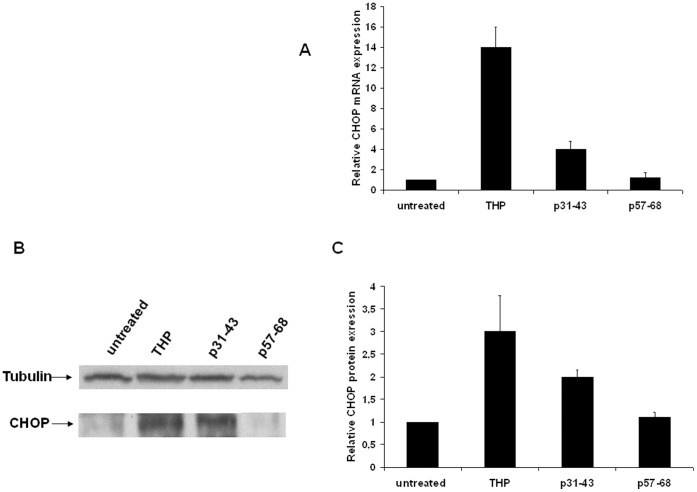
We next measured CHOP expression and found that treatment with THP for 24 h caused an increase of about 14-fold and three-fold in CHOP mRNA and protein expression, respectively (Figure 8). Treatment with p31–43 increased CHOP mRNA expression four-fold, and CHOP protein expression two-fold; p57–68 did not modify CHOP expression (Figure 8).
Figure 8. Analysis of CHOP expression in Caco-2 cells.
(A) Quantification of CHOP mRNA by real-time RT-PCR after 24 h of treatment with 1 µM THP, or 20 µg/ml p31–43 and p57–68. The amount of CHOP mRNA is normalized to that of GAPDH. Values are the means ± SD of three independent experiments. *p<0.05 versus untreated. (B) Western blot analysis of CHOP protein level after 24 h of treatments. The blot shown is representative of three independent experiments. (C) Densitometric analysis (means of three independent western blot experiments). The amount of CHOP is normalized to that of tubulin. Values are the means ± SD *p<0.05 versus untreated.
Discussion
In CD, the catalytic activity of tTG seems to be crucial for the deamidation of immunogenic gliadin peptides as well as for the formation of gliadin-tTG complexes [1], [4]. Moreover, the catalytic activity of tTG has been associated with an increased inflammatory response to gliadin [18]. However, it is not clear where tTG is activated at cellular and tissue level. Inside cells, tTG is normally latent because of the low Ca2+ concentration and the inhibitory effect of GTP/GDP. When activated, tTG can interact with various intracellular proteins and so alter their structure, function, and/or stability [28]–[30]. Interestingly, in a previous proteomic study, we identified many tTG-modified protein targets in human intestinal epithelial cells by using both an acyl-acceptor tTG substrate (pentylamine-biotin) and an acyl-donor tTG substrate (the hexapeptide TVQQEL) [31].
Here we report that treatment of Caco-2 cells with gliadin peptides p31–43 and p57–68 activated intracellular tTG by causing a rapid increase of Ca2+ in the cytosol. However, the effect induced by p31–43 was more pronounced than the effect induced by p57–68. Treatment of cells with irrelevant control peptides did not induce tTG activation. Interestingly, as a consequence of tTG activation, p31–43 and p57–68 appear to be cross-linked to cellular acyl-acceptor proteins. This finding is in line with our previous result that tTG mediates p31–43 incorporation into CD mucosal enterocytes in situ [23]. The observation that active tTG can recognize and modify gliadin peptides inside the cells led to the notion that also tTG-mediated deamidation could be an intracellular event.
Our finding that the intracellular Ca2+ concentration increased in Caco-2 cells also in the absence of extracellular Ca2+ ions demonstrates that gliadin peptides induced Ca2+ mobilization from intracellular Ca2+ deposits. Consequently, we used THP and FCCP, which specifically deplete the ER and mitochondria, respectively, to identify the intracellular Ca2+ stores involved in the mechanism of Ca2+ release induced by p31–43 and p57–68. Our data reveal two main pathways of Ca2+ release, namely, p31–43 modulates intracellular Ca2+ homeostasis by mobilizing Ca2+ ions from the ER and mitochondria, whereas p57–68 mobilizes Ca2+ ions only from mitochondria. Peptides 31–43 and p57–68 can enter cells and localize at vesicular level. In particular, p31–43 localizes in the early vesicular compartment when p57–68 progresses to the late compartment [14], [20]. Peptide 31–43 is delayed in the early compartment because it deranges the correct localization of the hepatocyte growth factor-regulated tyrosine kinase substrate [14]. Indeed, the hepatocyte growth factor-regulated tyrosine kinase substrate is a key regulator of endocytic maturation that acts at the early vesicular compartment. Thus, the different localization of the two gliadin peptides may explain why they mobilized Ca2+ ions from different compartments.
We found that tTG was active in the cytosol and very active in the nucleus of Caco-2 cells treated with gliadin peptides, which indicates that tTG translocates into the nucleus in response to the elevated intracellular Ca2+ level. The presence of an enhanced level of active tTG enzyme in the nuclear fraction as a consequence of increased tTG import from the cytoplasm to the nucleus is not a novelty [25], [32], [33]. The molecular mechanisms underlying tTG translocation are poorly understood [33]. However, the importance of nuclear tTG in regulating gene expression is well documented. For example, McConoughey et al. [34] reported that, in the nucleus, transamidation can dysregulate the expression of metabolic, chromatin, chaperone and cell death genes in Huntington’s disease. Moreover, Tatsukawa et al. [35] demonstrated that tTG activity is induced in the nuclei of ethanol-treated hepatocytes. Active tTG cross-links and inactivates the general transcription factor Sp1 thereby inducing hepatic apoptosis.
In the cytosol, tTG-catalyzed transamidation of glutamine 63 of RhoA activates RhoA, which plays a key role in the signaling mechanism of the MAPK pathways [36]; it also increases endothelial permeability [37]. In addition, tTG participates in the activation of nuclear factor kappa (NF-κ)B by cross-linking the inhibitory protein IκBα [38]. NF-κB is a transcription factor that is constitutively active in the intestinal mucosa of patients with untreated CD [39] and is considered central to intestinal inflammation [40]–[42]. Finally, it has been hypothesized that tTG-mediated downregulation of the PPARγ signaling pathway in cells treated with p31–43 may contribute to NF-κB activation and therefore plays a pivotal role in CD-associated inflammation [18], [43]. In line with this scenario, we observed that prolonged treatment of Caco-2 cells with p31–43, but not with p57–68, increased tTG mRNA and protein expression in Caco-2 cells. This finding supports the hypothesis that p31–43 could induce tTG-mediated pro-inflammatory modifications in cells.
A large body of evidence suggests that Ca2+ is an important regulator of cell fate. An abrupt increase of intracellular Ca2+ is found in ischemia-reperfusion injury, receptor over-stimulation and oxidative stress [44]. Depletion of Ca2+ from the ER, which is the most important intracellular store of Ca2+, can cause protein misfolding and ER-stress. ER-stress triggers a series of signaling and transcriptional events known as the unfolded protein response. The unfolded protein response attempts to restore homeostasis in the ER but, if unsuccessful, can trigger apoptosis in the stressed cells and local inflammation [45]. Chaperone production is upregulated in response to increased misfolding, and the magnitude of the increase in chaperone levels, particularly GRP78, is widely used as a marker of ER-stress [26], [45]. Here we report that stimulation of Caco-2 cells with p31–43 increases GRP78 mRNA expression by about nine-fold, and GRP78 protein levels by about 50% versus basal GRP78 levels in untreated cells. We also evaluated whether prolonged treatment with gliadin peptides could activate CHOP, a transcription factor that primarily mediates stress-linked apoptosis in cells with an irrecoverable level of ER-stress [46]. We found a moderate but significant increase of CHOP expression (both as mRNA and as protein) in cells treated with p31–43, but not with p57–68. Interestingly, it was recently reported that ER-stress-induced CHOP can negatively modulate PPARγ action, thus enhancing the pro-inflammatory response in human intestinal epithelial cells [47].
ER-stress has been associated with an increasing number and wide variety of human diseases, namely, cancer, diabetes, developmental disorders, and neurodegenerative, infectious and inflammatory diseases [48]. The concept that ER-stress, elicited by the gliadin peptide p31–43, could be involved in CD is intriguing also because unresolved ER-stress leads to intestinal epithelial cell dysfunctions typical of the entity inflammatory bowel disease [49].
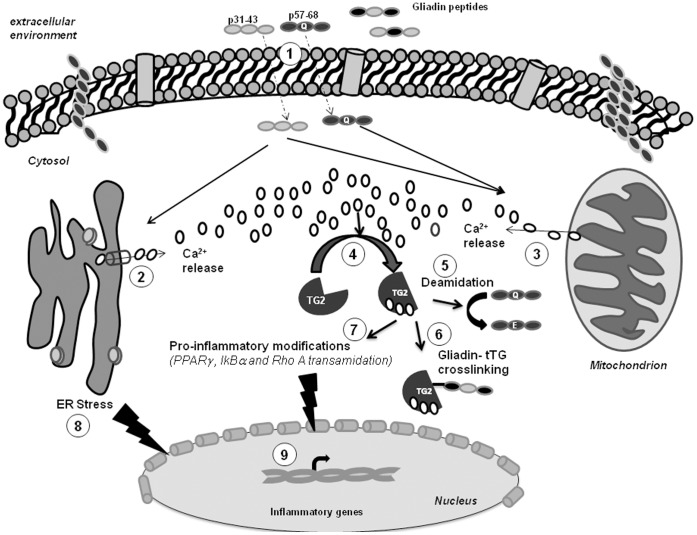
In conclusion, given the direct links between ER-stress/unfolded protein response and local and systemic inflammation, we suggest that p31–43, which is responsible for innate immunity in CD, could promote an ER-stress pathway by inducing rapid Ca2+ mobilization from the ER, and so amplify a local inflammatory response (Figure 9). Moreover, by mobilizing Ca2+ from intracellular stores, both p31–43 and p57–68 could induce tTG-mediated modifications of several key regulators of the inflammatory response. Finally, intracellular tTG activation could allow deamidation of immunogenic gliadin peptides and the formation of gliadin-tTG complexes (Figure 9) inside enterocytes and other specialized antigen-presenting cells, such as duodenal dendritic cells and macrophages, which contain large amounts of tTG.
Figure 9. A model of the possible relationship between gliadin peptides, tTG activation, ER-stress and the inflammatory response.
Toxic and immunogenic gliadin peptides penetrate inside the cells through vesicular trafficking (1) [14], [18], [20] and rapidly induce Ca2+ release from the ER (2) and mitochondria (3). The increased [Ca2+]i activates normally silent tTG (4), which in turn deamidates gliadin peptides (5) and/or produces cross-links between the peptides and the tTG itself (6) or between the peptides and other cellular proteins [4], [5], [11], [12]. In addition, active tTG transamidates IκBα [38], PPARγ [18], and Rho A [36], which are key regulators of the inflammatory response. Persistent stimulation with toxic gliadin peptides (p31–43) can also trigger an ER-stress response (8) that, in turn, can modulate the expression of inflammatory genes (9) [45].
Acknowledgments
We are grateful to Jean Ann Gilder (Scientific Communication srl) for text editing and to the “Fondazione per il Sud”.
Funding Statement
This work was supported by a grant from “Fondi di Ateneo per la Ricerca di Base (FARB)” 2009, ORSA090313. The funders had no role in study design, data collection and analysis, decision to publish, or preparation of the manuscript.
References
- 1. Jabri B, Sollid LM (2009) Tissue-mediated control of immunopathology in coeliac disease. Nat Rev Immunol 9(12): 858–870. [DOI] [PubMed] [Google Scholar]
- 2. Maiuri L, Ciacci C, Ricciardelli I, Vacca L, Raia V, et al. (2003) Association between innate response to gliadin and activation of pathogenic T cells in coeliac disease. Lancet 362(9377): 30–37. [DOI] [PubMed] [Google Scholar]
- 3. Tollefsen S, Arentz-Hansen H, Fleckenstein B, Fleckenstein B, Molberg O, et al. (2006) HLA-DQ2 and -DQ8 signatures of gluten T cell epitopes in celiac disease. J Clin Invest 116(8): 2226–2236. [DOI] [PMC free article] [PubMed] [Google Scholar]
- 4. Sollid LM (2000) Molecular basis of celiac disease. Annu Rev Immunol 18: 53–81. [DOI] [PubMed] [Google Scholar]
- 5. Sollid LM, Jabri B (2011) Celiac disease and transglutaminase 2: a model for posttranslational modification of antigens and HLA association in the pathogenesis of autoimmune disorders. Curr Opin Immunol 23(6): 732–738. [DOI] [PMC free article] [PubMed] [Google Scholar]
- 6. Lorand L, Graham RM (2003) Transglutaminases: crosslinking enzymes with pleiotropic functions. Nat Rev Mol Cell Biol 4(2): 140–156. [DOI] [PubMed] [Google Scholar]
- 7. Im MJ, Russell MA, Feng JF (1997) Transglutaminase II: a new class of GTP-binding protein with new biological functions. Cell Signal 9(7): 477–482. [DOI] [PubMed] [Google Scholar]
- 8. Zemskov EA, Mikhailenko I, Hsia RC, Zaritskaya L, Belkin AM (2011) Unconventional secretion of tissue transglutaminase involves phospholipid-dependent delivery into recycling endosomes. PLoS One 6(4): e19414. [DOI] [PMC free article] [PubMed] [Google Scholar]
- 9. Griffin M, Casadio R, Bergamini CM (2002) Transglutaminases: nature’s biological glues. Biochem J 368: 377–396. [DOI] [PMC free article] [PubMed] [Google Scholar]
- 10. Iismaa SE, Mearns BM, Lorand L, Graham RM (2009) Transglutaminases and disease: lessons from genetically engineered mouse models and inherited disorders. Physiol Rev 89(3): 991–1023. [DOI] [PubMed] [Google Scholar]
- 11. Sollid LM, Molberg O, McAdam S, Lundin KE (1997) Autoantibodies in coeliac disease: tissue transglutaminase-guilt by association? Gut 41(6): 851–852. [DOI] [PMC free article] [PubMed] [Google Scholar]
- 12. Schuppan D, Dieterich W, Riecken EO (1998) Exposing gliadin as a tasty food for lymphocytes. Nat Med 4(6): 666–667. [DOI] [PubMed] [Google Scholar]
- 13. Caputo I, Barone MV, Lepretti M, Martucciello S, Nista I, et al. (2010) Celiac anti-tissue transglutaminase antibodies interfere with the uptake of alpha gliadin peptide 31–43 but not of peptide 57–68 by epithelial cells. Biochim Biophys Acta 1802(9): 717–727. [DOI] [PubMed] [Google Scholar]
- 14. Barone MV, Nanayakkara M, Paolella G, Maglio M, Vitale V, et al. (2010) Gliadin peptide P31–43 localises to endocytic vesicles and interferes with their maturation. PLoS One 5(8): e12246. [DOI] [PMC free article] [PubMed] [Google Scholar]
- 15. Siegel M, Strnad P, Watts RE, Choi K, Jabri B, et al. (2008) Extracellular transglutaminase 2 is catalytically inactive, but is transiently activated upon tissue injury. PLoS One 3(3): e1861. [DOI] [PMC free article] [PubMed] [Google Scholar]
- 16. Nicholas B, Smethurst P, Verderio E, Jones R, Griffin M (2003) Cross-linking of cellular proteins by tissue transglutaminase during necrotic cell death: a mechanism for maintaining tissue integrity. Biochem J 371(2): 413–422. [DOI] [PMC free article] [PubMed] [Google Scholar]
- 17. Shin DM, Jeon JH, Kim CW, Cho SY, Kwon JC, et al. (2004) Cell type-specific activation of intracellular transglutaminase 2 by oxidative stress or ultraviolet irradiation: implications of transglutaminase 2 in age-related cataractogeneis. J Biol Chem 279(16): 15032–15039. [DOI] [PubMed] [Google Scholar]
- 18. Luciani A, Villella VR, Vasaturo A, Giardino I, Pettoello-Mantovani M, et al. (2010) Lysosomal accumulation of gliadin p31–43 peptide induces oxidative stress and tissue transglutaminase-mediated PPAR gamma downregulation in intestinal epithelial cells and coeliac mucosa. Gut 59(3): 311–319. [DOI] [PubMed] [Google Scholar]
- 19. Silano M, Di Benedetto R, Trecca A, Arrabito G, Leonardi F, et al. (2007) A decapeptide from durum wheat prevents celiac peripheral blood lymphocytes from activation by gliadin peptides. Pediatr Res 61(1): 67–71. [DOI] [PubMed] [Google Scholar]
- 20. Zimmer KP, Fischer I, Mothes T, Weissen-Plenz G, Schmitz M, et al. (2010) Endocytotic segregation of gliadin peptide 31–49 in enterocytes. Gut 59(3): 300–310. [DOI] [PubMed] [Google Scholar]
- 21. Secondo A, Staiano RI, Scorziello A, Sirabella R, Boscia F, et al. (2007) BHK cells transfected with NCX3 are more resistant to hypoxia followed by reoxygenation than those transfected with NCX1 and NCX2: Possible relationship with mitochondrial membrane potential. Cell Calcium 42(6): 521–535. [DOI] [PubMed] [Google Scholar]
- 22.Caputo I, Lepretti M, Secondo A, Martucciello S, Paolella G, et al. (2011) Anti-tissue transglutaminase antibodies activate intracellular tissue transglutaminase by modulating cytosolic Ca(2+) homeostasis. Amino Acids, 2011, DOI: 10.1007/s00726-011-1120-yOnline FirstMT. [DOI] [PubMed]
- 23. Esposito C, Paparo F, Caputo I, Porta R, Salvati VM, et al. (2003) Expression and enzymatic activity of small intestinal tissue transglutaminase in celiac disease. Am J Gastroenterol. 98(8): 1813–1820. [DOI] [PubMed] [Google Scholar]
- 24. Duchen MR (2000) Mitochondria and Ca(2+) in cell physiology and pathophysiology. Cell Calcium 28(5–6): 339–348. [DOI] [PubMed] [Google Scholar]
- 25. Zhang J, Lesort M, Guttmann RP, Johnson GV (1998) Modulation of the in situ activity of tissue transglutaminase by calcium and GTP. J Biol Chem 23 273(4): 2288–2295. [DOI] [PubMed] [Google Scholar]
- 26. Lee AS (2001) The glucose-regulated proteins: stress induction and clinical applications. Trends Biochem Sci 26(8): 504–510. [DOI] [PubMed] [Google Scholar]
- 27. Wang XZ, Lawson B, Brewer JW, Zinszner H, Sanjay A, et al. (1996) Signals from the stressed endoplasmic reticulum induce C/EBP-homologous protein (CHOP/GADD153). Mol Cell Biol 16: 4273–4280. [DOI] [PMC free article] [PubMed] [Google Scholar]
- 28. Junn E, Ronchetti RD, Quezado MM, Kim SY, Mouradian MM (2003) Tissue transglutaminase-induced aggregation of alpha synuclein: implication for Lewy body formation in Parkinson’s disease and dementia with Lewy bodies. Proc Natl Acad Sci U S A 100(4): 2047–2052. [DOI] [PMC free article] [PubMed] [Google Scholar]
- 29. Bailey CD, Johnson GV (2005) Tissue transglutaminase contributes to disease progression in the R6/2 Huntington’s disease mouse model via aggregate-independent mechanisms. J Neurochem 92(1): 83–92. [DOI] [PubMed] [Google Scholar]
- 30. Chhabra A, Verma A, Mehta K (2009) Tissue transglutaminase promotes or suppresses tumours depending on cell context. Anticancer Res 29(6): 1909–1919. [PubMed] [Google Scholar]
- 31. Orrù S, Caputo I, D’Amato A, Ruoppolo M, Esposito C (2003) Proteomics identification of acyl-acceptor and acyl-donor substrates for transglutaminase in a human intestinal epithelial cell line. Implications for celiac disease. J Biol Chem 278(34): 31766–31773. [DOI] [PubMed] [Google Scholar]
- 32. Lesort M, Attanavanich K, Zhang J, Johnson GV (1998) Distinct nuclear localization and activity of tissue transglutaminase. J Biol Chem 5 273(20): 11991–11994. [DOI] [PubMed] [Google Scholar]
- 33. Kuo TF, Tatsukawa H, Kojima S (2011) New insights into the functions and localization of nuclear transglutaminase 2. FEBS J 278(24): 4756–4767. [DOI] [PubMed] [Google Scholar]
- 34. McConoughey SJ, Basso M, Niatsetskaya ZV, Sleiman SF, Smirnova NA, et al. (2010) Inhibition of transglutaminase 2 mitigates transcriptional dysregulation in models of Huntington’s disease. EMBO Mol Med 2(9): 349–370. [DOI] [PMC free article] [PubMed] [Google Scholar]
- 35. Tatsukawa H, Fukaya Y, Frampton G, Martinez-Fuentes A, Suzuki K, et al. (2009) Role of transglutaminase 2 in liver injury via cross-linking and silencing of trasciption factor Sp1. Gastroenterology 136(5): 1783–95.e10. [DOI] [PMC free article] [PubMed] [Google Scholar]
- 36. Singh US, Kunar MT, Kao YL, Baker KM (2001) Role of transglutaminase II in retinoic acid-induced activation of RhoA-associated kinase-2. EMBO J 20(10): 2413–2423. [DOI] [PMC free article] [PubMed] [Google Scholar]
- 37. Myrsky E, Caja S, Simon-Vecsei Z, Korponay-Szabo IR, Nadalutti C, et al. (2009) Celiac disease IgA modulates vascular permeability in vitro through the activity of transglutaminase 2 and RhoA. Cell Mol Life Sci 66(20): 3375–3385. [DOI] [PMC free article] [PubMed] [Google Scholar]
- 38. Verma A, Mehta K (2007) Transglutaminase-mediated activation of nuclear transcription factor-kappaB in cancer cells: a new therapeutic opportunity. Curr Cancer Drug Targets 7(6): 559–565. [DOI] [PubMed] [Google Scholar]
- 39. Maiuri MC, De Stefano D, Mele G, Fecarotta S, Greco L, et al. (2003) Nuclear factor kappa B is activated in small intestinal mucosa of celiac patients. J Mol Med (Berl) 81(6): 373–379. [DOI] [PubMed] [Google Scholar]
- 40. Rogler G, Brand K, Vogl D, Page S, Hofmeister R, et al. (1998) Nuclear factor kappa B is activated in macrophages and epithelial cells of inflamed intestinal mucosa. Gastroenterology 115: 357–369. [DOI] [PubMed] [Google Scholar]
- 41. Andresen L, Jørgensen VL, Perner A, Hansen A, Eugen-Olsen J, et al. (2005) Activation of nuclear factor kappa B in colonic mucosa from patients with collagenous and ulcerative colitis. Gut 54(4): 503–509. [DOI] [PMC free article] [PubMed] [Google Scholar]
- 42. Bodger K, Halfvarson J, Dodson AR, Campbell F, Wilson S, et al. (2006) Abnormal colonic glycoprotein expression in unaffected monozygotic twins of inflammatory bowel disease patients. Gut 55: 973–977. [DOI] [PMC free article] [PubMed] [Google Scholar]
- 43. Simula MP, Cannizzaro R, Canzonieri V, Pavan A, Maiero S, et al. (2010) PPAR signaling pathway and cancer-related proteins are involved in celiac disease-associated tissue damage. Mol Med 16(5–6): 199–209. [DOI] [PMC free article] [PubMed] [Google Scholar]
- 44. Orrenius S, Zhivotovsky B, Nicotera P (2003) Regulation of cell death: the calcium-apoptosis link. Nat Rev Mol Cell Biol 4(7): 552–565. [DOI] [PubMed] [Google Scholar]
- 45. McGuckin MA, Eri RD, Das I, Lourie R, Florin TH (2010) ER stress and the unfolded protein response in intestinal inflammation. Am J Physiol Gastrointest Liver Physiol 298(6): G820–832. [DOI] [PubMed] [Google Scholar]
- 46. Zinszner H, Kuroda M, Wang X, Batchvarova N, Lightfoot RT, et al. (1998) CHOP is implicated in programmed cell death in response to impaired function of the endoplasmic reticulum. Genes Dev 12: 982–995. [DOI] [PMC free article] [PubMed] [Google Scholar]
- 47. Park SH, Choi HJ, Yang H, Do KH, Kim J, et al. (2010) Endoplasmic reticulum stress-activated C/EBP homologous protein enhances nuclear factor-kappaB signals via repression of peroxisome proliferator-activated receptor gamma. J Biol Chem 285(46): 35330–35339. [DOI] [PMC free article] [PubMed] [Google Scholar]
- 48. Ni M, Lee AS (2007) ER chaperones in mammalian development and human diseases. FEBS 581(19): 3641–3651. [DOI] [PMC free article] [PubMed] [Google Scholar]
- 49. Kaser A, Lee AH, Franke A, Glickman JN, Zeissig S, et al. (2008) XBP1 links ER stress to intestinal inflammation and confers genetic risk for human inflammatory bowel disease. Cell 134(5): 743–756. [DOI] [PMC free article] [PubMed] [Google Scholar]


