Behavioral studies in humans suggest that sensorineural hearing loss (SNHL) decreases sensitivity to the temporal structure of sound, but neurophysiological studies in mammals provide little evidence for diminished temporal coding. Here, we found that SNHL in chinchillas degrades peripheral temporal coding in background noise substantially more than in quiet. These results resolve discrepancies between previous studies and help explain why perceptual difficulties in hearing-impaired listeners often emerge in noisy situations.
The physiological basis of degraded speech perception in human listeners with SNHL is a subject of active debate and investigation. Psychoacoustic studies suggest that a deficit in temporal processing may be responsible1–3, but neurophysiological studies in animals show little impact of SNHL on the strength of temporal coding in single neurons4–7. Neurophysiologic studies of the auditory periphery demonstrate relatively few changes in the degree of neural synchrony, or “phase locking” of spikes, to the temporal structure of acoustic stimuli, leading to speculation that temporal processing deficits might arise in the central nervous system1. A peripheral origin cannot be ruled out, however, because existing studies quantified temporal coding under artificially quiet conditions only. By contrast, we studied the effect of SNHL on temporal coding of tones in the auditory periphery under more realistic, noisy conditions.
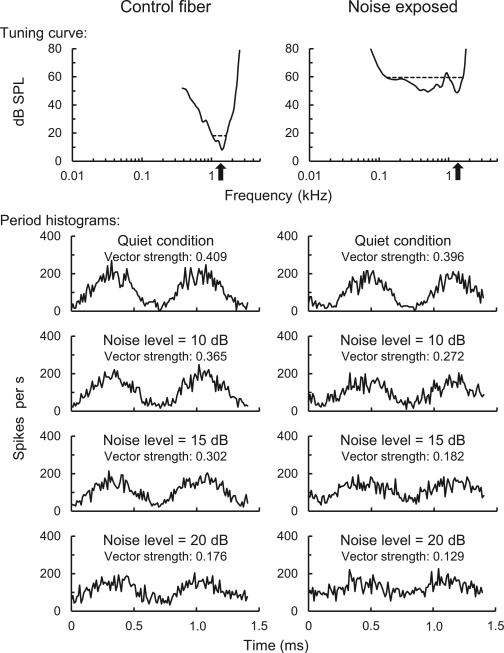
We induced SNHL with exposure to noise and recorded single auditory nerve fiber activity in anesthetized chinchillas using methods approved by Purdue's Animal Care and Use Committee (Online Methods). In each auditory nerve fiber encountered, we measured a tuning curve (Fig. 1, top) to determine the fiber's minimum threshold and characteristic frequency (the frequency of maximum sensitivity, or for noise-exposed fibers, the estimated frequency of maximum sensitivity prior to SNHL8). Next, we recorded spike trains to pure tone stimuli presented in quiet and in three levels of Gaussian background noise. We presented pure tones with frequency equal to the fiber's characteristic frequency and level 30 dB above the fiber's minimum threshold in quiet. We presented background noise (20 kHz bandwidth) at RMS amplitudes of 10, 15, and 20 dB above that of the tone. We quantified temporal coding by calculating the vector strength of phase locking to the tone frequency from period histograms of the spike train responses9 (Fig. 1 lower panels).
Figure 1.
Tuning curves (top panel) and period histograms of tone responses (lower panels) from a representative control fiber (left) and noise-exposed fiber (right). Upward-pointing arrows along the abscissa of tuning curves indicate characteristic frequency. Characteristic frequency, threshold, and bandwidth (measured 10 dB above threshold) were 1.41 kHz, 8 dB SPL, and 0.59 kHz, respectively, in the control fiber and 1.38 kHz, 49 dB SPL, and 1.48 kHz, respectively, in the noise-exposed fiber. Period histograms show fluctuation in mean spike rate over two cycles of the ~1.4 kHz tone stimulus. Masking condition and vector strength of phase locking to tones are specified above each histogram.
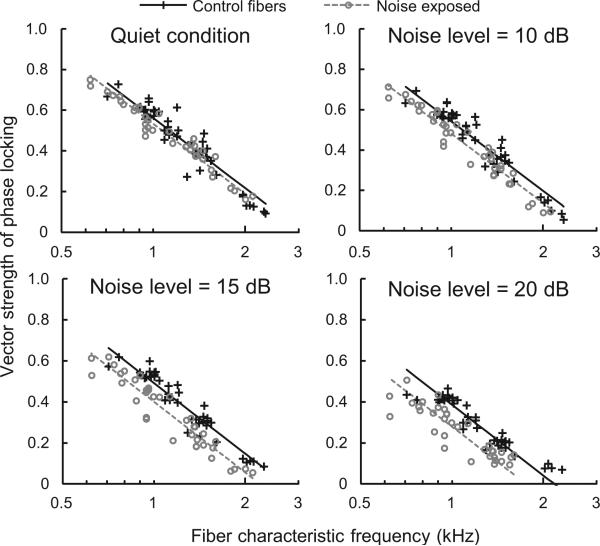
We recorded neural responses from 38 noise-exposed fibers and 42 control fibers with characteristic frequencies ranging from 0.6 to 2.5 kHz. Compared to control fibers of the same characteristic frequency, noise-exposed fibers had higher thresholds (mean increase ± SD: 34.8 ± 10.6 dB) and broader tuning curve bandwidth (mean increase ± SD: 0.88 ± 0.53 octaves; i.e. nearly a factor of 2 broader), consistent with previous studies of SNHL6,7. Period histograms of auditory nerve responses to tones showed modulations in spike rate synchronized to the fine structure of the tone waveform in quiet. Modulations in spike rate decreased in amplitude with increasing noise level (Fig. 1 lower panels). We quantified the effects of noise exposure and masking level on vector strength with a repeated-measures mixed model that incorporated the interaction term and random effects of log transformed characteristic frequency and fiber number. Residuals were normally distributed and of comparable variance. Analyses revealed negative effects of noise exposure (F1,78 = 51.86, P < 0.001) and masking level (F3,226 = 746.26, P < 0.001) on vector strength. The negative impact of masking on vector strength was greater in noise-exposed fibers than controls (treatment by masking level: F3,226 = 25.75, P < 0.001). Notably, vector strength of noise-exposed fibers was only slightly diminished compared to controls under quiet conditions, with much greater reductions in temporal coding strength revealed in masking noise (Fig. 2).
Figure 2.
A negative effect of hearing loss on phase locking to tones emerges in background noise. Scatter plots show vector strength in noise-exposed and control fibers as a function of fiber characteristic frequency under four masking conditions. The level of the masking noise (difference in dB between the RMS amplitude of the noise and tone) is given at the top of each panel. The difference in vector strength between noise-exposed and control fibers (least squares mean ± standard error) was –0.028 ± 0.011 in quiet (P = 0.016), –0.061 ± 0.012 in 10 dB noise (P < 0.001), –0.091 ± 0.012 in 15 dB noise (P < 0.001), and –0.106 ± 0.012 in 20 dB noise (P < 0.001).
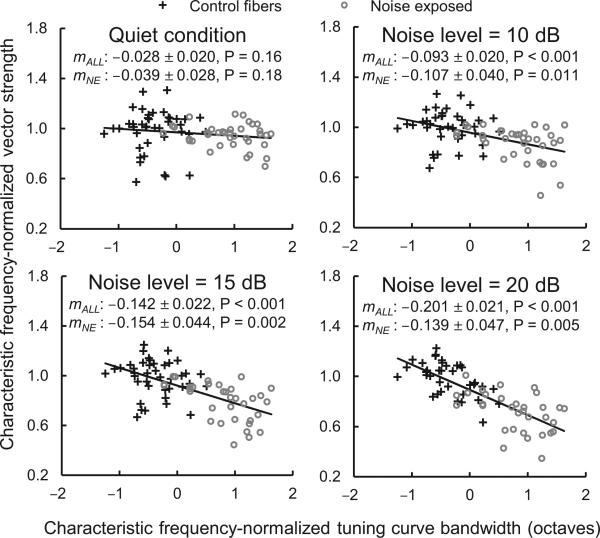
The negative effect of masking on vector strength can be attributed to a decrease in the proportion of spikes synchronized to the tone and increase in the proportion of spikes driven by the noise. We reasoned that the stronger effect of masking in the noise-exposed group could ultimately reflect broader tuning curve bandwidth. Broader tuning should allow more noise energy to enter the fiber's receptive field during processing of the tone and therefore disrupt temporal coding to a greater degree. Under this scenario, impaired fibers exhibiting greater increases in tuning curve bandwidth should show greater reductions in vector strength. We evaluated this hypothesis by analyzing the relationship between tuning curve bandwidth and vector strength with linear regressions of characteristic frequency-normalized variables (Fig. 3). As predicted, impaired fibers with broader tuning curves exhibited greater reductions in vector strength in noise. This correlation suggests that the stronger effect of masking in impaired fibers likely arises from broader cochlear frequency tuning.
Figure 3.
Noise-exposed fibers with broader tuning exhibit greater reductions in vector strength. Scatter plots show characteristic frequency-normalized vector strength (vector strength divided by the mean vector strength of control fibers at the same characteristic frequency) as a function of characteristic frequency-normalized tuning curve bandwidth (the octave difference from the mean bandwidth of control fibers at the same characteristic frequency [from Ref. 7]). The level of the masking noise (difference in dB between the RMS amplitude of the noise and tone) is given at the top of each panel followed by the slope of the regression line ± standard error and its statistical significance. We conducted analyses using both data from all fibers (mALL) and data from noise-exposed fibers only (mNE). Trend lines are based on data from all fibers.
In conclusion, the results of the present study demonstrate that SNHL reduces the strength of temporal coding in noise at the most peripheral level of auditory processing. Together with other mechanisms including synaptic losses and cochlear neurodegeneration that reduce the redundancy of neural coding10 and potential changes in central auditory processing1,11, the present results help to explain why speech perception problems in the hearing impaired commonly emerge under noisy conditions. Furthermore, they underscore the benefit of conducting audiometric evaluations under less artificial conditions12 and highlight the promise of advancements in signal processing strategies for use in hearing aids and cochlear implants that increase the signal-to-noise ratio of speech at the output of the device.
ONLINE METHODS
We collected neurophysiological data from young chinchillas using procedures approved by Purdue's Animal Care and Use Committee. We recorded neurophysiological responses from single auditory nerve fibers using standard procedures in our lab7. We collected data between June and August of 2011 in 2 normal hearing control animals (42 fibers) and 5 animals with noise-induced sensorineural hearing loss (38 fibers).
Noise Exposures
We induced sensorineural hearing loss with a 2-hr exposure to an octave-band of Gaussian noise with a center frequency of 500 Hz and SPL of 116 dB. We exposed animals to noise in a sound-attenuating booth under anesthesia using a free-field sound source (Selenium 10PW3 woofer) suspended 25–30 cm above the animal. We anesthetized the animals with xylazine (1–2 mg/kg s.q.) followed after several minutes by ketamine (50–65 mg/kg i.p.). We gave atropine (0.05 mg/kg i.m.) to control mucous secretions and applied eye ointment to prevent drying of the eyes. We held animals in position with a stereotaxic device and maintained their body temperature at 37 degrees C using a feedback controlled heating pad (Harvard Apparatus 50–7220F). We gave supplemental injections of ketamine (20–30 mg/kg i.p.) as needed to maintain an areflexic state. The degree of sensorineural hearing loss, as estimated from auditory brainstem response thresholds using previously published methods employed in our lab13, was 13.1 ± 2.6 dB at 500 Hz, 19.8 ± 4.4 dB at 1 kHz, 22.4 ± 7.7 dB at 2 kHz, 14.4 ± 9.4 dB at 4 kHz, and 6.5 ± 5.2 dB at 8 kHz (means ± SD; N = 5). Elevation of ABR thresholds due to the noise exposure was 10–20 dB less than elevation of auditory-nerve fiber thresholds at the same frequency, consistent with previous reports13,14.
Neurophysiological experiments
We recorded neurophysiological data from auditory nerve fibers under anesthesia. We tested animals with sensorineural hearing loss 4–8 weeks after the noise exposure. We anesthetized the animals initially with xylazine and ketamine as described above, but maintained anesthesia with sodium pentobarbital (~15 mg/kg/2 hr i.v.) for neurophysiological recordings. We also gave physiological saline (2–3 ml/2 hr i.v.) and lactated ringers (20–30 ml/24 hr s.q.), and performed a tracheotomy to facilitate breathing. We positioned the animals in a stereotaxic device in a sound-attenuating booth. We transected the skin and muscles overlying the skull to expose the ear canals and bullae, and dissected both ear canals to allow insertion of hollow ear bars. We vented the right bulla through 30 cm of polyethylene tubing. We opened a craniotomy in the posterior fossa, partially aspirated the cerebellum, and retracted the cerebellum medially to expose the trunk of the auditory nerve. We presented acoustic stimuli through the right ear bar with a dynamic loudspeaker (Beyerdynamic DT48) and calibrated stimuli using a probe microphone placed within a few mm of the tympanum (Etymotic ER7C). We made neurophysiological recordings using a 10–30 MΩ glass microelectrode advanced into the auditory nerve bundle by a hydraulic micro-drive (Kopf 640). We amplified (Dagan 2400A) and band-pass filtered recordings from 0.03–6 kHz (Krohn-Hite 3550). We identified spikes using a time-amplitude window discriminator (BAK Electronics) and recorded their timing with 10-μs resolution.
We isolated single fibers by listening for spikes while advancing the electrode through the auditory nerve during repeated broadband-noise acoustic stimulation. When a fiber was encountered, we recorded a tuning curve using an automated algorithm that tracked, as a function of stimulus frequency, the minimum SPL of a 50-ms tone required to evoke at least 1 more spike than a subsequent 50-ms silent period15. Next, we recorded spike-train responses to pure tone stimuli presented in quiet and in three levels of Gaussian background noise. We recorded 40 spike-train responses for each condition. Pure tones were 600 ms in duration; we presented tones once per second with a frequency equal to the fiber's characteristic frequency and level 30 dB above the fiber's minimum threshold in quiet. We gated background noise (20 kHz bandwidth) on and off with the tones at RMS levels of 10, 15, and 20 dB above the level of the tone. We quantified temporal coding under each condition by calculating the vector strength of phase locking to the tone frequency from the period histogram of the spike-train response computed with 64 bins per stimulus cycle9. We computed vector strength as the ratio of the 2nd and 1st coefficients of the Fourier transform of the period histogram.
Statistical analysis
We analyzed the effects of noise exposure and masking level on the vector strength of phase locking to tones using a repeated-measures mixed model analysis. The analysis included group (noise-exposed vs. control) and masking level as categorical independent variables and an interaction term between group and masking level. The analysis also included fiber identity as a categorical random effect and log-transformed characteristic frequency as a continuous random effect. We evaluated the effects of the independent variables on vector strength using F-tests and pairwise comparisons of least squares means.
We analyzed the relationship between tuning curve bandwidth and vector strength of phase locking using linear regression of characteristic frequency-normalized variables. We calculated characteristic frequency-normalized bandwidth as the octave difference between the observed bandwidth and the mean bandwidth of control fibers of the same CF, and characteristic frequency-normalized vector strength as the observed vector strength divided by the mean vector strength of control fibers of the same CF. We conducted separate analyses for each masking level and evaluated statistical significance using T-tests of the estimated slopes.
ACKNOWLEDGEMENTS
We thank J. Boley and M. Walls for assisting with surgeries and K. Kluender and E. Davies-Venn for providing feedback on a previous draft of the manuscript. This research was supported by NIH grants R01-DC009838 to M.G.H. and F32-DC012236 to K.S.H. from the National Institute on Deafness and Other Communication Disorders.
Footnotes
AUTHOR CONTRIBUTIONS K.S.H. and M.G.H. designed the experiments. K.S.H. collected and analyzed the data and wrote the paper with contribution from M.G.H.
COMPETING FINANCIAL INTERESTS
The authors declare no competing financial interests.
SUPPLEMENTARY INFORMATION
None.
REFERENCES
- 1.Lorenzi C, Gilbert G, Carn H, Garnier S. Moore B.C.J. Proc. Natl. Acad. Sci. USA. 2006;103:18866–18869. doi: 10.1073/pnas.0607364103. [DOI] [PMC free article] [PubMed] [Google Scholar]
- 2.Moore BCJ, Glasberg BR, Hopkins K. Hear. Res. 2006;222:16–27. doi: 10.1016/j.heares.2006.08.007. [DOI] [PubMed] [Google Scholar]
- 3.Lorenzi C, Debruille L, Garnier S, Fleuriot P, Moore BCJ. J. Acoust. Soc. Am. 2009;125:27–30. doi: 10.1121/1.2939125. [DOI] [PubMed] [Google Scholar]
- 4.Harrison RV, Evans EF. Arch Otorhinolaryngol. 1979;224:71–78. doi: 10.1007/BF00455226. [DOI] [PubMed] [Google Scholar]
- 5.Woolf NK, Ryan AF, Bone RC. Hear. Res. 1981;4:335–346. doi: 10.1016/0378-5955(81)90017-4. [DOI] [PubMed] [Google Scholar]
- 6.Miller RL, Schilling JR, Franck KR, Young ED. J. Acoust. Soc. Am. 1997;101:3602–3616. doi: 10.1121/1.418321. [DOI] [PubMed] [Google Scholar]
- 7.Kale S, Heinz MG. J. Assoc. Res. Otolaryngol. 2010;11:657–673. doi: 10.1007/s10162-010-0223-6. [DOI] [PMC free article] [PubMed] [Google Scholar]
- 8.Liberman MC, Dodds LW. Hear. Res. 1984;16:55–74. doi: 10.1016/0378-5955(84)90025-x. [DOI] [PubMed] [Google Scholar]
- 9.Johnson DH. J. Acoust. Soc. Am. 1980;68:1115–1122. doi: 10.1121/1.384982. [DOI] [PubMed] [Google Scholar]
- 10.Kujawa SG, Liberman MC. J. Neurosci. 2009;29:14077–14085. doi: 10.1523/JNEUROSCI.2845-09.2009. [DOI] [PMC free article] [PubMed] [Google Scholar]
- 11.Moore BCJ. J. Assoc. Res. Otolaryngol. 2008;9:399–406. doi: 10.1007/s10162-008-0143-x. [DOI] [PMC free article] [PubMed] [Google Scholar]
- 12.Wilson RH, McArdle RA, Smith SL. J. Speech Lang. Hear. Res. 2007;50:844–856. doi: 10.1044/1092-4388(2007/059). [DOI] [PubMed] [Google Scholar]
- 13.Henry KS, Kale S, Scheidt RE, Heinz MG. Hear. Res. 2011;280:236–244. doi: 10.1016/j.heares.2011.06.002. [DOI] [PMC free article] [PubMed] [Google Scholar]
- 14.Ngan EM, May BJ. Hear. Res. 2001;156:44–52. doi: 10.1016/s0378-5955(01)00264-7. [DOI] [PubMed] [Google Scholar]
- 15.Chintanpalli A, Heinz MG. J. Acoust. Soc. Am. 2007;122:EL203–EL209. doi: 10.1121/1.2794880. [DOI] [PMC free article] [PubMed] [Google Scholar]


