

Abstract
In Alzheimer disease (AD), the perturbation of the endoplasmic reticulum (ER) calcium (Ca2+) homeostasis has been linked to presenilins, the catalytic core in γ-secretase complexes cleaving the amyloid precursor protein (APP), thereby generating amyloid-β (Aβ) peptides. Here we investigate whether APP contributes to ER Ca2+ homeostasis and whether ER Ca2+ could in turn influence Aβ production. We show that overexpression of wild-type human APP (APP695), or APP harboring the Swedish double mutation (APPswe) triggers increased ryanodine receptor (RyR) expression and enhances RyR-mediated ER Ca2+ release in SH-SY5Y neuroblastoma cells and in APPswe-expressing (Tg2576) mice. Interestingly, dantrolene-induced lowering of RyR-mediated Ca2+ release leads to the reduction of both intracellular and extracellular Aβ load in neuroblastoma cells as well as in primary cultured neurons derived from Tg2576 mice. This Aβ reduction can be accounted for by decreased Thr-668-dependent APP phosphorylation and β- and γ-secretases activities. Importantly, dantrolene diminishes Aβ load, reduces Aβ-related histological lesions, and slows down learning and memory deficits in Tg2576 mice. Overall, our data document a key role of RyR in Aβ production and learning and memory performances, and delineate RyR-mediated control of Ca2+ homeostasis as a physiological paradigm that could be targeted for innovative therapeutic approaches.
Introduction
Alzheimer's disease (AD) is the most common neurodegenerative disorder leading to dementia. Extracellular senile plaques, intracellular neurofibrillary tangles, and neuronal loss represent the main histological hallmarks of AD. Amyloid-β (Aβ) peptides, the main components of senile plaques, result from the sequential endoproteolytic cleavage of amyloid precursor protein (APP) by β-secretase (BACE-1) and the presenilin (PS)-dependent γ-secretase complex (Checler, 1995). An increased level of Aβ is considered a key event contributing to AD etiology. As a support of the amyloid cascade hypothesis, most of the mutations in APP and PS1/PS2 responsible for early-onset familial AD (FAD) modulate Aβ production (Bekris et al., 2010).
Calcium (Ca2+) is one of the most important and versatile second messengers in cell signaling. In the nervous system, Ca2+ ions play crucial roles in neurotransmitter synthesis and release, signal transmission, dendrite growth, spine formation, regulation of gene expression, as well as in synaptic plasticity (Berridge et al., 2003). The ability of neurons to regulate the influx, efflux, and subcellular compartmentalization of Ca2+ appears compromised in AD (Bezprozvanny and Mattson, 2008). Importantly, one of the main changes observed in AD is a rise in the amount of Ca2+ being released from the endoplasmic reticulum (ER) stores. Aβ enhances Ca2+ release from the ER through both the inositol 1,4,5-triphosphate receptor (IP3R) and the ryanodine receptors (RyR) (Ferreiro et al., 2004). FAD-linked PS1 and PS2 mutations trigger abnormal ER Ca2+ homeostasis by potentiating IP3- and RyR-evoked Ca2+ liberation, and decreasing ER Ca2+ uptake (Leissring et al., 1999; Stutzmann et al., 2004, 2006; Cheung et al., 2008; Green et al., 2008; Brunello et al., 2009). However, the role of PS in ER Ca2+ leakage is debated (Tu et al., 2006; Shilling et al., 2012).
Conversely, it was also reported that Ca2+ homeostasis may influence APP pathophysiological processing. Therefore, Aβ production is enhanced by elevation of intracellular [Ca2+] (Buxbaum et al., 1994; Querfurth and Selkoe, 1994) or increased RyR-mediated Ca2+ release (Querfurth et al., 1997), and is reduced in IP3R-deficient lines (Cheung et al., 2008).
While perturbations of Ca2+ homeostasis have been largely described in PS models, fewer studies have focused on the direct impact of APP on Ca2+ homeostasis (Leissring et al., 2002; Lopez et al., 2008; Rojas et al., 2008; Niu et al., 2009). Nevertheless, the characterization of subcellular Ca2+ signaling dysregulation in APP-expressing models and the possible implication of RyR in APP-mediated Ca2+ alteration have not been reported before. In addition, the blockade of RyR as a mean to modulate APP metabolism and Aβ production has not been investigated.
We provide here evidence that enhanced RyR-mediated Ca2+ release occurs in the SH-SY5Y neuroblastoma cell line stably overexpressing either wild-type (WT) human APP (APP695) or APP harboring the Swedish double mutation (K670N/M671L; APPswe), and in primary neurons from APPswe-expressing mice (Tg2576). Interestingly, blockade of RyR-mediated Ca2+ release by dantrolene reduces Aβ production in vitro, in both the SH-SY5Y model and Tg2576 primary neurons. Moreover, dantrolene diminishes Aβ load, reduces Aβ-related histological lesions, and slows down learning and memory deficits in Tg2576 mice. Together, our data demonstrate that ER Ca2+ dysregulation acts as an amplification pathway in the Aβ cascade and identify RyR as a target of Ca2+ pathology linked to AD.
Materials and Methods
Chemicals.
Dantrolene, SB415286 (3-[(3-Chloro-4-hydroxyphenyl)amino]-4-(2-nitrophenyl)-1H-pyrrole-2,5-dione), roscovitine (1,9-Pyrazoloanthrone, Anthrapyrazolone), SP600125, caffeine, and carbamoylcholine chloride were purchased from Sigma Aldrich.
Antibodies.
Aβ, C99, and total APP were detected using the 6E10 antibody (Covance) recognizing residues 1–16 of Aβ. Aβ was also detected using FCA18 antibody, recognizing free Asp1 residue of Aβ1-x peptides (Barelli et al., 1997). Total APP was detected using APP N-terminal antibody (22C11; Millipore) recognizing residues 66–81 of APP, or APP C-terminal antibody (Sigma Aldrich) recognizing residues 676–695 of APP. Phosphorylated APP (P-APP) was detected using P-APP antibody (Thr-668) (Cell Signaling Technology). Other antibodies directed toward the following proteins were as follows: GADPH (glyceraldehyde-3-phosphate dehydrogenase; Millipore); PSD-95, sarco/endoplasmic reticulum Ca2+-ATPase 2B (SERCA2B), Aph1, RyR1, RyR2, and RyR3 (Pierce); β-actin, IP3R1, IP3R2, and IP3R3 (Santa Cruz Biotechnology); BACE-1 and CytP450 (Abcam); SNAP-25 (Covance); Vamp-2 (Synaptic Systems); synapsin I and II and synaptotagmin (Stg; developed by F.B.); nicastrin (Sigma Aldrich); and PS1 (a generous gift from G. Thinakaran, University of Chicago, Chicago, IL).
Cell culture and infection.
Human SH-SY5Y neuroblastoma cells (CRL-2266; American Type Culture Collection, Manassas, VA) were cultured following manufacturer's instructions. SH-SY5Y cells stably expressing pcDNA3.1, APPswe, or APP695 constructs were generated following standard protocols and maintained in the presence of 400 μg geneticin (Gibco).
For subcellular Ca2+ analyses, 150,000 cells were spotted on 13 mm coverslips and placed 24 h later in contact with the appropriate adenoviral system expressing cytosolic (AdCMVcytAEQ)- or ER (AdCMVerAEQ)-targeted aequorin (AEQ) probes as described previously (Chami et al., 2008).
Cell treatments and immunoblotting.
APPswe- and APP695-expressing SH-SY5Y cells and primary cultured neurons were treated over night (20 h) with, respectively, 50 or 1 μm dantrolene or vehicle (DMSO). Protein extracts were prepared using lysis buffer (50 mm Tris, pH 8, 10% glycerol, 200 mm NaCl, 0.5% Nonidet P-40, and 0.1 mm EDTA) supplemented with Complete protease inhibitors (Roche Diagnostics).
To detect Aβ peptide, 40 μg of the total proteins were incubated with 70% formic acid (Sigma) and Speed Vac evaporated for 40 min. The pellets were dissolved in 1 m Tris, pH 10.8, and 25 mm betaine and diluted in 2× Tris-tricine loading buffer (125 mm Tris-HCl, pH 8.45, 2% SDS, 20% glycerol, 0.001% bromophenol blue, and 5% β-mercaptoethanol). Proteins were resolved by 16.5% Tris-tricine SDS-PAGE, transferred onto nitrocellulose membranes, and incubated overnight with specific antibodies as specified in figure legends. All the other proteins were detected on total extracts resolved by SDS-PAGE following standard procedures.
Microsomal fraction preparation.
Cells were harvested by trypsinization and centrifuged at 600 × g for 10 min at 4°C. The pellets were resuspended in 1 ml isolation buffer [250 mm d-mannitol, 5 mm HEPES, pH 7.4, 0.5 mm EGTA, and 0.1% bovine serum albumin (BSA)] supplemented with protease inhibitor mixture. After chilling on ice for 20 min with frequent tapping, cells were disrupted by at least 200 strokes of a glass Dounce homogenizer, and the homogenate was centrifuged at 1500 × g at 4°C to remove unbroken cells and nuclei. The supernatant was centrifuged at 100,000 × g at 4°C for 1 h. The pellet containing the microsomal fraction was suspended in 0.25 m sucrose, and 10 mm Tris-HCl, pH 7.4, supplemented with protease inhibitors.
Detection of extracellular Aβ.
Culture medium without serum was supplemented with protease inhibitors, 1 mm PMSF, and 0.1% BSA. After a brief centrifugation, supernatants were mixed with equal volumes of 20% trichloroacetic acid (TCA), incubated at 4°C for 30 min, and then centrifuged at 18,000 × g for 15 min at 4°C. Pellets were washed with ice-cold acetone, centrifuged at 10,000 × g for 5 min at 4°C, and then dried and dissolved with RIPA buffer (50 mm Tris-HCl, pH 8, 150 mm NaCl, 1% NP-40, 0.5% sodium deoxycholate, and 0.1% SDS) supplemented with protease inhibitors. Aβ content was assessed by 10–20% Tris-tricine SDS-PAGE (Invitrogen).
The concentrations of Aβ40 and Aβ42 were measured in the culture medium by using the respective ELISA kits (Invitrogen) following the manufacturer's instructions.
Calcium measurements.
CytAEQ was reconstituted with 5 μm coelenterazine for 2 h in Krebs–Ringer modified buffer (KRB) containing the following (in mm): 125 NaCl, 5 KCl, 1 Na3PO4, 1 MgSO4, 5.5 glucose, and 20 HEPES, pH 7.4, supplemented with 1 mm CaCl2 at 37°C. Cytosolic Ca2+ signals were obtained upon application of 500 μm carbamoylcholine chloride, 135 mm KCl, or 30 mm caffeine.
For reconstitution with high efficiency of the erAEQ, the luminal [Ca2+] of this compartment was first reduced by incubating cells for 1 h at 4°C in KRB supplemented with 5 μm n-coelenterazine, 1 μm ionomycin, and 600 μm EGTA. After this incubation, cells were washed extensively with KRB supplemented with 2% BSA before the luminescence measurement was initiated. The ER was refilled by exposing cells to 1 mm extracellular CaCl2. All aequorin measurements were performed in a purpose-built luminometer. The experiments were terminated by lysis of cells with 100 μm digitonin in a hypotonic Ca2+-rich solution (10 mm CaCl2, H2O) to discharge the remaining aequorin pool. The light signal was collected and calibrated into [Ca2+] values, as previously described (Chami et al., 2008). After reaching the steady state value, cells were perfused with (50 μm) 2,5-Di-(tert-butyl)-1,4-benzohydroquinone (tBuBHQ), thus blocking SERCA pump and activating passive ER Ca2+ leakage.
Fura-2 AM Ca2+ measurements were performed as described previously (Bisaillon et al., 2010). Briefly, cells were loaded with 4 μm fura-2 AM (Invitrogen). Cells were then washed and bathed in HEPES-buffered HBSS containing (in mm) 140 NaCl, 1.13 MgCl2, 4.7 KCl, 2 CaCl2, 10 d-glucose, and 10 HEPES, pH 7.4, for 10 min before Ca2+ was measured. Fluorescence images of several cells were recorded and analyzed with a digital fluorescence imaging system (InCyt Im2; Intracellular Imaging). Fura-2 AM fluorescence was collected at 510 nm upon alternate excitation at 340 and 380 nm, and the ratio of fluorescence in response to 340 nm excitation to that in response to 380 nm excitation was obtained on a pixel-by-pixel basis and represented as raw data.
Whole-cell patch-clamp experiments.
Standard whole-cell patch-clamp recordings were performed using an Axopatch 200B and Digidata 1440A (Molecular Devices) as described previously (Zhang et al., 2011). Clampfit 10.1 software was used for data analysis. Pipettes were pulled from borosilicate glass capillaries (World Precision Instruments) with a P-97 flaming/brown micropipette puller (Sutter Instrument) and polished with DMF1000 (World Precision Instruments) to a resistance of 2–4 MΩ when filled with pipette solutions containing the following (in mm): 145 Cs-methanesulfonate, 20 Cs-1,2-bis-(2-aminophenoxy)ethane-N,N,N′,N′-tetraacetic acid (Cs-BAPTA), 8 MgCl2, and HEPES, pH adjusted to 7.2 with CsOH. Immediately before the experiments, cells were washed with bath solution containing the following (in mm): 110 TEA-Cl, 10 CsCl, 10 HEPES, and 10 CaCl2, pH was adjusted to 7.4 with CsOH. Only cells with tight seals (>16 GΩ) were selected for break in. Whole-cell currents were recorded every 2 s with a standard voltage ramp from −140 to 40 mV (lasting 180 ms) from a holding potential of −80 mV. Currents were low-pass filtered at 5 kHz and sampled at a rate of 10 kHz.
Neuronal cell cultures.
Primary cultured neurons were obtained from individual e17 mice and then plated separately and genotyped for the presence of APP695 transgene by PCR. Cortices and hippocampi were dissected and digested in 0.125% trypsin-HEPES-buffered saline solution for 30 min. Cells were seeded onto poly-l-lysine-coated tissue culture plates or glass coverslips. Cultures were incubated at 37°C, 5% CO2 in Neurobasal medium (Invitrogen) supplemented with B-27. Medium was changed after 4 h with Neurobasal containing B-27 supplemented with 0.1% glutamine and 1% penicillin–streptomycin.
In vitro β-secretase assay.
β-secretase activity was monitored using the β-secretase activity assay kit (Biovision). Briefly, 5,000,000 cells were lysed in ice-cold extraction buffer and centrifuged at 10,000 × g for 5 min. The supernatant (50 μg) was then incubated in the presence of BACE-1 substrate at 37°C in the presence or absence of 50 μg BACE-1 inhibitor JMV2764 (Ac-RQIKIWFQNRRNle-KWKK-ahx-EVN-AHPPA-AEF-NH2) (Buggia-Prevot et al., 2008). BACE-1 activity corresponds to the JMV2764-sensitive fluorescence recorded at 320 nm (excitation) and 420 nm (emission) wavelengths.
In vitro γ-secretase assay.
In vitro γ-secretase assay was assessed as described previously (Sevalle et al., 2009). Intact cell pellets were suspended in 10 mm Tris, pH 7.5, supplemented with protease inhibitor mixture and subjected to repeated passages through a 25G needle. Homogenates were first centrifuged at 800 × g for 10 min at 4°C, and the resulting supernatant was subjected to an additional 20,000 × g centrifugation for 1 h at 4°C. Membrane-containing pellets were then resuspended in solubilization buffer [150 mm sodium citrate, pH 6.4, containing 3-[(3-cholamydopropyl) dimethylammonio]-2-hydroxy-1-propanesulfonate 1% (v/v)] supplemented with protease inhibitor mixture. All steps were performed at 4°C. Solubilized membranes (1 mg/ml) were diluted once with sodium citrate buffer (150 mm, pH 6.4) and with reaction buffer (150 mm sodium citrate, pH 6.4, 20 mm dithiothreitol, 0.2 mg/ml BSA, 1 mg/ml egg phosphatidyl choline, and 50 μg/ml recombinant C100-Flag). The resulting reaction mix was then either incubated over constant agitation for 16 h at 37°C or stored at 4°C (negative controls). Samples were then supplemented with 2× Tris-tricine loading buffer, boiled for 5 min, and subjected to Western blot for Aβ analysis using 16.5% Tris-tricine SDS-PAGE.
Quantitative real-time PCR.
Total RNA was isolated using NucleoSpin RNA II (Macherey-Nagel) according to the manufacturer's protocol. Total RNA extraction form the cortex of WT and Tg2576 mice was isolated using RNAeasy lipid tissue (Qiagen) according to the manufacturer's protocol. cDNA was synthesized from 2 μg of total RNA and random primers using the GoScript Reverse Transcription System kit (Promega). Target gene expression was analyzed by real-time PCR using Corbett Rotor-Gene 6000 (Invitrogen) and SYBR Green (Roche Applied Sciences). Cycling parameters were as follows: 20 s at 95°C, 20 s at 60°C, and 20 s at 72°C for 55 cycles. Primer sequences for human RyR isoforms were as follows: RyR1 forward, 5′-GCATGGCTTCGAGACTCAC-3′; RyR1 reverse, 5-′CATCTTCCAGACATAAGACTCCTG-3′; RyR2 forward, 5-'TGCTGGCTTGGGGCTGGAG-3′; RyR2 reverse, 5′-ACCATGGGCAGCGTCCACAG-3′; RyR3 forward, 5′-GACATGCGAGTCGGCTGGGC-3′; RyR3 reverse, 5′-GATGCCAACGCTGGCCCCTG-3′. Human β-Actin was used as control gene.
Primer sequences for mouse RyR isoforms were as follows: RyR1 forward, 5′-TCTTCCCTGCTGGAGACTGT-3′; RyR1 reverse, 5′-GTGGAGAAGGCACTTGAGG-3′; RyR2 forward, 5′-TCAAACCACGAACACATTGAGG-3′; RyR2 reverse, 5′-AGGCGGTAAAACATGATGTCAG-3′; RyR3 forward, 5′-CTGGCCATCATTCAAGGTCT-3′; RyR3 reverse, 5′-GTCTCCATGTCTTCCCGTA-3′. Mouse GAPDH was used as control gene.
Transgenic mice and dantrolene treatment.
Experiments were performed in accordance with the European Community (86/609/EEC) directives regulating animal research, the Italian Ministry of Health (DL 116/92; DL 111/94-B), and the Institut Fédératif de Recherche Necker-Enfants Malades Animal Care and Use Committee. Tg2576 mice were developed by Hsiao et al. (1996) and carry human APP695 cDNA with the Swedish double mutation at positions (K670M→N671L) under the control of the hamster Prion promoter. The genotype of the mice was confirmed by PCR using DNA from tail tissues. Tg2576 mice and WT littermates of either sex between 12 and 15 months old were treated with 5 mg/kg dantrolene or with PBS (vehicle) by intraperitoneal injections twice a week during 3 months. All mice were weighed each month.
Dantrolene was freshly prepared in prewarmed PBS solution and subjected to brief sonication before injection. Dantrolene solution was mixed thoroughly before each injection. After 3 months of treatment, mice were subjected to behavioral testing and then killed. One half of the brains were immediately fixed in freshly depolymerized 4% paraformaldehyde and used for immunostaining. The other half of the brains were dissected to isolate cortices and hippocampi. Snap-frozen cortices were then homogenized to have a powder mixture that was used for protein and RNA isolation.
Immunohistochemical staining and quantification.
Brains were sectioned to an 8 μm thickness with a cryostat and stained for amyloid plaques. Slices were first washed with PBS and then incubated in formic acid for 6 min and then in H2O2 for 15 min. Nonspecific sites were saturated in PBS, 0.05% Tween, and 5% BSA for 1 h. Slides were incubated overnight with primary antibodies (6E10, 1:1000 or FCA18, 1:500) prepared in PBS, Tween 0.025%. After washes, sections were incubated with secondary HRP-conjugated (1:1000; Jackson Laboratories) or Alexa 488-fluorescent antibodies (1:1000; Invitrogen) at room temperature for 1 h. Fluorescent slides were incubated for 5 min with DAPI (Roche; 1:20,000). Slides with HRP-conjugated antibodies were incubated with DAB-impact (Vector Laboratories), rinsed, and counterstained with cresyl violet. Images were captured using DM108 microscope (Leica) or an epifluorescence microscope (Axioplan2; Zeiss) under 10× and 20× magnification. Counting of Aβ plaques was performed on 15 serial slices from each animal blindly by two different researchers.
Morris water maze.
The water maze test was performed in a 1.2-m-diameter pool. A 10-cm-diameter platform was placed in the southwestern quadrant in the hidden trials as described previously (Morris, 1984). The procedure consisted of 5 d of hidden platform tests plus a probe trial 24 h after the last hidden platform test. In the hidden platform tests, mice were trained for four trials, with an intertrial interval of 10 min. After the probe test, mice were trained in a visible platform tests. In the visible platform test, mice were tested for four trials with an intertrial interval of 10 min. Tracking of animal movement was evaluated using an ANY-maze system (Ugo Basile).
Novel object recognition.
Novel object recognition (NOR) was performed in a 44 × 44 cm open-field chamber with opaque walls equipped with a digital video recording system as described previously (Bevins and Besheer, 2006). The objects used during the task were object Legos different in shape and color. Mice were first habituated to the chamber for 10 min, during which ANY-maze (Ugo Basile) software quantified various locomotor parameters and anxiety-related behavior, including total distance traveled, time spent moving ≥50 mm/s, and number of entries into and time spent in the central part of open-field chamber.
Twenty-four hours after the habituation session, each mouse was subjected to training in a 10 min session of exposure to two different objects in the open-field box. The time spent exploring each object was recorded using video tracking. Exploration consisted of any investigative behavior (i.e., head orientation, sniffing occurring within <1.0 cm) or deliberate contact that occurred with each object. After the training session, the animal was returned to its home cage. After 24 h retention interval, the animal was returned to the arena with one familiar object and a novel one. Objects were counterbalanced between sessions and animals, and were cleaned with 70% ethanol after each trial. The time spent in exploring each object was then measured. A discrimination index was calculated as follows: object discrimination = novel object exploration time/(familiar object exploration time + novel object exploration time) × 100.
Animals that spent <20 s exploring the objects during the 10 min test session were omitted from the analysis.
Statistical analyses.
Results are reported from at least three different experiments. Statistical analyses were done using t tests or one-way or two-way ANOVA. Bonferroni's, Dunnet's, or Tukey's multiple comparison post hoc analyses were subsequently performed on ANOVA results to determine significance.
Results
Cytosolic Ca2+ signaling is increased in APPswe- and APP695-expressing SH-SY5Y neuroblastoma cells
We set up neuroblastoma SH-SY5Y cell lines stably overexpressing APP695 or APPswe (Fig. 1A). Both APP695- and APPswe-overexpressing cells yield increased levels of C99 (issued from cleavage by β-secretase; Fig. 1A) and of Aβ40 and Aβ42 peptides [issued from sequential cleavages by β- and γ-secretases; Aβ42 (in pg/μg of protein): 21.6 ± 2.9, n = 10 and 20.5 ± 2.4, n = 13 in APPswe- and APP695-expressing cells, respectively, vs 1.6 ± 0.5, n = 11 in mock-transfected cells; Aβ40 (pg/μg of protein): 229 ± 46, n = 5 and 160 ± 27, n = 9 in APPswe- and APP695-expressing cells, respectively, vs 17 ± 3, n = 6 in mock-transfected cells; Fig. 1B].
Figure 1.
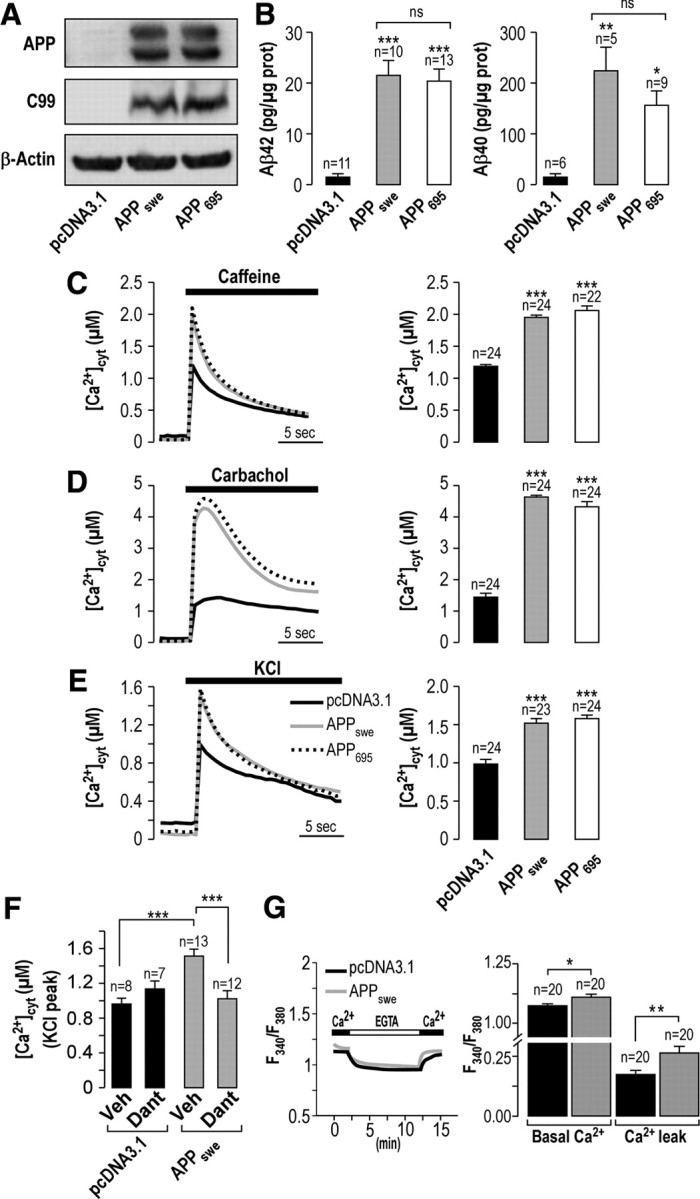
APP695- and APPswe-expressing SH-SY5Y cells display increased C99 and Aβ production and altered cytosolic Ca2+ signals. A, Western blot showing the expression of APP and C99 fragment in SH-SY5Y cells stably transfected with mock vector pcDNA3.1 or with APPswe or APP695 constructs. β-Actin was used as a loading control. B, Secretion of Aβ42 and Aβ40 peptides in pcDNA3.1-, APP695-, and APPswe-expressing SH-SY5Y cells as measured by ELISA and normalized to proteins contents (in picograms per micrograms of protein). C–F, Cytosolic Ca2+ signals were obtained using AdCMVcytAEQ upon stimulation with caffeine (30 mm) (C), carbachol (500 μm) (D), or KCl (135 mm) (E, F). F, PcDNA3.1- and APPswe-expressing SH-SY5Y cells were pretreated with dantrolene (50 μm) or with vehicle (DMSO) for 10 min and stimulated with KCl (135 mm) in the presence or not of dantrolene. Representative curves and graph of the mean of the peak [Ca2+]cyt values (in micromolar) ± SEM are shown. The p values were calculated versus pcDNA3.1 or as indicated versus APPswe-expressing cells or pcDNA3.1- or APPswe-expressing cells treated with vehicle using one-way ANOVA and Dunnett's multiple comparison post hoc test. *p < 0.05; **p < 0.01; ***p < 0.001. ns, Nonsignificant. G, PcDNA3.1- and APPswe-expressing SH-SY5Y cells were loaded with fura-2 AM fluorescent dye (4 μm). Cells were first placed in Ca2+-rich HBSS and then successively incubated in Ca2+-free HBSS including 1 mm EGTA, and then Ca2+-rich HBSS was restored to the bath solution. Representative curves of PcDNA3.1- and APPswe-expressing SH-SY5Y cells and the graph of the mean (F340/F380) ± SEM of the plateau values of basal (before EGTA application) and Ca2+ entry “Ca2+ leak” (upon Ca2+ addition) are shown. The plateau values of Ca2+ entry in the graph correspond to plateau values upon Ca2+ addition minus plateau values in EGTA. The p values were calculated versus pcDNA3.1 using t tests. n, Number of cells analyzed.
We analyzed Ca2+ release from the ER by using a cytosolic Ca2+-based aequorin probe (Chami et al., 2008). We first examined RyR-mediated Ca2+ release upon cell stimulation with the RyR agonist caffeine (30 mm) (Riddoch et al., 2005). As shown in Figure 1C, caffeine elicits a fast and large Ca2+ transient that was amplified in APPswe- and APP695-expressing cells compared to control (peak, 1.96 ± 0.05 μm, n = 24 and 2.09 ± 0.04 μm, n = 22, respectively, vs 1.19 ± 0.02 μm, n = 24 in control) (Fig. 1C). We next investigated cytosolic Ca2+ signal upon stimulation of Ca2+ release through the IP3R. It was reported previously that the stimulation of SH-SY5Y cells with the muscarinic agonist carbamoylcholine chloride (carbachol) caused a cytosolic Ca2+ response mainly mediated by Ca2+ release from IP3-sensitive stores (van Acker et al., 2000). Accordingly, carbachol (500 μm) application triggers a transient increase in cytosolic Ca2+, the extent of which was significantly larger in APPswe- and APP695-expressing cells compared to control (peak, 4.63 ± 0.07 μm, n = 24 and 4.30 ± 0.05 μm, n = 24 respectively, vs 1.34 ± 0.03 μm, n = 24 in control; Fig. 1D).
The influx of extracellular Ca2+ through the plasma membrane also participates to the increase of cytosolic [Ca2+]. We therefore investigated the contribution of voltage-gated Ca2+ channel (VGCC)-mediated Ca2+ entry. The application of KCl (135 mm) triggers membrane depolarization leading to the opening of VGCCs, thereby inducing Ca2+ entry into the cytosol. Figure 1E shows a significant increase in KCl-evoked Ca2+ entry in APPswe- and APP695-expressing cells compared to control (peak, 1.51 ± 0.05 μm, n = 23 and 1.57 ± 0.08 μm, n = 24 respectively, vs 0.98 ± 0.05, n = 24 in control; Fig. 1E). VGCC-mediated Ca2+ entry may trigger Ca2+ release from internal stores through a mechanism known as Ca2+-induced Ca2+ release (CICR). To investigate CICR, we used dantrolene, a well-characterized antagonist of RyR channels (Muehlschlegel and Sims, 2009), and measured Ca2+ entry upon application of KCl (135 mm). Since APP695- and APPswe-expressing cells harbor the same alteration of Ca2+ signals (Fig. 1C–E), we performed these analyses on APPswe-expressing cells only. The results show that VGCC-mediated Ca2+ entry is reduced upon dantrolene treatment in APPswe-expressing SH-SY5Y cells but not in pcDNA3.1-expressing cells (Fig. 1F). These data led us to conclude that RyR-mediated Ca2+ signals contribute through the CICR mechanism to increased VGCC-mediated Ca2+ entry in APPswe-expressing SH-SY5Y cells.
We also investigated Ca2+ influx through voltage-independent plasma membrane Ca2+ channels. Control and APPswe-expressing cells were incubated in EGTA-rich solution to buffer extracellular Ca2+ followed by restoration of a Ca2+-rich solution to the extracellular milieu, thereby assessing basal Ca2+ entry across the plasma membrane. We noticed that APPswe-expressing cells harbor increased basal [Ca2+] illustrated by higher basal plateau values before the application of EGTA solution (F340/F380, 1.111 ± 0.009, n = 20 vs 1.075 ± 0.008, n = 20 in control) and larger Ca2+ entry revealed by an increased plateau value reached upon addition of Ca2+-rich solution (F340/F380, 0.263 ± 0.027, n = 20 vs 0.170 ± 0.020, n = 20 in control; Fig. 1G).
Together, these data reveal that APP overexpression determines an increase of cytosolic Ca2+ signals due to combined increased Ca2+ release from the ER through IP3R and RyR (Fig. 1C,D), and enhanced Ca2+ entry through voltage-dependent and voltage-independent plasma membrane Ca2+ channels (Fig. 1E,G). Nevertheless, we show that elevated VGCC-mediated Ca2+ signals in APPswe-expressing SH-SY5Y cells are a consequence of CICR through RyR (Fig. 1F).
The loading capacity of the ER is reduced in APPswe- and APP695- expressing SH-SY5Y neuroblastoma cells
Increased Ca2+ release from the ER through IP3R and RyR could be associated with altered ER Ca2+ loading capacity. We investigated ER Ca2+ content by using Ca2+-based aequorin probe targeted to the ER (Chami et al., 2008). We measured the ER Ca2+ load capacity upon application of 1 mm CaCl2-rich solution. As shown in Figure 2A, ER Ca2+ loading is reduced in APPswe-expressing cells compared to control (plateau, 166.0 ± 3.7 μm, n = 15 vs 245.0 ± 15.8 μm, n = 21 respectively; Fig. 2A). The analysis of ER Ca2+ uptake capacity (ascending slope phase of the curve) did not reveal any difference between control and APPswe-expressing cells, thus ruling out a possible alteration of the activity of SERCA (uptake, 11.5 ± 0.4 μm/s, n = 15 in APPswe-expressing cells vs 9.3 ± 0.9 μm/s, n = 21 in control). We also analyzed the ER Ca2+ passive leak upon SERCA inhibition by tBuBHQ. As displayed in Figure 2B, APPswe-expressing cells show an increased Ca2+ leakage from the ER compared to control cells (as revealed by increased slope, 0.85 ± 0.03 μm/s, n = 15 in APPswe-expressing cells vs 0.51 ± 0.02 μm/s, n = 21 in control) (Fig. 2B). These data demonstrate that the reduced Ca2+ loading capacity in APPswe-expressing cells is due to increased Ca2+ release through IP3R and RyR, and to elevated ER Ca2+ passive leakage.
Figure 2.

APPswe-expressing SH-SY5Y cells displays altered ER Ca2+ homeostasis and no change of the store operated Ca2+ channels function. A, ER Ca2+ analysis in pcDNA3.1- and APPswe-expressing cells as obtained by AdCMVerAEQ 48 h after infection. Representative traces of [Ca2+]ER in pcDNA3.1- and APPswe-expressing cells upon addition of 1 mm CaCl2 solution are shown. The graph represents the steady state [Ca2+]ER ± SEM, where pcDNA3.1-expressing cells are considered as 100%. The p value was calculated vs pcDNA3.1 using a t test. n, Number of experiments. B, After reaching the steady state value, cells were perfused with tBuBHQ (50 μm), thus blocking the SERCA pump and activating passive ER Ca2+ leakage. The time course of ER Ca2+ is presented as a percentage of the steady state value, considered as 100% in each condition. Results represent the mean ± SEM of different curves obtained from three different experiments. C, D, Ca2+ release by carbachol (C) or TG (D) and Ca2+ entry were recorded in pcDNA3.1- and APPswe-expressing SH-SY5Y cells using fura-2 AM. Where indicated, HBSS supplemented with 1 mm EGTA was replaced with Ca2+-rich HBSS in the absence or presence of 5 μm Gd3+ (an inhibitor of SOCE). Traces are representative curves from several independent experiments. The graph represents the mean of the peak of Ca2+ release values (F340/F380) and the plateau of Ca2+ entry values (F340/F380) ± SEM. The p values were calculated vs pcDNA3.1 using t tests. n, Number of analyzed cells. E, Whole-cell patch-clamp electrophysiology of ICRAC in pcDNA3.1- and APPswe- expressing SH-SY5Y cells activated by cell dialysis with 20 mm Cs-BAPTA through the patch pipette and subsequently inhibited by addition of 5 μm Gd3+ to the bath solution. Representative curves show data points taken at 100 mV from each ramp. F, I–V relationships of CRAC currents in pcDNA3.1- and APPswe-expressing SH-SY5Y cells are taken from traces in E where indicated by the black or gray color-coded asterisks. The graph shows the mean of ICRAC value (in picoamperes per picofarad) ± SEM. n, Number of analyzed cells. *p < 0.05; **p < 0.01; ***p < 0.001.
Increased Ca2+ entry in APPswe-expressing cells is not linked to altered function of store operated Ca2+ channels
It is known that depletion of ER Ca2+ activates Ca2+ influx through the plasma membrane, a mechanism known as store-operated Ca2+ entry (SOCE) (Smyth et al., 2010).
We investigated SOCE in APPswe-expressing cells upon ER Ca2+ depletion by carbachol-mediated IP3R Ca2+ release, or by thapsigargin (TG)-mediated SERCA blockade in the presence of EGTA (Fig. 2C,D respectively). Under these conditions, we confirm that Ca2+ release from intracellular stores is larger in APPswe-expressing cells than in controls [carbachol peak (F340/F380), 1.093 ± 0.049, n = 87 vs 0.409 ± 0.096, n = 83, respectively; TG peak (F340/F380), 0.306 ± 0.017, n = 96 vs 0.212 ± 0.029, n = 97, respectively; Fig. 2C,D). Upon carbachol- and TG-induced ER Ca2+ depletion, we notice that Ca2+-mediated SOCE is larger in APPswe-expressing cells than in control. Application of low concentrations of Gd3+ (5 μm; inhibitor of Orai-mediated Ca2+ entry) abolishes completely Ca2+ entry in both control- and APPswe-expressing cells, suggesting that SOCE in these cells is likely mediated by stromal interaction molecule/Orai signaling complexes, independently of transient receptor potential canonical channels. Surprisingly, Gd3+-mediated Ca2+ entry inhibition occurred with similar kinetics in APPswe-expressing cells and controls, suggesting that Ca2+ pumping mechanisms are similar in control and APPswe-expressing cells.
Since fura-2 measurements are prone to artifacts and a constitutive Ca2+ entry under certain conditions could be amplified by the Ca2+ off/Ca2+ on protocol routinely used to assess SOCE, we also measured ICRAC (Ca2+ release-activated Ca2+ current), the main non-voltage-gated SOCE current, using standard electrophysiological recordings as described previously (Potier et al., 2009). We show that passive store depletion by high concentrations (20 mm) of the fast chelator BAPTA activates an ICRAC current (sampled at −100 mV) with similar size and kinetics in APPswe-expressing cells and pcDNA3.1 control cells. Importantly, we notice that Gd3+-dependent ICRAC blockade occurs in a similar manner in pcDNA3.1- and APPswe-expressing cells (Fig. 2E). These data are further confirmed by representing the current–voltage (I–V) relationships from the ramp protocol wherein current density was evaluated at various membrane potentials (Fig. 2F).
These experiments demonstrate that APPswe-expressing cells manifest a larger SOCE upon store depletion and did not reveal any alteration of ICRAC. Therefore, we postulate that increased Ca2+ entry in APPswe-expressing cells is likely due to exaggerated unregulated basal Ca2+ entry, and that this increase is not due to enhanced SOCE and ICRAC.
Altered ER Ca2+ homeostasis in APPswe and APP695 SH-SY5Y cells is associated with increased expression of RyR
The experiments in Figures 1 and 2 reveal that ER Ca2+ homeostasis is largely deregulated in APPswe-expressing cells. Consequently, we focused our study on the molecular mechanisms underlying ER Ca2+ store emptying. We analyzed the expression of Ca2+ mobilizing proteins in this compartment, namely, RyR, IP3R, and SERCA2B. We noticed a higher expression of both IP3R and RyR in APPswe- and APP695-expressing cells (RyR, 2.2 ± 0.4 and 1.8 ± 0.5 fold increase, respectively, vs 0.8 ± 0.1 in control; IP3R 2.0 ± 0.2 and 1.9 ± 0.3 fold increase, respectively, vs 1.0 ± 0.1 in control; Fig. 3A). As expected from Ca2+ uptake experiments (Fig. 2A), no significant change in SERCA2B expression was observed in APPswe- and APP695-expressing cells (SERCA2B, 1.3 ± 0.1 and 1.2 ± 0.1 fold increase, respectively, vs 1.1 ± 0.2 in control; Fig. 3A). Since Tg2576 mice are characterized by a major accumulation of Aβ in the cortex, the same analyses were also performed on cortices isolated from 12- to 15-month-old Tg2576 mice and WT mice. Our data show that Tg2576 mice harbor an increased expression of RyR (1.5 ± 0.1 fold increase in Tg2576 mice, n = 4, vs 1.0 ± 0.1, n = 4, in WT mice), while the expression of IP3R is not significantly affected (Fig. 3B).
Figure 3.

APP695- and APPswe-expressing SH-SY5Y cells and Tg2576 mice show enhanced expression of RyR. A, Western blot analyses of RyR, IP3R, and SERCA2B expression revealed on microsomal fractions isolated from pcDNA3.1-, APP695-, and APPswe-expressing cells. The graph represents the means ± SEM of RyR, IP3R, and SERCA2B expression levels calculated versus CytP450 used as a loading control and presented versus the pcDNA3.1 expression level value, taken as 1. The p values were calculated versus pcDNA3.1 using one-way ANOVA and Dunnett's multiple comparison post hoc test. This result was obtained from at least three independent experiments. B, Western blot analyses of RyR and IP3R expression as revealed on total extracts isolated from cortices isolated from 12- to 15-month-old Tg2576 and WT mice. Each line corresponds to a different animal. The graph represents the means ± SEM of RyR and IP3R expression levels calculated vs β-actin used as a loading control and presented versus WT expression level value, taken as 1. The p value was calculated versus WT mice using t test. The experiment was performed on four to five mice for each group. C, Relative RyR1, RyR2, and RyR3 mRNA expression in pcDNA3.1-, APP695-, and APPswe-expressing cells quantified versus β-actin mRNA. Graphs represent the means ± SEM calculated versus pcDNA3.1-expressing cells taken as 1. The p values were calculated versus pcDNA3.1-expressing cells using one-way ANOVA and Dunnett's multiple comparison post hoc test. This result was obtained from three independent experiments. D, Relative RyR1, RyR2, and RyR3 mRNA expression in cortices isolated from 12- to 15-month-old Tg2576 (n = 7) and WT (n = 8) mice quantified versus GAPDH mRNA. Graphs represent the means ± SEM calculated versus WT mice, taken as 1. The p values were calculated versus WT mice using t tests. *p < 0.05; **p < 0.01; ***p < 0.001. ns, Nonsignificant.
Since, the induction of IP3R expression is observed only in SH-SY5Y model, and that the dysregulation of RyR expression is reported in both in vitro and in vivo APP-overexpressing models, we then compared mRNA expression levels of the three RyR isoforms in both SH-SY5Y model and Tg2576 mice. By using quantitative RT-PCR, we show an increased expression of RyR1, RyR2, and RyR3 mRNAs in APPswe- and APP695-expressing cells (RyR1, 1.5 ± 0.11 and 1.7 ± 0.03; RyR2, 1.6 ± 0.14 and 1.7 ± 0.13; RyR3, 1.52 ± 0.12 and 1.64 ± 0.13 fold increase in APPswe- and APP695-expressing cells, respectively, vs control cells taken as 1; Fig. 3C). The same analyses performed on cortices isolated from 12- to 15-month-old Tg2576 and WT mice show a significant increase of the expression of RyR2 isoform, while the expression of RyR1 and RyR3 isoforms remain unchanged (RyR1, 0.69 ± 0.26; RyR2, 1.45 ± 0.17; RyR3, 0.72 ± 0.30 fold increase in Tg2576 mice, vs WT mice taken as 1; Fig. 3D). To note, comparative analyses of the expression (cycle threshold value which is defined as the number of cycles required for the fluorescent signal to exceed background level) of the three RyR isoforms reveal that in SH-SY5Y cells, RyR3 is more abundant than RYR2, which is more expressed than RyR1, while RyR2 and RyR3 are the major isoforms expressed in the cortex of Tg2576 and WT mice (data not shown).
Therefore, these data revel that RyR upregulation may underlie ER Ca2+ homeostasis dysregulation in both the SH-SY5Y model and Tg2576 mice.
Dantrolene inhibits RyR-mediated Ca2+ release and decreases C99 and Aβ42 production in APPswe and APP695 SH-SY5Y-expressing cells
We then explored the potential implication of RyR-mediated Ca2+ release in the modulation of APP processing. It was reported previously that caffeine-mediated RyR Ca2+ release stimulates Aβ production (Querfurth et al., 1997). Accordingly, treatment of APPswe-expressing cells with caffeine (5 mm) increases the production of C99 fragment derived from APP processing by β-secretase (Fig. 4A).
Figure 4.
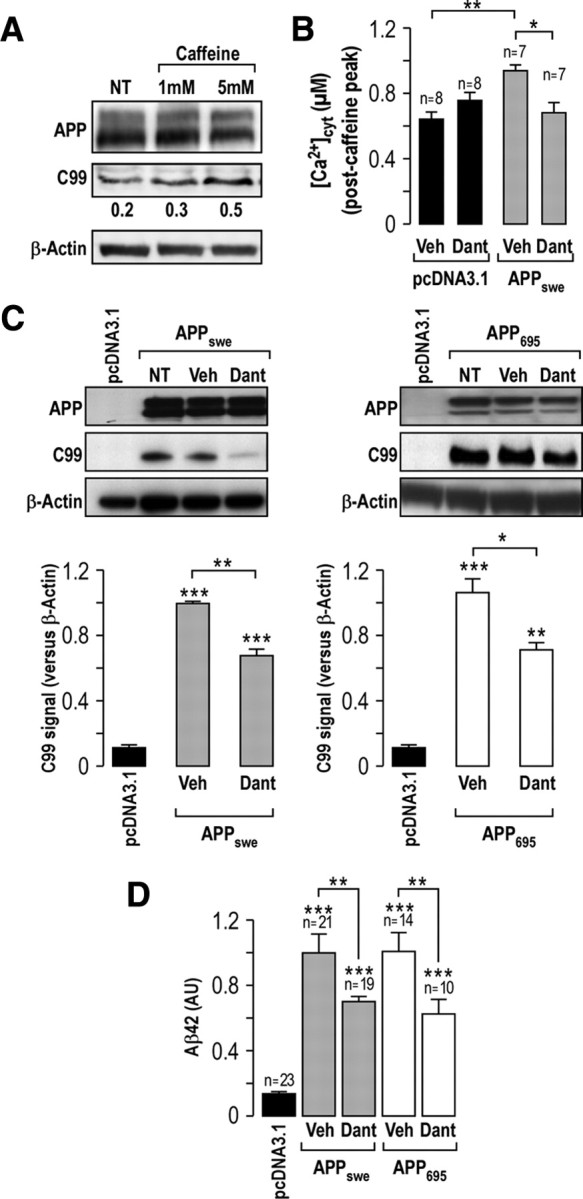
Dantrolene reduced C99 and Aβ42 production in APP695- and APPswe-expressing SH-SY5Y cells. A, Caffeine increased C99 production in SH-SY5Y APPswe-expressing cells either not treated (NT) or treated with 1 or 5 mm caffeine for 20 h. Representative blots of APP and C99 fragment were revealed on 16.5% Tris-tricine gel using 6E10 antibody. β-Actin was used as a loading control. B, Ca2+ analyses in pcDNA3.1 and APPswe-expressing cells using AdCMVcytAEQ and stimulated with caffeine (30 mm) upon treatment with vehicle (DMSO) or dantrolene (50 μm) for 20 h. The p values were calculated as indicated versus pcDNA3.1 or vs vehicle-treated APPswe-expressing cells using one-way ANOVA and Dunnett's multiple comparison post hoc test. C, Representative blots of APP and C99 fragment in APP695- and APPswe-expressing SH-SY5Y cells not treated (NT) or treated with DMSO (Veh) or dantrolene (Dant) (50 μm) for 20 h. Graphs represent the mean of C99 signal ± SEM calculated versus β-Actin. The p values were calculated versus pcDNA3.1 or as indicated versus vehicle using one-way ANOVA and Dunnett's multiple comparison post hoc test. These results were obtained from at least three independent experiments. D, Quantification of extracellular Aβ42 by ELISA in pcDNA3.1 and APPswe- and APP695-expressing cells treated as in C. The graph represents the levels of Aβ42 calculated versus vehicle-treated cells taken as 1 ± SEM. The p values were calculated versus pcDNA3.1 or as indicated versus vehicle-treated cells using one-way ANOVA and Bonferroni's post hoc test. n, Number of experiments. *p < 0.05; **p < 0.01; ***p < 0.001.
We used dantrolene, to modulate RyR-mediated Ca2+ release (Muehlschlegel and Sims, 2009). The concentration and duration of treatment with dantrolene were determined in SH-SY5Y cells using cell viability test and Ca2+ measurements analyses. Cell viability is not altered in APPswe-expressing SH-SY5Y cells treated for 20 h with dantrolene (50 μm) (data not shown). Under these experimental conditions, we show that dantrolene significantly reduces RyR-dependent Ca2+ release in APPswe-expressing cells, but not in control cells (Fig. 4B).
We then assessed whether dantrolene could modify the proteolytic fragments derived from APP processing by β-secretase (C99) or β- and γ-secretases (Aβ40/42). Interestingly, dantrolene treatment reduces the production of C99 fragment in both APPswe- and APP695-expressing cells. Quantification revealed a reduction of C99 production of ∼30% in APPswe- and APP695-expressing cells (Fig. 4C). Dantrolene treatment also significantly decreases Aβ42 production (Aβ42, 0.6 ± 0.1 A.U., n = 10 and 0.7 ± 0.1 A.U., n = 19 in dantrolene-treated APP695- and APPswe-expressing cells, respectively, vs vehicle-treated cells taken as 1; Fig. 4D).
Dantrolene decreases C99 and Aβ42 production in APPswe primary cultured neurons
To rule out any artifactual effect due to the immortalization of cell lines, we investigate the effect of dantrolene in primary cultured neurons isolated from WT and Tg2576 mice. Neurons from Tg2576 mice yield enhanced levels of C99 at 7 d in vitro (DIV) that is maintained at 12 and 15 DIV (Fig. 5A). Tg2576 primary cultured neurons harbor an alteration of intracellular Ca2+ signaling as demonstrated by the increased Ca2+ release upon stimulation with caffeine (30 mm; peak, 5.57 ± 1.05 μm, n = 7 and 3.29 ± 0.32 μm, n = 8 in Tg2576 vs WT neurons respectively; Fig. 5B), and an increased VGCC-dependent Ca2+ entry upon stimulation with KCl (50 mm; peak, 2.70 ± 0.25 μm, n = 13 and 1.83 ± 0.17 μm, n = 13 in Tg2576 vs WT neurons respectively; Fig. 5C).
Figure 5.

Dantrolene reduces C99 and total Aβ peptide production in primary cultured neurons isolated from Tg2576 mice. A, Kinetic analysis of C99 production in primary cultured neurons isolated from e17 Tg2576 mouse after 7, 12, or 15 DIV. β-Actin was used as loading control. B, C, Cytosolic Ca2+ analyses in WT and Tg2576 primary cultured neurons at 12 DIV. Cytosolic Ca2+ signals were obtained upon stimulation with caffeine (30 mm) (B) or KCl (50 mm) (C). Representative curves are shown. The graphs represent the means of the peak [Ca2+]cyt value ± SEM (in micromolar). The p values were calculated versus WT neurons using t test. n, Number of experiments. D, Representative blots of APP and C99 fragment in Tg2576 primary cultured neurons treated at 6 DIV with DMSO (Veh) or dantrolene (Dant) (1 μm; 20 h). The graph represents the mean of C99 signal ± SEM calculated versus β-actin. The p values were calculated versus vehicle using t test. E, Analyses of extracellular Aβ by Western blot after TCA precipitation from conditioned medium of Tg2576 primary cultured neurons treated as in D. The graph shows the quantification versus vehicle considered as 100%. Experiments were obtained at least in three independent experiments (D, E). *p < 0.05; **p < 0.01.
In primary neurons, treatment with dantrolene (1 μm; 20 h) does not alter cell viability (data not shown). Under these conditions, dantrolene reduces C99 peptide production (0.6 ± 0.3 in dantrolene-treated Tg2576 neurons vs vehicle-treated Tg2576 neurons taken as 1; Fig. 5D), and total Aβ peptide present in culture medium (54% ± 13 in dantrolene-treated Tg2576 neurons vs vehicle-treated Tg2576 neurons taken as 100%; Fig. 5E).
Data obtained in both SH-SY5Y-expressing cells and primary cultured neurons clearly demonstrate that the inhibition of RyR-mediated Ca2+ release controls APP processing and the production of C99 fragment and Aβ peptide.
Dantrolene-mediated reduction of C99 and Aβ production is associated with decreased β- and γ-secretase activities and APP phosphorylation
Amyloidogenic metabolism of APP implies its sequential cleavage by β- and γ-secretases (Checler, 1995). It was also reported that APP phosphorylation on Thr-668 (P-APP) plays a major role in APP metabolism and the production of Aβ (Pierrot et al., 2006). Therefore, the reduction of C99 and Aβ peptide production upon dantrolene treatment may be linked to decreased expression and/or activity of β- and γ-secretases or alteration of APP phosphorylation on Thr-668.
We show that SH-SY5Y cells stably overexpressing APPswe or empty vector display similar expression levels of BACE-1 (β-secretase) and PS1, Aph1, and nicastrin (components of the γ-secretase complex) (Checler, 1995), the expression levels of which remained unaffected by dantrolene (Fig. 6A).
Figure 6.

Dantrolene treatment reduces APP phosphorylation on Thr-668 (P-APP Thr-668) and β- and γ-secretase activities in APPswe-expressing cells. A, Representative Western blot showing the expression of BACE-1 and of γ- secretase complex [nicastrin, PS1-FL (full length), and PS1-Nt (N-terminal fragment), and Aph1] in pcDNA3.1 and APPswe-expressing cells not treated (NT) or treated with DMSO (Veh) or dantrolene (Dant) (50 μm) for 20 h. B, Representative Western blot of total APP and P-APP Thr-668 in APPswe-expressing cells upon application of GSK3β, JNK, and CdK5 inhibitors (25 μm SB415286, 25 μm SP600125, and 10 μm roscovitine, respectively) for 4 h, and dantrolene (50 μm) for 20 h, revealed using anti-C-terminal APP and anti-P-APP Thr-668 antibodies, respectively. The graph represents the mean ± SEM of the P-APP Thr-668/total APP ratio calculated versus vehicle-treated APPswe-expressing cells taken as 1. The p values were calculated using one-way ANOVA and Dunnett's multiple comparison post hoc test. C, Kinetic analysis of P-APP Thr-668 and of C99 production in APPswe-expressing cells upon dantrolene treatment. Graphs show the ratio of P-APP Thr-668/APP and C99 signal quantified versus β-actin signal. The p values were calculated using two-way ANOVA and Bonferroni's post hoc test. *,$ p < 0.05 versus the P-APP Thr-668/APP relative value at the 20 min time point or versus C99 signal, respectively, at the 20 min time point. D, β-secretase activity in APPswe-expressing cells treated as in B (calculated vs vehicle-treated cells considered 100%). E, Cell-free Aβ production from recombinant C100 peptide performed at 4 or 37°C in the presence of membranes isolated from pcDNA3.1 or APPswe-expressing cells treated as in B. C100 and Aβ were detected using 6E10 antibody. The graph represents Aβ quantification ± SEM normalized to C100 peptide versus vehicle-treated cells taken as 1. For D and E, p values were calculated versus vehicle using one-way ANOVA and Dunnett's multiple comparison post hoc test. Data were obtained from at least three independent experiments. *p < 0.05; **p < 0.01.
We performed two sets of experiments in APPswe-expressing SH-SY5Y cells to investigate APP phosphorylation. First, we analyzed the extent of Thr-668 P-APP upon dantrolene treatment and used, as controls, inhibitors of candidate kinases thought to be implicated in APP phosphorylation (CdK5, GSK3β, and JNK) (Muresan and Muresan, 2007). As shown in Figure 6B, the addition of dantrolene or CdK5, GSK3β, and JNK kinase inhibitors (roscovitine, SB415286, and SP600125, respectively) significantly reduced the extent of Thr-668 P-APP (Fig. 6B). We then analyzed the time courses of APP phosphorylation and C99 production in dantrolene-treated APPswe cells and showed that dantrolene concomitantly and persistently reduces P-APP and C99 production level as soon as 1 h after treatment (Fig. 6C). These data establish that dantrolene-like kinases inhibitors modulate APP phosphorylation on Thr-668 residue.
We then investigated the effect of dantrolene and of kinase inhibitors on in vitro β- and γ-secretases activities. Our data show that β-secretase activity is significantly decreased upon treatment with dantrolene and roscovitine (48.0 ± 8.5% and 61.2 ± 16.6%, respectively, vs 100.0 ± 10.8% in vehicle-treated cells, n = 5; Fig. 6D), but not with SB415286 and SP600125 (92.0 ± 23.0% and 79.5 ± 23.3%, respectively, n = 5; Fig. 6D).
We also monitored in vitro γ-secretase activity in reconstituted membranes prepared from dantrolene- or kinase inhibitors-treated cells. We found that (1) the recombinant C100 fragment is cleaved at 37°C and to a much lesser extent at 4°C (negative control), and (2) Aβ production by membranes prepared from mock- or nontreated APPswe-transfected cells is similar. Interestingly, a significant reduction of Aβ production was observed with membranes prepared from dantrolene-treated APPswe-expressing cells compared to vehicle-treated ones (Aβ vs C100 signal, 0.65 ± 0.07 vs 1.0 ± 0.1 respectively; Fig. 6E). To rule out a putative direct effect of dantrolene on γ-secretase that would have interfered with the in vitro assay, we incubated the C100 fragment with membranes isolated from untreated APPswe cells in the absence or the presence of dantrolene. Dantrolene does not modify the C100 fragment cleavage (data not shown), thus demonstrating that the reduction of γ-secretase activity upon dantrolene treatment is not linked to a direct interaction of dantrolene with the γ-secretase complex. Our data also reveal that kinase inhibitors reduce γ-secretase activity in a significant manner with SB415286 (Aβ vs C100 signal, 0.52 ± 0.09 vs 1.0 ± 0.1 in vehicle-treated cells), and to a lesser extent with roscovitine and SP600125 (Aβ vs C100 signal, 0.73 ± 0.09 and 0.64 ± 0.08, respectively; Fig. 6E).
These data demonstrate that dantrolene reduces both β- and γ-secretases activities and that under our experimental conditions, β-secretase activity is reduced upon Cdk5 inhibition, while γ-secretase activity is reduced with GSK3β inhibition.
Dantrolene decreases Aβ production and the number of senile plaques in APPswe-expressing mice
Our consistent data obtained in the SH-SY5Y cells and in primary neurons led us to explore the functional consequences of dantrolene in vivo. We used Tg2576 mice developed by Hsiao et al. (1996). This model shows an impairment of learning and memory starting from 9–10 months of age accompanied by an increase in Aβ40 and Aβ42–43 peptides and the development of mature senile plaques (Hsiao et al., 1996). The chronic treatment (3 months) with dantrolene was administered to 12- to 15-month-old mice, i.e., when mice already displayed significant AD-related histological lesions and cognitive deficits. It is noteworthy that dantrolene has been used previously in vivo (Chen et al., 2011), and recent evidence suggests that it readily crosses the blood–brain barrier (for review, see Muehlschlegel and Sims, 2009). Our data demonstrates that dantrolene treatment significantly reduces the density of Aβ plaques in Tg2576 mice (37 ± 8 Aβ plaques per section, n = 6 in dantrolene-treated Tg2576 mice vs 89 ± 20 Aβ plaques per section, n = 5 in vehicle-treated Tg2576 mice) as revealed using the 6E10 antibody recognizing 1–16 residues of Aβ peptides and C99 fragment (Fig. 7A). A similar result was obtained using the FCA18 antibody that recognizes Asp 1 residue of Aβ1-x peptides and C99 (Barelli et al., 1997) (Fig. 7A). No staining was detected with these antibodies in WT mice. Dantrolene-treated Tg2576 mice also exhibit a lower production of C99 and total Aβ peptide than vehicle-treated mice (C99, 0.6 ± 0.1; Aβ, 0.4 ± 0.1, n = 13–18 in dantrolene-treated mice compared to vehicle-treated mice taken as 1, n = 10–13; Fig. 7B).
Figure 7.

In vivo dantrolene treatment reduces Aβ plaques load, C99, and total Aβ production and prevents the loss of PSD-95 expression in Tg2576 mice. WT and Tg2576 mice aged of 12–15 months were treated with 5 mg/kg dantrolene (Dant) or with PBS (vehicle) for 3 months. A, Representative sagittal brain sections (cortex region) stained with 6E10 or FCA18 antibodies. The graph shows the number of Aβ plaques per section ± SEM in Tg2576 mice treated with vehicle or dantrolene. The mean of Aβ plaques was determined in 15 serial sections from each animal. The p values were calculated versus vehicle-treated mice using a t test. **p < 0.01. Scale bars: 100 μm. B, Representative Western blot of C99 and total Aβ revealed on formic acid cortex total extracts and 16.5% Tris-tricine gel using 6E10 antibody. Each line corresponds to different animal. The graphs show the quantification of C99 and Aβ versus GAPDH used as a loading control. C99 was detected in all treated animals (12–15 months), while Aβ was detected only on old animals aged 15 months. The p values were calculated versus vehicle-treated mice using t test. C, Representative Western blot of the expression of PSD-95, synapsin I, Stg, VAMP-2, and SNAP-25 performed on cortical total extracts of WT and Tg2576 mice. The graph shows the quantification versus β-actin. The expression level of each protein in Tg2576 was calculated versus the expression level in WT mice taken as 1. Each line corresponds to different animal. p values were calculated versus WT mice using a t test. D, Representative Western blot of PSD-95 expression obtained from Tg2576 mice treated as in A. The graph shows the quantification of PSD-95 signal versus β-actin. The expression levels of PSD-95 in dantrolene-treated WT mice and in vehicle- or dantrolene-treated Tg2576 mice were calculated versus the expression level in vehicle-treated WT mice taken as 1. p values were calculated versus WT vehicle-treated or Tg2576 vehicle-treated mice using t tests. *p < 0.05. ns, Nonsignificant. n, Number of mice analyzed.
Dantrolene prevents the loss of expression of PSD-95 and learning and memory deficits in Tg2576 mice
As dantrolene reduced Aβ burden in Tg2576 mice in vivo, we hypothesized that this may lead to prevention of AD-related phenotype in this model, i.e., alteration of synaptic function and learning and memory decline.
We analyzed the expression of presynaptic proteins implicated in vesicles mobilization and docking (synapsin I, SNAP-25, VAMP-2, and Stg), as well as of postsynaptic scaffold protein (PSD-95). PSD-95 expression is significantly reduced in 15- to 18-month-old Tg2576 mice compared to age-matched WT mice (0.6 ± 0.1, n = 10 vs 1.0 ± 0.1, n = 13 in Tg2576 and WT mice, respectively), while there is no significant modification of the expression of presynaptic SNAP-25, VAMP-2, Stg, and synapsin I proteins (Fig. 7C). Consequently, we examined the impact of dantrolene on the expression of PSD-95 in WT and Tg2576 mice. Dantrolene abolishes the reduction of PSD-95 expression observed in Tg2576 mice (1.1 ± 0.1, n = 13 vs 0.5 ± 0.1, n = 10 in dantrolene- vs vehicle-treated mice, respectively; Fig. 7D) and remains pharmacologically inert in WT mice (1.2 ± 0.1, n = 9, vs 1.0 ± 0.1, n = 13; Fig. 6D). These data indicate that the restoration of normal PSD-95 levels by dantrolene parallels the reduction of the Aβ burden observed in dantrolene-treated Tg2576 mice.
It was reported previously that Tg2576 mice harbor learning and memory deficits (Hsiao et al., 1996). We thus investigated the impact of dantrolene treatment on these two parameters by using two complementary tests: the Morris water maze (MWM) (Morris, 1984), which tests spatial learning memory, and the novel object recognition paradigm, which records recognition memory (Bevins and Besheer, 2006). In the MWM, WT and Tg2576 mice treated with vehicle or dantrolene have similar escape latencies to find visible platform (Fig. 8A), thus indicating that motility and vision are not affected in Tg2576 mice and that dantrolene treatment does not affect these parameters. Both WT and Tg2576 mice are also able to learn the MWM task, as the average escape latency for each group gradually decrease to reach a predetermined criterion (<25 s average latency) during 5 d of hidden-platform training trials. However, vehicle-treated Tg2576 mice show significantly lower learning performance since they reach criterion on day 5, while vehicle-treated WT mice reach it on day 4 (escape latency on day 4, 39.2 ± 2.7 s, n = 11 for vehicle-treated Tg2576 mice vs 24.6 ± 2.2 s, n = 8 for vehicle-treated WT mice; Fig. 8B). Analyses of the path length and of the path efficiency confirm these data (Path length on day 4, 5 ± 0.5 m, n = 11 for vehicle-treated Tg2576 mice vs 2.5 ± 0.3 m, n = 8 for vehicle-treated WT mice; Fig. 8C; path efficiency on day 4, 0.15 ± 0.03 m, n = 11 for vehicle-treated Tg2576 mice vs 0.29 ± 0.03 m, n = 8 for vehicle-treated WT mice; Fig. 8D). Importantly, dantrolene improves learning ability in Tg2576 mice compared to vehicle-treated Tg2576 mice (escape latency on day 4, 21.5 ± 4.3 s, n = 10 vs 39.2 ± 2.7 s, n = 11, respectively; Fig. 8B; path length, 2.3 ± 0.4 m, n = 10 vs 5.0 ± 0.5 m, n = 11, respectively; Fig. 8C; path efficiency, 0.33 ± 0.06 m, n = 10 vs 0.15 ± 0.03 m, n = 11, respectively; Fig. 8D). Our data also reveal that dantrolene treatment does not affect learning ability in WT mice (Fig. 8B–D) and restores learning ability in Tg2576 mice to a statistically similar level to that observed in WT mice (p > 0.5). At the probe trial, no difference in the time spent in the target quadrant was found between dantrolene-treated Tg2576 mice and vehicle-treated Tg2576 mice (data not shown). Therefore, we also explored recognition memory using the NOR paradigm (Taglialatela et al., 2009). In this test, mice were less exposed to stress conditions compared to the MWM test. During the setup of the NOR apparatus and training paradigm, we confirmed the absence of any artifactual preference for a specific object (color and form) between all groups of mice and verified that Tg2576 mice were not anxious and did not harbor motility decline (data not shown). The total object exploration time during training session was not different in dantrolene- and vehicle-treated WT and Tg2576 mice (data not shown). After 24 h retention, we performed a testing session where the sample objects were reintroduced, one being identical to the training object, i.e., the familiar object, and the other being a novel object. Total exploration time during the testing session is not significantly different between dantrolene- and vehicle-treated WT and Tg2576 mice (data not shown). However, vehicle-treated Tg2576 mice show a clear reduction in the object discrimination ratio as compared to vehicle- and dantrolene treated WT mice (Discrimination index: 47.6 ± 5.7, n = 11 vs 66.6 ± 4.9, n = 11 and 55 ± 6.3, n = 6, respectively) (Fig. 8E). Importantly, dantrolene treatment increased the object discrimination index as compared to vehicle-treated Tg2576 mice (Discrimination index: 72.7 ± 3.6, n = 10 vs 47.6 ± 5.7, n = 11, respectively), thus reflecting an increase in the exploration time of the novel object vs the familiar object in dantrolene-treated Tg2576 mice (Fig. 8E). As for the MWM, in the NOR paradigm, we also revealed that dantrolene treatment restores the object discrimination index in Tg2576 mice to a statistically similar level to that observed in vehicle-treated WT mice (Discrimination index: 72.7 ± 3.9, n = 10 vs 66.6 ± 4.9, n = 11, respectively; p > 0.5). These results demonstrate that dantrolene reduces both learning and memory decline in Tg2576 mice. Together, our data demonstrate that the blockade of RyR-mediated Ca2+ release by dantrolene simultaneously reduces Aβ load, prevents the loss of PSD-95 expression, and prevents learning and memory deficits in vivo.
Figure 8.

Dantrolene (Dant) ameliorates learning and memory deficits in Tg2576-mice. The MWM test and the NOR paradigm were performed on 12- to 15-month-old WT and Tg2576 mice treated as in Figure 7. A–D, The MWM test was performed as described in Materials and Methods. A, In the visible platform test, WT and Tg2576 mice treated with vehicle or dantrolene were tested the same day for four trials, with an intertrial interval of 10 min. The graph shows the average escape latency (in seconds) to find visible platform for each group in each trial. B–D, In hidden platform test, mice were trained also for four trials, with an intertrial interval of 10 min for 5 consecutive days. Graphs show the average of latency (in seconds; B), path length (in meters; C), and path efficiency (the ratio of shortest path length to actual path length; D) to escape to the hidden platform in all four groups of mice recorded each day. The p values were calculated using two-way ANOVA and Bonferroni's post hoc test. *p < 0.05, **p < 0.01, calculated in dantrolene-treated Tg2576 mice versus vehicle-treated Tg2576 mice. #p < 0.05, calculated in vehicle-treated Tg2576 mice versus vehicle-treated WT mice. The averages of latency (is seconds; B), path length (in meters; C), and path efficiency were not significant between vehicle- and dantrolene-treated WT mice. E, The NOR paradigm was done in all four groups of mice as the MWM test. Twenty-four hours after the habituation session, mice were subjected to training in a 10 min session of exposure to one familiar object and to a novel object. The time spent in exploring each object was then measured, and a discrimination index was then calculated as described in Material and Methods. p values were calculated versus vehicle (Veh)-treated WT mice or vehicle-treated Tg2576 mice using one-way ANOVA and Tukey's post hoc test. *p < 0.05; **p < 0.01. n, Number of mice analyzed.
Discussion
We report herein that WT or mutated APP overexpression triggers a large increase of cytosolic Ca2+ signals mainly linked to increased ER Ca2+ release and passive Ca2+ leakage (Figs. 1, 2). Importantly, we reveal the implication of RyR in APP-associated Ca2+ alteration. Therefore, we show that RyR expression and RyR-mediated Ca2+ release are enhanced in both in vitro and in vivo APP-overexpressing models. We also reveal the participation of CICR through RyR in Ca2+ entry via VGCC in APPswe-expressing cells. Interestingly, the CICR-associated pathway was not observed in control cells, suggesting that the larger responses of VGCC in APPswe-expressing cells may arise principally from greater CICR through RyR. Exacerbated IP3R-evoked Ca2+ signals observed in APPswe-expressing cells may also be due to increased CICR through the RyR. This phenomenon was reported in two other AD mice models (PS1M146V and 3xTg-AD) (Stutzmann et al., 2006).
It is known that depletion of ER Ca2+ activates SOCE (Smyth et al., 2010). However, our data reveal that increased Ca2+ entry in APPswe-expressing cells cannot be accounted for by altered SOCE or ICRAC. We suggest that the elevated cytosolic [Ca2+] observed in APPswe-expressing cells is contributed by alternative mechanisms, namely, (1) alteration of Ca2+ extrusion by PMCA and Na+/Ca2+ exchanger (NCX), (2) activation of NCX in Ca2+ influx/Na+ efflux mode, (3) reduction of the buffering capacity, or, as reported previously, (4) exaggeration of Ca2+ entry through Aβ pore in the plasma membrane (Demuro et al., 2011).
The kinetics of Ca2+ slope after Ca2+ responses are not altered in APPswe-expressing cells compared to control (Fig. 1C–E), thus excluding an alteration of PMCA and NCX pumping function. We also did not see any evidence for a modification of Ca2+ entry upon addition of KB-R7943 (2-[4-[(4-nitrophenyl)methoxy]phenyl]ethyl ester, methanesulfonate (1:1), Carbamimidothioic acid), an inhibitor of NCX reverse mode (Magi et al., 2005). This excludes the implication of NCX operating in Ca2+ influx/Na+ efflux mode in the observed increased Ca2+ entry (data not shown).
APPswe-expressing cells harbor an increased basal Ca2+ level as revealed in Figure 1G. Accordingly, elevated resting [Ca2+] was reported previously in APPswe-derived neurons (Lopez et al., 2007), and reduced expression of the calcium binding protein calbidin-D28K was also described in AD (Riascos et al., 2011). Moreover, it was demonstrated previously that Aβ oligomers aggregate into a Ca2+-permeable pore in the plasma membrane (Demuro et al., 2011). It is therefore tempting to speculate that elevated Ca2+ entry in APPswe-expressing cells may be a consequence of two mutually nonexclusive mechanisms: (1) a constitutive Ca2+ entry through Aβ oligomers in the plasma membrane and/or (2) reduced buffering capacity.
Alteration of ER Ca2+ homeostasis was reported in various AD models. Importantly, deviant RyR-mediated Ca2+ release and enhanced RyR expression were described in 3xTg-AD- and PS1M146V-expressing mice models (Chan et al., 2000; Smith et al., 2005; Stutzmann, 2007; Chakroborty et al., 2009). It was proposed that PSs were the predominant Ca2+-deregulating factor in AD and that they may trigger RyR expression and activation in these models. Accordingly, it was demonstrated previously that PS1 and PS2 directly increase RyR single-channel activity through protein–protein interaction (Hayrapetyan et al., 2008; Rybalchenko et al., 2008). We provide here evidence that enhanced RyR expression and RyR-mediated ER Ca2+ release occurred in an AD-related model independently of PS mutation or overexpression. Thus, our data reinforce the implication of ER Ca2+ homeostasis dysregulation in AD and point out RyR expression and/or function dysregulation as a common key player in AD “calciopathy.”
Elevated RyR levels have been described early in human AD cases and in mild cognitive impairment (Kelliher et al., 1999; Bruno et al., 2011). Accordingly, alterations of RyR expression and/or function were found to occur in 3xTg-AD mice model before Aβ formation, tau deposits, or memory deficits (Chakroborty et al., 2009). These data suggest that dysregulation of RyR may represent an etiological trigger that may contribute to the setting of histopathological lesions and synaptic deficits that are associated with the later disease stages. Our study reveals that alterations of RyR-dependent Ca2+ signals likely contribute to the progression of AD pathogenesis through the amplification of Aβ peptide production and memory decline. In these contexts, RyR emerges as a key factor that could be implicated in both initiation and progression of AD.
We show an induction of RyR1, RyR2, and RyR3 isoforms in APP695- and APPswe-expressing SH-SY5Y cells. Upregulation of the RyR2 isoform, but not of RyR1 and RyR3, was also observed in the cortex of Tg2576 mice. Similar results were reported in 3xTg-AD mice (Chakroborty et al., 2009). Therefore, we suggest that RyR2 upregulation may underlie the enhanced RyR-mediated Ca2+ release in Tg2576-derived neurons. Since the induction of different RyR isoforms at the mRNA and protein levels was described in distinct AD models and at different stages of AD pathology, it appears of most interest to study the molecular pathway(s) underlying the control of RyR expression. In the context of APP-overexpressing models, we may speculate that RyR expression may be regulated by an APP-intracellular domain fragment, a transcriptively active modulator (Pardossi-Piquard and Checler, 2012) that has been described previously to modulate IP3-mediated Ca2+ signaling (Leissring et al., 2002).
Enhanced ER Ca2+ emptying in APPswe models may also be linked to pathophysiological posttranslational modifications in the macromolecular complex containing RyR1 or RyR2 resulting in “leaky channels” (Marx et al., 2000; Bellinger et al., 2009; Gant et al., 2011). Specific experiments are needed to demonstrate whether the increased ER passive Ca2+ leakage observed in APPswe-expressing cells (Fig. 2B) is associated to a dysfunction in the RyR macromolecular complex. It was initially demonstrated that RyR1 and RyR3 are the targets of dantrolene (Zhao et al., 2001). Interference of dantrolene with cardiac and neuronal RyR2 isoforms has been disputed, although it has recently been proposed to have effects on cardiac RyR2 (Jung et al., 2012; Maxwell et al., 2012). Our findings demonstrate the potential use of dantrolene as a tool to modulate RyR-mediated Ca2+ signals; however, other approaches must be considered such as modulators of the RyR macromolecular complex (Bellinger et al., 2009).
It was reported previously that APP phosphorylation on Thr-668 residue is necessary for intraneuronal accumulation of Aβ (Lee et al., 2003; Pierrot et al., 2006; Muresan and Muresan, 2007), and that the activity of Cdk5 and GSk3β kinases implicated in APP phosphorylation are calpain and Ca2+ dependent (Nath et al., 2000; Lebel et al., 2009).
It is possible to envision the following scenario (Fig. 9): dantrolene, through the modulation of RyR-mediated Ca2+ release, reduces APP phosphorylation on Thr-668 residue, likely through the control of Cdk5 and GSk3β kinases activities; in parallel, dantrolene also reduces β- and γ-secretases activities. This may occur directly since Ca2+ interacts with β- and γ-secretases to enhance their activities (Hayley et al., 2009; Ho et al., 2010), or indirectly through the control of Cdk5 and GSK3β activities. Therefore, dantrolene modulates in concert both APP phosphorylation on Thr-668 and β- and γ-secretase activities, leading to the reduction of C99 and Aβ production, likely preventing learning and memory decline (Fig. 9).
Figure 9.

Scheme of the potential mechanisms underlying the reduction of C99 and Aβ production upon dantrolene treatment in APP-overexpressing models. Dantrolene modulates RyR-mediated Ca2+ release. This is associated with the reduction of APP phosphorylation on the Thr-668 residue likely through the control of the activity of Cdk5 and GSk3β kinases; in parallel, dantrolene also reduces β- and γ-secretase activities. Cdk5 and GSK3β control the activity of β- and γ-secretases, respectively. Therefore, dantrolene, Cdk5, and GSK3β modulate in concert both APP phosphorylation on Thr-668 and β- and γ-secretase activities. This leads to the reduction of C99 and Aβ production in vitro and in vivo, preventing learning and memory decline in vivo linked to AD.
We show herein that Tg2576 mice harbor a reduced level of PSD-95 [a component of the postsynaptic density membrane-associated guanylate kinase (PSD-MAGUK) scaffolding proteins]. In line with these results, reduced PSD-MAGUKs expression, i.e., PSD-95 and SAP-102 were also reported in autopsied AD brains (Proctor et al., 2010). It is well established that PSD-MAGUK indirectly regulates synaptic plasticity and memory through the control of the number and compartmentalization of both AMPA and NMDA glutamate receptors around the PSD (Elias et al., 2008). In addition, Goussakov et al. (2010) showed a profound RyR-mediated Ca2+ increase within dendritic processes and spines and larger NMDA-evoked Ca2+ signals in the 3xTg-AD strain. We hypothesize that excessive postsynaptic RyR-mediated Ca2+ release and subsequent increased Aβ load may have contributed to PSD-95 expression decline in Tg2576 mice. This may have led directly or indirectly to learning and memory decline.
About 30 millions individuals are estimated to be affected with AD worldwide, and to date no effective treatment exists to arrest disease progression. Although therapeutic approaches targeting Ca2+ influx have demonstrated efficacy in animal AD models, very few have been successful in clinical trials, namely, the L-type Ca2+ channel blocker nimodipine (Tollefson, 1990) and the NMDA open receptor blocker memantine (Bullock, 2006). Targeting of ER Ca2+ homeostasis as a therapeutic approach for AD was not investigated before. Dantrolene was originally used for the treatment of malignant hyperthermia (Harrison, 1975). However, recent in vitro and in vivo studies revealed the neuroprotective effect of dantrolene. Thus, dantrolene was shown to protect cells in vitro against the adverse consequences of the PS1 mutation (Guo et al., 1999) and to be neuroprotective in vivo in spinocerebellar ataxia types 2 and 3 and in Huntington's disease (Chen et al., 2008, 2011; Liu et al., 2009).
We provide here evidence that dantrolene treatment reduces Aβ burden in vitro and in vivo and prevents the reduction of PSD-95 expression and learning and memory decline in vivo. Our study reveals RyR as a potential target for the treatment of AD and paves the way for the development of therapeutic strategies for AD based on modulating ER-dependent Ca2+ release mechanisms.
Footnotes
This work was supported by the Institut National de la Santé et de la Recherche Médicale (INSERM), CNRS, AFM Grants 11456 and 13291, Fondation pour la Recherche Médicale Grant DEQ20071210550, and the Italian Institute of Technology, and NIH Grant 5R01HL097111 (M.T.). This work was developed and supported through the LABEX (Laboratory of Excellence, Investment Program for the Future) DISTALZ (Development of Innovative Strategies for a Transdisciplinary Approach to Alzheimer's Disease) project. We acknowledge L'Ecole de l'INSERM Liliane Bettencourt for supporting the MD/PhD curriculum of B.O. and the Italian Institute of Technology for supporting the PhD curriculum of D.D.P.
References
- Barelli H, Lebeau A, Vizzavona J, Delaere P, Chevallier N, Drouot C, Marambaud P, Ancolio K, Buxbaum JD, Khorkova O, Heroux J, Sahasrabudhe S, Martinez J, Warter JM, Mohr M, Checler F. Characterization of new polyclonal antibodies specific for 40 and 42 amino acid-long amyloid beta peptides: their use to examine the cell biology of presenilins and the immunohistochemistry of sporadic Alzheimer's disease and cerebral amyloid angiopathy cases. Mol Med. 1997;3:695–707. [PMC free article] [PubMed] [Google Scholar]
- Bekris LM, Yu CE, Bird TD, Tsuang DW. Genetics of Alzheimer disease. J Geriatr Psychiatry Neurol. 2010;23:213–227. doi: 10.1177/0891988710383571. [DOI] [PMC free article] [PubMed] [Google Scholar]
- Bellinger AM, Reiken S, Carlson C, Mongillo M, Liu X, Rothman L, Matecki S, Lacampagne A, Marks AR. Hypernitrosylated ryanodine receptor calcium release channels are leaky in dystrophic muscle. Nat Med. 2009;15:325–330. doi: 10.1038/nm.1916. [DOI] [PMC free article] [PubMed] [Google Scholar]
- Berridge MJ, Bootman MD, Roderick HL. Calcium signalling: dynamics, homeostasis and remodelling. Nat Rev Mol Cell Biol. 2003;4:517–529. doi: 10.1038/nrm1155. [DOI] [PubMed] [Google Scholar]
- Bevins RA, Besheer J. Object recognition in rats and mice: a one-trial non-matching-to-sample learning task to study ‘recognition memory.’. Nat Protoc. 2006;1:1306–1311. doi: 10.1038/nprot.2006.205. [DOI] [PubMed] [Google Scholar]
- Bezprozvanny I, Mattson MP. Neuronal calcium mishandling and the pathogenesis of Alzheimer's disease. Trends Neurosci. 2008;31:454–463. doi: 10.1016/j.tins.2008.06.005. [DOI] [PMC free article] [PubMed] [Google Scholar]
- Bisaillon JM, Motiani RK, Gonzalez-Cobos JC, Potier M, Halligan KE, Alzawahra WF, Barroso M, Singer HA, Jourd'heuil D, Trebak M. Essential role for STIM1/Orai1-mediated calcium influx in PDGF-induced smooth muscle migration. Am J Physiol Cell Physiol. 2010;298:C993–C1005. doi: 10.1152/ajpcell.00325.2009. [DOI] [PMC free article] [PubMed] [Google Scholar]
- Brunello L, Zampese E, Florean C, Pozzan T, Pizzo P, Fasolato C. Presenilin-2 dampens intracellular Ca2+ stores by increasing Ca2+ leakage and reducing Ca2+ uptake. J Cell Mol Med. 2009;13:3358–3369. doi: 10.1111/j.1582-4934.2009.00755.x. [DOI] [PMC free article] [PubMed] [Google Scholar]
- Bruno AM, Huang JY, Bennett DA, Marr RA, Hastings ML, Stutzmann GE. Altered ryanodine receptor expression in mild cognitive impairment and Alzheimer's disease. Neurobiol Aging. 2011;33:1001.e1–6. doi: 10.1016/j.neurobiolaging.2011.03.011. [DOI] [PMC free article] [PubMed] [Google Scholar]
- Buggia-Prevot V, Sevalle J, Rossner S, Checler F. NFkappaB-dependent control of BACE1 promoter transactivation by Abeta42. J Biol Chem. 2008;283:10037–10047. doi: 10.1074/jbc.M706579200. [DOI] [PubMed] [Google Scholar]
- Bullock R. Efficacy and safety of memantine in moderate-to-severe Alzheimer disease: the evidence to date. Alzheimer Dis Assoc Disord. 2006;20:23–29. doi: 10.1097/01.wad.0000201847.29836.a5. [DOI] [PubMed] [Google Scholar]
- Buxbaum JD, Ruefli AA, Parker CA, Cypess AM, Greengard P. Calcium regulates processing of the Alzheimer amyloid protein precursor in a protein kinase C-independent manner. Proc Natl Acad Sci U S A. 1994;91:4489–4493. doi: 10.1073/pnas.91.10.4489. [DOI] [PMC free article] [PubMed] [Google Scholar]
- Chakroborty S, Goussakov I, Miller MB, Stutzmann GE. Deviant ryanodine receptor-mediated calcium release resets synaptic homeostasis in presymptomatic 3xTg-AD mice. J Neurosci. 2009;29:9458–9470. doi: 10.1523/JNEUROSCI.2047-09.2009. [DOI] [PMC free article] [PubMed] [Google Scholar]
- Chami M, Oulès B, Szabadkai G, Tacine R, Rizzuto R, Paterlini-Bréchot P. Role of SERCA1 truncated isoform in the proapoptotic calcium transfer from ER to mitochondria during ER stress. Mol Cell. 2008;32:641–651. doi: 10.1016/j.molcel.2008.11.014. [DOI] [PMC free article] [PubMed] [Google Scholar]
- Chan SL, Mayne M, Holden CP, Geiger JD, Mattson MP. Presenilin-1 mutations increase levels of ryanodine receptors and calcium release in PC12 cells and cortical neurons. J Biol Chem. 2000;275:18195–18200. doi: 10.1074/jbc.M000040200. [DOI] [PubMed] [Google Scholar]
- Checler F. Processing of the beta-amyloid precursor protein and its regulation in Alzheimer's disease. J Neurochem. 1995;65:1431–1444. doi: 10.1046/j.1471-4159.1995.65041431.x. [DOI] [PubMed] [Google Scholar]
- Chen X, Tang TS, Tu H, Nelson O, Pook M, Hammer R, Nukina N, Bezprozvanny I. Deranged calcium signaling and neurodegeneration in spinocerebellar ataxia type 3. J Neurosci. 2008;28:12713–12724. doi: 10.1523/JNEUROSCI.3909-08.2008. [DOI] [PMC free article] [PubMed] [Google Scholar]
- Chen X, Wu J, Lvovskaya S, Herndon E, Supnet C, Bezprozvanny I. Dantrolene is neuroprotective in Huntington's disease transgenic mouse model. Mol Neurodegener. 2011;6:81. doi: 10.1186/1750-1326-6-81. [DOI] [PMC free article] [PubMed] [Google Scholar]
- Cheung KH, Shineman D, Müller M, Cárdenas C, Mei L, Yang J, Tomita T, Iwatsubo T, Lee VM, Foskett JK. Mechanism of Ca2+ disruption in Alzheimer's disease by presenilin regulation of InsP(3) receptor channel gating. Neuron. 2008;58:871–883. doi: 10.1016/j.neuron.2008.04.015. [DOI] [PMC free article] [PubMed] [Google Scholar]
- Demuro A, Smith M, Parker I. Single-channel Ca(2+) imaging implicates Abeta1–42 amyloid pores in Alzheimer's disease pathology. J Cell Biol. 2011;195:515–524. doi: 10.1083/jcb.201104133. [DOI] [PMC free article] [PubMed] [Google Scholar]
- Elias GM, Elias LA, Apostolides PF, Kriegstein AR, Nicoll RA. Differential trafficking of AMPA and NMDA receptors by SAP102 and PSD-95 underlies synapse development. Proc Natl Acad Sci U S A. 2008;105:20953–20958. doi: 10.1073/pnas.0811025106. [DOI] [PMC free article] [PubMed] [Google Scholar]
- Ferreiro E, Oliveira CR, Pereira C. Involvement of endoplasmic reticulum Ca2+ release through ryanodine and inositol 1,4,5-triphosphate receptors in the neurotoxic effects induced by the amyloid-beta peptide. J Neurosci Res. 2004;76:872–880. doi: 10.1002/jnr.20135. [DOI] [PubMed] [Google Scholar]
- Gant JC, Chen KC, Norris CM, Kadish I, Thibault O, Blalock EM, Porter NM, Landfield PW. Disrupting function of FK506-binding protein 1b/12.6 induces the Ca(2)+-dysregulation aging phenotype in hippocampal neurons. J Neurosci. 2011;31:1693–1703. doi: 10.1523/JNEUROSCI.4805-10.2011. [DOI] [PMC free article] [PubMed] [Google Scholar]
- Goussakov I, Miller MB, Stutzmann GE. NMDA-mediated Ca(2+) influx drives aberrant ryanodine receptor activation in dendrites of young Alzheimer's disease mice. J Neurosci. 2010;30:12128–12137. doi: 10.1523/JNEUROSCI.2474-10.2010. [DOI] [PMC free article] [PubMed] [Google Scholar]
- Green KN, Demuro A, Akbari Y, Hitt BD, Smith IF, Parker I, LaFerla FM. SERCA pump activity is physiologically regulated by presenilin and regulates amyloid beta production. J Cell Biol. 2008;181:1107–1116. doi: 10.1083/jcb.200706171. [DOI] [PMC free article] [PubMed] [Google Scholar]
- Guo Q, Fu W, Holtsberg FW, Steiner SM, Mattson MP. Superoxide mediates the cell-death-enhancing action of presenilin-1 mutations. J Neurosci Res. 1999;56:457–470. doi: 10.1002/(SICI)1097-4547(19990601)56:5<457::AID-JNR2>3.0.CO;2-P. [DOI] [PubMed] [Google Scholar]
- Harrison GG. Control of the malignant hyperpyrexic syndrome in MHS swine by dantrolene sodium. Br J Anaesth. 1975;47:62–65. doi: 10.1093/bja/47.1.62. [DOI] [PubMed] [Google Scholar]
- Hayley M, Perspicace S, Schulthess T, Seelig J. Calcium enhances the proteolytic activity of BACE1: An in vitro biophysical and biochemical characterization of the BACE1-calcium interaction. Biochim Biophys Acta. 2009;1788:1933–1938. doi: 10.1016/j.bbamem.2009.05.015. [DOI] [PubMed] [Google Scholar]
- Hayrapetyan V, Rybalchenko V, Rybalchenko N, Koulen P. The N-terminus of presenilin-2 increases single channel activity of brain ryanodine receptors through direct protein-protein interaction. Cell Calcium. 2008;44:507–518. doi: 10.1016/j.ceca.2008.03.004. [DOI] [PubMed] [Google Scholar]
- Ho M, Hoke DE, Chua YJ, Li QX, Culvenor JG, Masters C, White AR, Evin G. Effect of metal chelators on gamma-secretase indicates that calcium and magnesium ions facilitate cleavage of Alzheimer amyloid precursor substrate. Int J Alzheimers Dis. 2010;2011:950932. doi: 10.4061/2011/950932. [DOI] [PMC free article] [PubMed] [Google Scholar]
- Hsiao K, Chapman P, Nilsen S, Eckman C, Harigaya Y, Younkin S, Yang F, Cole G. Correlative memory deficits, Abeta elevation, and amyloid plaques in transgenic mice. Science. 1996;274:99–102. doi: 10.1126/science.274.5284.99. [DOI] [PubMed] [Google Scholar]
- Jung CB, Moretti A, Mederos y Schnitzler M, Iop L, Storch U, Bellin M, Dorn T, Ruppenthal S, Pfeiffer S, Goedel A, Dirschinger RJ, Seyfarth M, Lam JT, Sinnecker D, Gudermann T, Lipp P, Laugwitz KL. Dantrolene rescues arrhythmogenic RYR2 defect in a patient-specific stem cell model of catecholaminergic polymorphic ventricular tachycardia. EMBO Mol Med. 2012;4:180–191. doi: 10.1002/emmm.201100194. [DOI] [PMC free article] [PubMed] [Google Scholar]
- Kelliher M, Fastbom J, Cowburn RF, Bonkale W, Ohm TG, Ravid R, Sorrentino V, O'Neill C. Alterations in the ryanodine receptor calcium release channel correlate with Alzheimer's disease neurofibrillary and beta-amyloid pathologies. Neuroscience. 1999;92:499–513. doi: 10.1016/s0306-4522(99)00042-1. [DOI] [PubMed] [Google Scholar]
- Lebel M, Patenaude C, Allyson J, Massicotte G, Cyr M. Dopamine D1 receptor activation induces tau phosphorylation via cdk5 and GSK3 signaling pathways. Neuropharmacology. 2009;57:392–402. doi: 10.1016/j.neuropharm.2009.06.041. [DOI] [PubMed] [Google Scholar]
- Lee MS, Kao SC, Lemere CA, Xia W, Tseng HC, Zhou Y, Neve R, Ahlijanian MK, Tsai LH. APP processing is regulated by cytoplasmic phosphorylation. J Cell Biol. 2003;163:83–95. doi: 10.1083/jcb.200301115. [DOI] [PMC free article] [PubMed] [Google Scholar]
- Leissring MA, Parker I, LaFerla FM. Presenilin-2 mutations modulate amplitude and kinetics of inositol 1,4,5-trisphosphate-mediated calcium signals. J Biol Chem. 1999;274:32535–32538. doi: 10.1074/jbc.274.46.32535. [DOI] [PubMed] [Google Scholar]
- Leissring MA, Murphy MP, Mead TR, Akbari Y, Sugarman MC, Jannatipour M, Anliker B, Müller U, Saftig P, De Strooper B, Wolfe MS, Golde TE, LaFerla FM. A physiologic signaling role for the gamma -secretase-derived intracellular fragment of APP. Proc Natl Acad Sci U S A. 2002;99:4697–4702. doi: 10.1073/pnas.072033799. [DOI] [PMC free article] [PubMed] [Google Scholar]
- Liu J, Tang TS, Tu H, Nelson O, Herndon E, Huynh DP, Pulst SM, Bezprozvanny I. Deranged calcium signaling and neurodegeneration in spinocerebellar ataxia type 2. J Neurosci. 2009;29:9148–9162. doi: 10.1523/JNEUROSCI.0660-09.2009. [DOI] [PMC free article] [PubMed] [Google Scholar]
- Lopez JR, Lyckman A, Oddo S, Laferla FM, Querfurth HW, Shtifman A. Increased intraneuronal resting [Ca(2+)] in adult Alzheimer's disease mice. J Neurochem. 2008;105:262–271. doi: 10.1111/j.1471-4159.2007.05135.x. [DOI] [PubMed] [Google Scholar]
- Magi S, Castaldo P, Carrieri G, Scorziello A, Di Renzo G, Amoroso S. Involvement of Na+-Ca2+ exchanger in intracellular Ca2+ increase and neuronal injury induced by polychlorinated biphenyls in human neuroblastoma SH-SY5Y cells. J Pharmacol Exp Ther. 2005;315:291–296. doi: 10.1124/jpet.105.088948. [DOI] [PubMed] [Google Scholar]
- Marx SO, Reiken S, Hisamatsu Y, Jayaraman T, Burkhoff D, Rosemblit N, Marks AR. PKA phosphorylation dissociates FKBP12.6 from the calcium release channel (ryanodine receptor): defective regulation in failing hearts. Cell. 2000;101:365–376. doi: 10.1016/s0092-8674(00)80847-8. [DOI] [PubMed] [Google Scholar]
- Maxwell JT, Domeier TL, Blatter LA. Dantrolene prevents arrhythmogenic Ca2+ release in heart failure. Am J Physiol Heart Circ Physiol. 2012;302:H953–H963. doi: 10.1152/ajpheart.00936.2011. [DOI] [PMC free article] [PubMed] [Google Scholar]
- Morris R. Developments of a water-maze procedure for studying spatial learning in the rat. J Neurosci Methods. 1984;11:47–60. doi: 10.1016/0165-0270(84)90007-4. [DOI] [PubMed] [Google Scholar]
- Muehlschlegel S, Sims JR. Dantrolene: mechanisms of neuroprotection and possible clinical applications in the neurointensive care unit. Neurocrit Care. 2009;10:103–115. doi: 10.1007/s12028-008-9133-4. [DOI] [PMC free article] [PubMed] [Google Scholar]
- Muresan Z, Muresan V. The amyloid-beta precursor protein is phosphorylated via distinct pathways during differentiation, mitosis, stress, and degeneration. Mol Biol Cell. 2007;18:3835–3844. doi: 10.1091/mbc.E06-07-0625. [DOI] [PMC free article] [PubMed] [Google Scholar]
- Nath R, Davis M, Probert AW, Kupina NC, Ren X, Schielke GP, Wang KK. Processing of cdk5 activator p35 to its truncated form (p25) by calpain in acutely injured neuronal cells. Biochem Biophys Res Commun. 2000;274:16–21. doi: 10.1006/bbrc.2000.3070. [DOI] [PubMed] [Google Scholar]
- Niu Y, Su Z, Zhao C, Song B, Zhang X, Zhao N, Shen X, Gong Y. Effect of amyloid beta on capacitive calcium entry in neural 2a cells. Brain Res Bull. 2009;78:152–157. doi: 10.1016/j.brainresbull.2008.10.003. [DOI] [PubMed] [Google Scholar]
- Pardossi-Piquard R, Checler F. The physiology of the beta-amyloid precursor protein intracellular domain AICD. J Neurochem. 2012;120(Suppl 1):109–124. doi: 10.1111/j.1471-4159.2011.07475.x. [DOI] [PubMed] [Google Scholar]
- Pierrot N, Santos SF, Feyt C, Morel M, Brion JP, Octave JN. Calcium-mediated transient phosphorylation of tau and amyloid precursor protein followed by intraneuronal amyloid-beta accumulation. J Biol Chem. 2006;281:39907–39914. doi: 10.1074/jbc.M606015200. [DOI] [PubMed] [Google Scholar]
- Potier M, Gonzalez JC, Motiani RK, Abdullaev IF, Bisaillon JM, Singer HA, Trebak M. Evidence for STIM1- and Orai1-dependent store-operated calcium influx through ICRAC in vascular smooth muscle cells: role in proliferation and migration. FASEB J. 2009;23:2425–2437. doi: 10.1096/fj.09-131128. [DOI] [PMC free article] [PubMed] [Google Scholar]
- Proctor DT, Coulson EJ, Dodd PR. Reduction in post-synaptic scaffolding PSD-95 and SAP-102 protein levels in the Alzheimer inferior temporal cortex is correlated with disease pathology. J Alzheimers Dis. 2010;21:795–811. doi: 10.3233/JAD-2010-100090. [DOI] [PubMed] [Google Scholar]
- Querfurth HW, Selkoe DJ. Calcium ionophore increases amyloid beta peptide production by cultured cells. Biochemistry. 1994;33:4550–4561. doi: 10.1021/bi00181a016. [DOI] [PubMed] [Google Scholar]
- Querfurth HW, Jiang J, Geiger JD, Selkoe DJ. Caffeine stimulates amyloid beta-peptide release from beta-amyloid precursor protein-transfected HEK293 cells. J Neurochem. 1997;69:1580–1591. doi: 10.1046/j.1471-4159.1997.69041580.x. [DOI] [PubMed] [Google Scholar]
- Riascos D, de Leon D, Baker-Nigh A, Nicholas A, Yukhananov R, Bu J, Wu CK, Geula C. Age-related loss of calcium buffering and selective neuronal vulnerability in Alzheimer's disease. Acta Neuropathol. 2011;122:565–576. doi: 10.1007/s00401-011-0865-4. [DOI] [PMC free article] [PubMed] [Google Scholar]
- Riddoch FC, Rowbotham SE, Brown AM, Redfern CP, Cheek TR. Release and sequestration of Ca2+ by a caffeine- and ryanodine-sensitive store in a sub-population of human SH-SY5Y neuroblastoma cells. Cell Calcium. 2005;38:111–120. doi: 10.1016/j.ceca.2005.06.001. [DOI] [PubMed] [Google Scholar]
- Rojas G, Cárdenas AM, Fernández-Olivares P, Shimahara T, Segura-Aguilar J, Caviedes R, Caviedes P. Effect of the knockdown of amyloid precursor protein on intracellular calcium increases in a neuronal cell line derived from the cerebral cortex of a trisomy 16 mouse. Exp Neurol. 2008;209:234–242. doi: 10.1016/j.expneurol.2007.09.024. [DOI] [PubMed] [Google Scholar]
- Rybalchenko V, Hwang SY, Rybalchenko N, Koulen P. The cytosolic N-terminus of presenilin-1 potentiates mouse ryanodine receptor single channel activity. Int J Biochem Cell Biol. 2008;40:84–97. doi: 10.1016/j.biocel.2007.06.023. [DOI] [PubMed] [Google Scholar]
- Sevalle J, Ayral E, Hernandez JF, Martinez J, Checler F. Pharmacological evidences for DFK167-sensitive presenilin-independent gamma-secretase-like activity. J Neurochem. 2009;110:275–283. doi: 10.1111/j.1471-4159.2009.06131.x. [DOI] [PubMed] [Google Scholar]
- Shilling D, Mak DO, Kang DE, Foskett JK. Lack of evidence for presenilins as endoplasmic reticulum Ca2+ leak channels. J Biol Chem. 2012;287:10933–10944. doi: 10.1074/jbc.M111.300491. [DOI] [PMC free article] [PubMed] [Google Scholar]
- Smith IF, Hitt B, Green KN, Oddo S, LaFerla FM. Enhanced caffeine-induced Ca2+ release in the 3xTg-AD mouse model of Alzheimer's disease. J Neurochem. 2005;94:1711–1718. doi: 10.1111/j.1471-4159.2005.03332.x. [DOI] [PubMed] [Google Scholar]
- Smyth JT, Hwang SY, Tomita T, DeHaven WI, Mercer JC, Putney JW. Activation and regulation of store-operated calcium entry. J Cell Mol Med. 2010;14:2337–2349. doi: 10.1111/j.1582-4934.2010.01168.x. [DOI] [PMC free article] [PubMed] [Google Scholar]
- Stutzmann GE. The pathogenesis of Alzheimers disease is it a lifelong “calciumopathy”? Neuroscientist. 2007;13:546–559. doi: 10.1177/1073858407299730. [DOI] [PubMed] [Google Scholar]
- Stutzmann GE, Caccamo A, LaFerla FM, Parker I. Dysregulated IP3 signaling in cortical neurons of knock-in mice expressing an Alzheimer's-linked mutation in presenilin1 results in exaggerated Ca2+ signals and altered membrane excitability. J Neurosci. 2004;24:508–513. doi: 10.1523/JNEUROSCI.4386-03.2004. [DOI] [PMC free article] [PubMed] [Google Scholar]
- Stutzmann GE, Smith I, Caccamo A, Oddo S, Laferla FM, Parker I. Enhanced ryanodine receptor recruitment contributes to Ca2+ disruptions in young, adult, and aged Alzheimer's disease mice. J Neurosci. 2006;26:5180–5189. doi: 10.1523/JNEUROSCI.0739-06.2006. [DOI] [PMC free article] [PubMed] [Google Scholar]
- Taglialatela G, Hogan D, Zhang WR, Dineley KT. Intermediate- and long-term recognition memory deficits in Tg2576 mice are reversed with acute calcineurin inhibition. Behav Brain Res. 2009;200:95–99. doi: 10.1016/j.bbr.2008.12.034. [DOI] [PMC free article] [PubMed] [Google Scholar]
- Tollefson GD. Short-term effects of the calcium channel blocker nimodipine (Bay-e-9736) in the management of primary degenerative dementia. Biol Psychiatry. 1990;27:1133–1142. doi: 10.1016/0006-3223(90)90050-c. [DOI] [PubMed] [Google Scholar]
- Tu H, Nelson O, Bezprozvanny A, Wang Z, Lee SF, Hao YH, Serneels L, De Strooper B, Yu G, Bezprozvanny I. Presenilins form ER Ca2+ leak channels, a function disrupted by familial Alzheimer's disease-linked mutations. Cell. 2006;126:981–993. doi: 10.1016/j.cell.2006.06.059. [DOI] [PMC free article] [PubMed] [Google Scholar]
- van Acker K, Bautmans B, Bultynck G, Maes K, Weidema AF, de Smet P, Parys JB, de Smedt H, Missiaen L, Callewaert G. Mapping of IP(3)-mediated Ca(2+) signals in single human neuroblastoma SH-SY5Y cells: cell volume shaping the Ca(2+) signal. J Neurophysiol. 2000;83:1052–1057. doi: 10.1152/jn.2000.83.2.1052. [DOI] [PubMed] [Google Scholar]
- Zhang W, Halligan KE, Zhang X, Bisaillon JM, Gonzalez-Cobos JC, Motiani RK, Hu G, Vincent PA, Zhou J, Barroso M, Singer HA, Matrougui K, Trebak M. Orai1-mediated I (CRAC) is essential for neointima formation after vascular injury. Circ Res. 2011;109:534–542. doi: 10.1161/CIRCRESAHA.111.246777. [DOI] [PMC free article] [PubMed] [Google Scholar]
- Zhao F, Li P, Chen SR, Louis CF, Fruen BR. Dantrolene inhibition of ryanodine receptor Ca2+ release channels. Molecular mechanism and isoform selectivity. J Biol Chem. 2001;276:13810–13816. doi: 10.1074/jbc.M006104200. [DOI] [PubMed] [Google Scholar]