

Abstract
Nucleosome positioning dictates eukaryotic DNA compaction and access. To predict nucleosome positions in a statistical mechanics model, we exploited the knowledge that nucleosomes favor DNA sequences with specific periodically occurring dinucleotides. Our model is the first to capture both dyad position within a few base pairs, and free binding energy within 2 kBT, for all the known nucleosome positioning sequences. By applying Percus’s equation to the derived energy landscape, we isolate sequence effects on genome-wide nucleosome occupancy from other factors that may influence nucleosome positioning. For both in vitro and in vivo systems, three parameters suffice to predict nucleosome occupancy with correlation coefficients of respectively 0.74 and 0.66. As predicted, we find the largest deviations in vivo around transcription start sites. This relatively simple algorithm can be used to guide future studies on the influence of DNA sequence on chromatin organization.
Keywords: energy landscape, free energy, histone tetramer, Percus equation, yeast genome
In eukaryotic cells, DNA is highly compacted into chromatin, consisting of DNA and histones arranged in nucleosome arrays. Each nucleosome contains 147 base pairs (bp) of DNA, which is tightly wrapped in 1.7 left-handed turns around a histone octamer (1). Histone octamers have a diameter of 10 nm and DNA has a persistence length of 53 nm (2). Therefore, DNA sequences with intrinsic curvature or anisotropic flexibility to accommodate such large curvatures should show a higher preference for nucleosome formation. Indeed, in vitro studies have shown that histone octamers display DNA sequence preferences (3). Nucleosome positioning dictates linker lengths and this in turn controls higher order folding modes of 30 nm chromatin fibers (4). A DNA sequence effect on nucleosome occupancy may also help remodeling enzymes to define local chromatin structure (5). Finally, well-positioned nucleosomes observed at transcription start sites in vivo may significantly affect gene expression either by occluding access for regulatory proteins to DNA or by recruiting them through interactions with histones (6). Therefore, understanding the involvement of DNA sequence on nucleosome positioning and occupancy is of great biological interest (7). However, the means and extent by which sequence preference influences the position and occupancy of nucleosomes on the genome is currently debated (8–10).
It has been known for some time that in vitro nucleosomes have a high preference for certain DNA sequences (11–14) and tend to avoid other sequences (15–22). For instance, Kaplan et al. (23) concluded from genome-scale nucleosome mapping that intrinsic nucleosome sequence preferences have a dominant role in determining nucleosome organization in vivo. Shortly after this study, Zhang et al. (24) reported a similar study on in vivo and in vitro assembled yeast chromatin, but using a somewhat different methodology. They and others (24, 25) concluded that intrinsic histone-DNA interactions are not the major determinant of nucleosome positioning, but rather of nucleosome occupancy. Positioning and occupancy of nucleosomes are closely related concepts; nucleosome positioning is the distribution of individual nucleosomes along the DNA sequence and can be thought of in terms of a single reference point on the nucleosome, such as its dyad of symmetry (9, 26). Nucleosome occupancy, on the other hand, is a measure of the probability that a certain DNA region is wrapped onto a histone octamer. Genome-wide data, however, lack the accuracy to disclose single nucleosome positions or to discriminate between alternative nucleosome positions in DNA regions where nucleosomes are mobile. It is therefore not trivial to isolate the contribution of DNA sequence on the genome-wide nucleosome distribution. Here we introduce a simple statistical mechanics model to describe DNA sequence preferences of histone octamers. This model is valid for biochemically well-characterized nucleosome positioning elements, predicts nucleosome occupancy observed in vivo, and permits identification of deviations from the prediction, which can then be attributed to other chromatin organizing factors.
Several models have been proposed to describe the position of single histone octamers on DNA as a function of DNA sequence. Two different classes of models can be distinguished. The first class is based on the structural parameters of superhelical DNA organized in the nucleosome, as obtained from crystal structures, to predict the propensity to form a nucleosome with sequences other than those present in crystal structures (27–30). This approach has been applied mainly in single-histone-octamer positioning models and yielded an accuracy of several tens of base pairs. The second class uses dinucleotide probability functions based on distributions of dinucleotides found in natively assembled chromatin (23, 31–33). This latter approach has been successfully applied to predict the genome-wide distribution of nucleosomes. However, the large number of parameters that define these models and the low resolution of both the models and the experimental data prevent a detailed structural understanding of (genome-wide) nucleosome positioning.
Whether nucleosomes are assembled in vitro by means of salt dialysis or in vivo with the aid of chaperone enzymes, once assembled the thermodynamic properties of nucleosomes are identical. In both cases it involves the interaction between the histone octamer and a particular DNA sequence. A thermodynamic model describing the sequence-dependent interaction of a histone octamer should therefore capture both types of experimental data. None of the models presented before claim to be applicable for nucleosome positioning in both in vitro reconstitution experiments on well-defined positioning substrates and in vivo assembled chromatin. Here, we present such a generic nucleosome-positioning model based on assigning a probability score to each dinucleotide that depends only on the phasing of the dinucleotide. The resulting nucleosome-positioning likelihood map is converted to a sequence-specific energy landscape for nucleosome binding, predicting relative nucleosome affinities with high accuracy. By adding size exclusion effects and by introducing a chemical potential to account for the average sequence-independent nucleosome affinity (34–37), we relate well-documented high-resolution nucleosome positions obtained from in vitro reconstitution reactions on strong positioning sequences to genome-wide nucleosome occupancy maps, with high accuracy.
Results
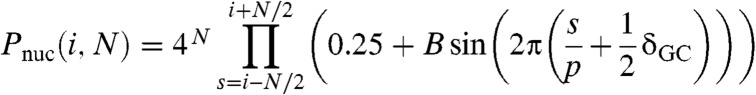
A variety of online programs exist to predict the nucleosome binding preference for a given DNA sequence (23, 27, 28, 33). Surprisingly, these models are unable to recognize any of the well-documented nucleosome positioning elements, such as the synthetic positioning element 601 (13), when embedded within a stretch of DNA of 1,000 random base pairs (Fig. S1). The model we put forward here is based on a periodic probability function for the distribution of the dinucleotides TA, TT, AA, and GC. All other dinucleotides are weighted such that the probability is normalized (Fig. 1). The choice of these dinucleotides is based on previous studies (32, 33), but the model differs from the experimentally found dinucleotide distribution because it lacks a further position dependence within the nucleosome. The likelihood ratio Pnuc (i, N) to find a nucleosome dyad at base pair i is modeled as
 |
[1] |
(for more details see Materials and Methods). Thus the model is fully parameterized by the amplitude B, period p, and the length N of the periodic probability function, reducing complexity to three parameters.
Fig. 1.

The probability functions of each dinucleotide to construct the probability matrix in our model are simple sinusoids with a variable periodicity, except for the dinucleotides starting with a cytosine (CA, CC, CG and CT), which are assumed not to affect nucleosome position. In these graphs the periodicity is 10.0 bp. The dinucleotides TA, TT, AA, and GC were given an equal probability amplitude B. GC has half a helical turn offset compared to the first three dinucleotides. The probability functions of the other dinucleotides are such that the sum of probability functions starting with the same nucleotide is unity.
Validation of the Dinucleotide Probability Function Using the 601 Positioning Sequence.
Overall, we find good agreement with published experimental data for B = 0.2, p = 10.0 bp, and N = 74 or 147 bp. To validate values for these three model parameters, we tested our algorithm with the synthetic 601 positioning element, incorporated in a random sequence of DNA (13).
Probability Amplitude.
In a random DNA sequence the probability to find any of the four nucleotides is 0.25. The value of the conditional probability amplitude B to find a specific dinucleotide is thus limited to values between 0 and 0.25. B = 0 corresponds to no sequence specificity for nucleosome binding and B = 0.25 corresponds to maximal sequence specificity. Varying B between 0.1 and 0.2 resulted in only a moderate change in the preference for the 601 positioning sequence (Fig. S2A). We therefore set the probability amplitude to 0.2—i.e., the saturating value for changes in histone-octamer positioning on the 601 sequence. This value is in close agreement with the measured amplitude of dinucleotide distributions of 0.16 ± 0.03 (31).
Extent of Sequence Specificity in Reconstitution Reactions.
Initially we tested calculated nucleosome positions using the full length of DNA that is wrapped around the nucleosome—i.e., N = 147 bp. This yields a preferred location that is 14 bp offset from the documented dyad position (Fig. 2A). However, in dialysis reconstitution, the (H3/H4)2 tetramer binds first and occupies 74 bp surrounding the dyad (38), and it is not until the salt concentration is reduced to about 600 mM (39) that the H2A/H2B dimers associate with the tetramer to wrap the remaining 73 bp into a complete nucleosome. This implies that a window of 74 bp rather than 147 bp defines the nucleosome position in reconstitution reactions (40). Indeed, we find that with a 74 bp window the highest predicted binding preference coincides with the experimentally determined 601 dyad (Fig. 2B) (30).
Fig. 2.

Modeling of the nucleosome binding characteristics of the 601 positioning element. (A) The binding preference of a histone octamer to the 601 positioning element calculated with B = 0.2, p = 10.1 bp, and N = 146 bp (77). Position i is relative to the known dyad position. The highest binding preference in the 601 sequence is modeled at position +14 bp from the dyad position. (B) When the histone binding window N is reduced to 74 bp, corresponding to binding of a (H3/H4)2 tetramer, the highest likelihood score coincides exactly with the dyad position. (C) The energy landscape for nucleosome positioning on the 601 element. At the dyad position, the predicted free binding energy is -8.0 kBT.
The fact that in vitro reconstitution does not yield nucleosomes at their thermodynamically most favorable positions has been observed by Flaus and Owen-Hughes (41). They showed that sites to which nucleosomes are deposited during chromatin assembly on a mouse mammary tumor virus substrate differ from those favored during thermal equilibration or enzymatic remodeling by ISWI. We observed a similar shift of the preferred position of 601 nucleosomes after remodeling by RSC (5), indicating that in vitro assembly by salt dialysis puts different constraints on nucleosome positioning than a fully assembled nucleosome does. The current analysis suggests that histone (H3/H4)2 tetramers are kinetically trapped during reconstitution, explaining the reduced size of the DNA sequence that defines positioning.
Dinucleotide Periodicity.
The periodicity p of dinucleotide distributions in nucleosomes has been reported to be approximately 10 bp (31, 33). This matches the pitch of the DNA helix, which varies between 9.7 and 11 bp in nucleosomes, depending on the DNA sequence and the origin of the histone core particles (42). Using a binding window of 74 bp, we found a strong binding preference for 9.2 < p < 10.2 on the 601 sequence (Fig. S2B), with a maximum at p = 10.1 bp.
In conclusion, by using a 10.1 bp periodic probability function for the dinucleotides TA, TT, AA, and GC, together with a binding window of 74 bp, representing initial DNA binding by the (H3/H4)2 histone tetramer, we are able to reproduce the preferred 601 nucleosome position with single bp accuracy. This is a nontrivial result as existing models do not resolve a preference for the 601 sequence (Fig. S1), which is one of the strongest known nucleosome positioning sequences (13). For a 601 positioning sequence integrated in a random DNA fragment our simple 3 parameter model also yielded a 3,000-fold enrichment at the correct dyad position relative to DNA lacking sequence specificity, corroborating the widely shared experience with nucleosome reconstitution reactions using this substrate (43, 44).
Dyad Positions of Single Positioning Elements can be Accurately Predicted.
We next explored how generic the positioning parameters that we obtained from the 601 positioning element apply to other well-known positioning sequences. We applied the same procedure to the 5S rDNA gene originating from Lytechinus variegatus (45) (Fig. S3). Maxima in nucleosome affinity were found for a dinucleotide periodicity varying between 9.4 and 9.8—i.e., slightly smaller than that of the 601 sequence (Fig. S3C). Using p = 9.75, N = 74 bp, and B = 0.2 yielded two positions with a high preference for nucleosome formation, at 0 and 18 bp (Fig. S3A). Site-directed hydroxyl radical mapping of nucleosome positions after salt dialysis reconstitution by Flaus et al. (46) previously determined two dominant dyad positions at 1 ± 2 and 19 ± 2 bp. Hence, we conclude that also the natural positioning element 5S rDNA is accurately described by our model.
We extended this characterization to other nucleosome positioning elements (Table S1) to detect their respective dyad positions, analogous to a previously published study (30), using N = 74 bp, B = 0.2, and p = 10.0 bp. As shown in Fig. 3A, our model is able to locate dyad position(s) within 2 bp, except for the pGUB nucleosome positioning element, where we detect only one of the two mapped dyad positions (30). Altogether, the above shows that the dyad positions of nucleosomes reconstituted on multiple positioning elements can be mapped at bp accuracy by our model.
Fig. 3.

Binding characteristics of various nucleosome positioning elements (Table S1) expressed as dyad positions (A) and free energy of binding (B) by using N = 74 bp, B = 0.2, and p = 10.0 bp. (A) The red circles represent the difference between predicted and experimentally obtained dyad positions (30). (B) The modeled data is compared to calorimetric experiments for the free energy of binding relative to the 5S rDNA positioning element yielding a Pearson’s correlation coefficient of 0.88. The dashed line represents a perfect match between experimental and modeled data.
Calculation of the Free Energy of Nucleosome Formation.
Having tested the ability to predict the position of single nucleosome positioning elements, we now test whether the model has predictive power for nucleosome binding affinity, as reported for multiple positioning sequences (13, 30, 45, 47, 48). In these affinity experiments, the assembly process was dominated by the histone tetramer (40). This implies that the binding size of a tetramer, 74 bp, should be used to calculate the associated free energy. As we determine the binding likelihood ratio relative to random DNA sequences, which lack any binding preferences, the difference in free energy due to nucleosome formation is obtained from the Boltzmann distributed likelihood ratio. The resulting energy landscape for the 601 positioning sequence is depicted in Fig. 2C. At the dyad position we find a difference in free energy ΔG relative to random sequences of -8.0 kBT. In the case of the 5S rDNA sequence, the two dyad positions have an average free energy of binding ΔG of -2.5 kBT with respect to random sequences (Fig. S3A). Taken together, this yields a free energy of binding to the 601 positioning element with respect to the 5S rDNA sequence ΔΔG of -5.5 kBT. This is in good agreement with calorimetric measurements yielding a free energy of binding ΔΔG of -4.9 ± 0.3 kBT (40, 49) with respect to the 5S rDNA sequence (Fig. 3B). Extension of this method to obtain the free energy of binding for other sequences with respect to the 5S rDNA sequence (summarized in Table S1) yields a good agreement with the experimental and calculated ΔΔG with a Pearson’s correlation coefficient of 0.88 (Fig. 3B). The above illustrates that the model presented here accurately predicts the energies involved for both strong and weak nucleosome positioning sequences.
Genome-Wide Nucleosome Occupancy.
Above we focused on the preferential binding of histone octamers to single nucleosome positioning elements. Now, we extend our analysis to genome-wide prediction of histone-octamer positions. We expect the model parameters to be generic and thus independent of the details of specific genomic regions or different species. To test the ability to predict genome-wide DNA-histone interactions, we expanded our model for binding of multiple histone octamers on the same DNA substrate. Binding of a histone octamer will block potential binding sites for other histone octamers. Furthermore, a strongly positioned histone octamer may position other histone octamers, in a process known as statistical positioning (50). Both these effects are taken into account by applying Percus’ equation (34–37) to the energy landscape for nucleosome positioning (Materials and Methods). The Percus equation introduces a fourth parameter, the chemical potential, defining the average DNA affinity of the histone octamers, which depends on their relative concentrations. We used a size exclusion of 147 bp, corresponding to the histone octamer DNA footprint. To match the limited accuracy of the experimental data we applied an averaging window of 10 bp to the energy landscape.
With this extended model we used a 2 parameter fit to 20 kbp sections of genome-wide nucleosome occupancy maps derived from salt-dialysis nucleosome reconstitution on isolated-yeast-genomic DNA (33). To minimize the number of free parameters we fixed the probability amplitude (B = 0.2) and positioning window (N = 74 bp) to obtain the dinucleotide periodicity and chemical potential. Fig. 4A shows a logarithmic plot of nucleosome occupancy on a representative part of yeast chromosome XII. A value greater than 0 indicates an affinity for nucleosome formation, whereas a value lower than 0 indicates nucleosome depletion with respect to the overall binding occupancy of the entire genome. The outcome of the fitted nucleosome occupancy is shown in Fig. 4A (red line). The obtained values for the dinucleotide periodicity, the chemical potential, and the Pearson’s correlation coefficient are summarized in Table 1. The correlation of the datasets over the entire chromosome is plotted in Fig. 4C. We obtained a dinucleotide periodicity of 10.1 bp that closely matches the values reported in literature (31). As shown in Fig. 4C, a direct proportionality is found between the experimental and fitted nucleosomal occupancy. Note that the Pearson correlation coefficients (0.66–0.87) are similar to those reported by Kaplan et al. (23) using a much more elaborate model, despite the fact that, contrary to Kaplan et al. (23), we did not apply a renormalization of the nucleosome occupancy data.
Fig. 4.

Comparison of the fitted nucleosome occupancy with genome-wide nucleosome occupancy obtained after in vitro nucleosome reconstitution and with data obtained after mock reconstitution (Materials and Methods). (A) Logarithmic plot of the nucleosome occupancy with respect to the dyad position on the DNA sequence of a part of chromosome XII on yeast DNA after in vitro reconstitution of histone octamers (black line) and our model (red line). A value greater than 0 indicates an affinity for nucleosome formation, whereas a value lower than 0 indicates nucleosome depletion with respect to the overall binding occupancy of the entire genome. The obtained values for the dinucleotide periodicity and the chemical potential are summarized in Table 1. (B) Same as A, comparing the dinucleotide model to the data obtained from bare DNA. (C) A density dot plot comparison of the entire chromosome. The color of each point represents the number of bp that map to that point in the graph. The Pearson correlation coefficient between the maps is indicated in Table 1. The dashed line in Fig. 4 C and D indicates a perfect agreement between the experimental and modeled data. Note that the experimental data was not renormalized; renormalization can change the slope of the correlation plot to unity. (D) Comparing the dinucleotide model to experimental data obtained in parallel to A but using mock-reconstituted (bare) DNA, showing that systematic experimental errors such as MNase sequence preferences or PCR bias cannot account for the high correlation between our model and the experimental nucleosome occupancy data.
Table 1.
The fitted values for the dinucleotide periodicity and the chemical potential for different genome-wide data sets obtained at varying fit windows. The Pearson’s correlation coefficient indicates the correlation between the experimental and fitted data
| Dinucleotide periodicity (bp) | Chemical potential (kBT) | Pearson’s correlation coefficient | Fitting window size (bp) | |
| In vitro | 10.13 ± 0.04 | −1.5 ± 0.2 | 0.74 | 20 000 |
| Bare DNA | 10.10 ± 0.05 | −0.6 ± 0.3 | 0.23 | 20 000 |
| In vitro (23) | 10.10 ± 0.05 | −2.0 ± 0.3 | 0.74 | 20 000 |
| In vivo (23) | 10.19 ± 0.02 | −10.4 ± 0.4 | 0.66 | 20 000 |
| In vitro (23) | 10.14 ± 0.17 | −1.9 ± 1.2 | 0.87 | 400 |
| In vivo (23) | 10.20 ± 0.10 | −10.7 ± 1.7 | 0.83 | 400 |
The remarkably large apparent role of DNA sequence in organizing nucleosome positions in vivo has led to a lively debate about the methodology used to obtain genome-wide nucleosome maps (25). Part of this discussion focuses on the role of the known sequence preference of micrococcal nuclease (MNase), which is difficult to disentangle from nucleosomal sequence preferences. To discriminate these effects, and other systematic methodological errors, we compared MNase digestion of bare genomic DNA with reconstituted nucleosomal genomic DNA. The latter experiment reproduced the data from Kaplan et al. (23). Although the bare genomic DNA lacks histone octamers, we still describe the outcome of the Illumina deep-sequencing experiment on bare DNA MNase cleavage products as “nucleosome occupancy,” following the same procedure and terminology as before. We fitted our model to this data set, as shown in Fig. 4B. The poor quality of the fit, as quantified by a Pearson’s correlation coefficient of only 0.23 (Fig. 4D, Table 1), as well as the poor correlation with experimental nucleosome occupancy maps, indicates that MNase sequence preferences cannot account for a large majority of the observed nucleosome occupancy signals.
Nucleosome Positioning in Vivo.
One of the most remarkable observations by Kaplan et al. (23) is the very high correlation between nucleosome occupancies measured on the yeast genome assembled in vitro and in vivo. This would suggest that other molecular determinants, such as the presence of histone variants, histone post-translational modifications, chromatin remodelers, and other DNA organizing proteins, play a limited role in chromatin organization relative to DNA sequence. If this is the case—i.e., nucleosome positioning is dominated by the thermodynamic properties of DNA and histone association—and if our model is accurate, then a majority of the measured positioning signal should be captured by our model. Here we test whether this is a good approximation and look for the locations where the thermodynamic model seems to fail, pointing to the involvement of other molecular determinants.
The nucleosome occupancy of a typical section of yeast chromosome I is depicted in Fig. 5A (reconstituted in vitro) and D (in vivo). Fitting the in vivo reconstitution data set with a Levenberg-Marquadt routine using N = 74 bp did not converge to a stable result. When we expanded the positioning window to N = 147 bp, however (Fig. 5A, red line), we obtained a good fit with a periodicity close to that obtained for the in vitro data set (Table 1). This implies that in vivo nucleosome occupancy is determined by the DNA sequence that wraps the full octamer rather than the (H3/H4)2 tetramer. Such behavior is much like the shifted positions that are preferred after thermal or enzymatic remodeling of in vitro reconstituted chromatin fragments (5, 41) and emphasizes the central role of chromatin remodelers in in vivo nucleosome positioning (51). The obtained chemical potential in vivo is lower than for in vitro—i.e., -10.4 ± 0.4 and -2.0 ± 0.3 kBT, respectively (Table 1). This lower-chemical-potential obtained from in vivo data reflects the higher density of nucleosomes that is found in natively assembled chromatin, as well as the larger effective binding window, which increases histone affinity. Despite fitting only two free parameters we obtain a high Pearson’s correlation coefficient, comparable to that reported by Kaplan et al. (23). Thus our generic model can accurately describe genome-wide nucleosome occupancy of both in vitro reconstituted and in vivo assembled chromatin. As the obtained periodicity is very reproducible over all datasets and the chemical potential is constant within the cell and expected to be maintained between different cells, we can use these parameters to predict nucleosome occupancy on other DNA sequences. The values of B, p, and N presented here can thus be used for predictions, though the chemical potential may vary between species or experiments. It is nevertheless clear that the model performs better for in vitro data than for in vivo, with the latter requiring a binding window size that includes DNA binding to histones H2A and H2B.
Fig. 5.

Genome-wide nucleosome occupancy for in vitro and in vivo experimental data by Kaplan et al. (23) compared to our fitted nucleosome occupancy with different fitting windows. (A) Logarithmic plot of the nucleosome occupancy with respect to the dyad position on the DNA sequence of a part of yeast chromosome I of the in vitro reconstituted DNA (black line) and our model with fitting windows of 20 kbp or 400 bp (respectively red and green line). The obtained values for the dinucleotide periodicity and the chemical potential are summarized in Table 1. (B and C) A density dot plot comparison between the nucleosome occupancy per bp of the in vitro data (x axis) and that obtained by our model with a fitting window of 20 kbp and 400 bp. The dashed line in Fig. 5B indicates perfect agreement between the experimental and modeled data. Note that we did not renormalize both data sets as was done in ref. 23. (D) Same as A, comparing the dinucleotide model to the in vivo data. The obtained values for the dinucleotide periodicity and the chemical potential are summarized in Table 1. (E and F) Same as B and C comparing the dinucleotide model to the in vivo data with a fitting window of respectively 20 kbp and 400 bp.
Local Deviations from the Predicted Nucleosome Occupancy.
Above we maintained a strict statistical mechanics description of nucleosome positioning with a minimal number of free parameters and assumed that the thermodynamic properties of all nucleosomes were identical. By allowing some variation in the affinity of histones to the DNA we can capture other effects that may regulate nucleosome positioning, such as histone variants, histone post-translational modifications, and the presence of DNA binding factors that compete for the same DNA. We implement this extra degree of freedom by reducing the fitting window from 20 kbp to 400 bp, describing the interaction with DNA of approximately two histone octamers at a time (Fig. 5, green line; Table 1). This extra degree of freedom results in an increase in the Pearson’s correlation coefficient (Table 1). The apparent chemical potential now reflects the local histone affinity and yields a distribution for both data sets that is much larger than for the 20 kbp averaged values (Fig. 6 A and B and Table 1). It is interesting to note that the distribution of the apparent chemical potential of the in vitro data can be described by a single Gaussian profile with a width of 1 kBT, corresponding to thermal fluctuations of a limited number of nucleosomes, whereas the local fits to the in vivo data display a wider, bimodal distribution (Fig. 6). This reflects the fact that in vitro reconstitutions are performed in the absence of other factors and that possible variations in post-translational modification are statistically distributed over all the nucleosomes, whereas in natively assembled chromatin, variations in histone content are due to biochemical activities recruited to specific DNA loci.
Fig. 6.

(A) The distribution of the apparent chemical potential for the in vitro experimental data shows a normal distribution with a standard deviation of 1 kBT. (B) The distribution of the apparent chemical potential for the in vivo experimental data shows a shoulder representing nucleosomes with a higher apparent affinity. (C) The average apparent chemical potential around transcription start sites (TSS) in the yeast genome (23). The apparent chemical potential in vitro shows a constant value around the TSS (black), whereas the apparent chemical potential in vivo shows a decrease at the start of the open reading frame (red). The difference in the apparent chemical potential between in vitro and in vivo shows a clear decrease in potential at the start of the open reading frame (blue) indicating that the strongly positioned nucleosome +1 is not solely defined by the DNA sequence rules employed by the model.
The average distribution of nucleosomes around transcription start sites (TSS) is regulated in vivo (52–55). In yeast and other eukaryotic cells, the +1 nucleosome is well positioned and the degree of positioning decreases progressively downstream in the coding region. Around the TSS, a region of nucleosome depletion is observed (56–59). If DNA sequence is the main determinant for nucleosome occupancy, the apparent chemical potential should be constant around the TSS. Analysis of the fraction of DNA segments that displayed the lower apparent chemical potential in vivo showed that this fraction is highly enriched near TSSs. Upon aligning the apparent chemical potential around the TSS, we clearly observed a decrease in apparent chemical potential in in vivo chromatin at the +1 nucleosome and a slight increase around the -1 nucleosome (Fig. 6C, red line). This is not encoded in the DNA sequence as the in vitro data display much smaller deviations from the average potential. To correct for these small variations, we plotted the difference in average chemical potential between in vivo and in vitro assembled chromatin (Fig. 6C, blue line). The decreased apparent potential around nucleosome +1, corrected for genetically defined differences, implies that factors other than DNA-histone interactions are indeed responsible for the increased observed occupancy of histones around TSSs.
Discussion
We present an empirical statistical mechanics model based solely on the periodic occurrence of the dinucleotides TA, TT, AA, and GC, that is sufficient to identify nucleosome positioning sequences down to several base pair accuracy and to predict sequence dependent affinity differences with about 2 kBT accuracy. Different models exist to either position single histone octamers locally in nucleosome positioning elements or to describe nucleosome occupancy genome-wide (23, 27–30). In the case of single nucleosome positioning elements, those models are able to predict nucleosome dyads within 10 bp, but they fail to predict the free energy of binding obtained by calorimetry (30). The model we describe here is, to our knowledge, the first to (i) capture both dyad position and free energy of binding accurately and (ii) connect single nucleosome positioning in vitro to genome-wide nucleosome occupancy mapping in vivo.
A recent report (60) put emphasis on the TA dinucleotide, whereas we employ three additional dinucleotides, in line with experimental data from Travers et al. (32). Omission of any of these dinucleotides reduced the accuracy of the predicted relative affinity, indicating that all four are important (see Fig. S4). It should be possible to refine the model by determining the amplitude of the probability functions for all possible dinucleotides separately. This would add eight free parameters to the model, which we could not confidently substantiate using the limited number of biochemically well-characterized nucleosome positioning elements. From this work, it appears that attributing equal amplitudes to the four dominant dinucleotides captures many detailed features that have not been modeled in a consistent fashion before.
The potential energy landscape for nucleosome positioning provides a framework to analyze more complex chromatin structures. Here we uniquely relate data obtained from in vitro reconstituted high-resolution single nucleosome positioning sequences to genome-wide nucleosome maps. The latter data are only available with a resolution of about 10 bp. We therefore apply a 10-bp averaging filter to the calculated energy landscape that enters Percus’ equation. Omitting this 10 bp averaging of the energy landscape dramatically reduces the correlation between the model and experimental data (Fig. S5). Besides the limited accuracy of reported nucleosome occupancy maps, which would warrant smoothing of the energy landscape, there can be physical mechanisms that reduce the barriers between favorable nucleosome positions as well. Whereas the most favorable positions in the energy landscape represent stable canonical nucleosomes, at the peaks in the energy landscape it may be possible for the nucleosomes to adopt alternative conformations such as partial unwrapping (44, 61) or inclusion of twist or stretch defects (62, 63). Using such alternative conformations the nucleosome may evade the energy penalty for highly unfavorable out-of-phase positions and this may as a result decrease the barriers between the most favorable periodic nucleosome locations along the DNA.
In the case of genome-wide nucleosome occupancy predictions, some available models successfully capture both in vitro and in vivo systems (23, 64). Those models, however, are based on complex probability functions that were extracted from the same experimental data to which they were subsequently applied. None of these models have sufficient predictive power that their results can be transferred to other types of experiments. For instance, the model by Segal et al. (33) is unable to distinguish the 601 sequence from random DNA (Fig. S1) whilst its prediction accuracy for yeast data is 0.75. Here we applied a statistical mechanics approach validated on a limited set of well-characterized nucleosome positioning sequences to construct probability functions that predict nucleosome occupancy with a similarly high correlation for in vivo genome-wide nucleosome occupancy in yeast.
For an even better description of nucleosome occupancy it was necessary to allow for local variations in the apparent chemical potential, by reducing effective DNA window sizes to 400 bp, accounting for two nucleosomes (Materials and Methods, Table 1). Biologically, such variations in apparent chemical potential may reflect the processive nature of DNA replication forks and the accompanying nucleosome assembly, as well as a modified molecular composition of the resident histones, such as inclusion of variants, post-translational modifications, or the competition with other factors that bind DNA. It will therefore be interesting to test whether differences in affinity can be due to histone variants and histone modifications.
Although DNA sequence appears to strongly influence histone-octamer binding, the DNA sequence does not appear to encode the distance between adjacent bound histone octamers observed with in vivo assembled chromatin (25). In order to maintain a controlled distribution of distances, nucleosomes need to be repositioned, most likely by ATP-dependent chromatin-remodeling enzymes such as ACF and CHD1 (65–69). Catalyzed nucleosome repositioning has been the subject of numerous experimental and theoretical studies (5, 70–74) but the exact mechanism by which these proteins move the histones along the DNA sequence remains unclear, partially because the mechanisms of remodelers can be heavily convoluted with nucleosome positioning effects that are encoded in the DNA.
The model we present here should enable both theoretical and empirical research on chromatin processes that depend on nucleosome occupancy and positioning. The 10 bp steps observed upon enzymatic nucleosome repositioning in the 601 sequence by yeast RSC (5), Drosophila Mi-2 (5), and Drosophila NURF (73), for example, coincide with the 10 bp peak distribution of the 601 binding energy landscape, modeled here. This suggests that the sequence-dependent energy landscape of the nucleosome can play a dominant role during ATP-dependent nucleosome repositioning, because the energy landscape of nucleosome positioning will define both the kinetics and thermodynamics of these processes, not only in terms of favored nucleosome destinations but also by its influence on translocation processivity and direction. Extension of the current model may play an important role in disentangling DNA sequence from histone and chromatin remodeler-specific effects. A fundamental understanding of the nucleosome sequence preferences as presented here is a requirement for elucidating the role of DNA sequence in chromatin organization in vivo, where the nucleosomes are continuously exposed to enzymatic nucleosome remodeling.
Materials and Methods
Prediction Model.
Here, we test the hypothesis that dinucleotide probability functions are able to predict nucleosome binding preferences. For this, we apply a bottom-up approach by assuming that the probability functions are based on a periodic distribution of TA, TT, AA, and GC (Fig. 1). The first three dinucleotides may play an important role in bending the DNA, whereas GC has been implicated to predominantly affect DNA twisting (75). In natural and synthetic nucleosome positioning elements, these dinucleotides are spaced with a periodicity p of approximately 10 bp, where the dinucleotide GC is 5 bp out of phase compared to the dinucleotides AA, TA, and TT. We model their periodic distribution within the nucleosome as
 |
[2] |
where Y denotes the nucleotide A, C, G, or T. The subscript s indicates the position of the nucleotide in the nucleosome relative to the dyad. P0 is the average probability to find one of the four nucleotides at position s and equals 0.25. B is the amplitude with which the dinucleotides are distributed in nucleosomes. The preference of GC dinucleotides to face outwards of the nucleosome, while TA, TT, and AA preferentially face inwards, is incorporated by δGC, the Kronecker delta function, being 1 for a GC dinucleotide and zero otherwise. For the remaining dinucleotides the conditional probability is normalized:
 |
[3] |
Thus the distribution of dinucleotides starting with a C in the nucleosome, P(Y|C) is constant and equals P0. The dinucleotides AC, AG, and AT follow 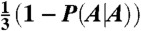 , GA, GG, and GT follow
 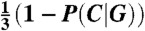 , and TC and TG follow
  , because P(A|T) = P(T|T). The likelihood to find the dyad of a nucleosome at position i in a specific DNA sequence is proportional to the product of the conditional probabilities of all of the dinucleotides in the nucleosome,
  with N equal to the DNA footprint of the histone octamer or tetramer. For a fully random DNA sequence, all dinucleotide positioning preferences average out yielding
 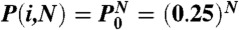 , resulting in Eq. 1.
The Boltzmann distributed likelihood ratios are converted to a free energy landscape ΔG(i) by
| [4] |
where kB is Boltzmann’s constant and T the absolute temperature.
The nucleosome positioning prediction model described so far takes only one of the two strands into account, i.e. the Watson strand of a double-stranded DNA molecule. In most models this symmetry is implicitly imposed by the lack of detail (23, 30, 33) yielding an exact match between the normal and the reverse complementary strand. Here, the free energy landscapes calculated from either strand differ slightly from each other because the conditional probability for the dinucleotides AT and GC is not symmetrical (Fig. S2). We compute the effective free energy landscape from the Boltzmann weighted average of both strands.
Calculating the nucleosome occupancy genome-wide, a 10 bp low-pass filter is applied to the free energy landscape. Variation of this filter between 8 and 100 bp does not result in significant changes in the obtained Pearson’s correlation coefficient, whereas for a filter window below 8 bp the Pearson’s correlation coefficient drops to zero (Fig. S5).
The interaction among multiple histone octamers on a finite stretch of DNA leads to additional nucleosome positioning effects known as “statistical positioning.” Physically this effect can be modeled as a fluid of 1D rods with a finite size, distributed in a free energy landscape (34–37). The nucleosomes are in contact with a thermal bath, which allows the nucleosomes to move freely over the DNA to find their energetically most favorable positions. Furthermore, histone octamers can freely exchange with unbound octamers in a reservoir at chemical potential μ. We can use the free energy landscape obtained from Eq. 4 to calculate the thermodynamic equilibrium density of histone octamer positions, n(i), using Percus’s equation (34–37)
 |
[5] |
where μ is the chemical potential of the interaction between histones and DNA and σ the footprint of a histone octamer.
To compare the result of Eq. 5 with experimental genome-wide nucleosome occupancy maps we have to take into account that each nucleosome protects 147 bp from MNase digestion. To reproduce such nucleosome occupancy maps, we therefore convoluted the outcome of the Percus equation with a window of 147 bp around each nucleosome position. Thus each single bp peak in the nucleosome position map is converted into a 147 bp block with the same amplitude and center position in the nucleosome occupancy map.
The modeled data was fitted to 20 kbp sections of the experimental data using a Levenberg–Marquadt routine. This fit yielded the optimal values for the two free parameters, the periodicity of the dinucleotides p, and the chemical potential μ. Fitting a larger section did not change the outcome of the observed dinucleotide periodicity and chemical potential, but required more computational resources. Local variations in μ were revealed by fitting small 400 bp sections of DNA to Eq. 1. To exclude end-effects from the Percus’ equation, the section was extended with 1000 bp on both sides but only the central 400 bp part was used for comparison with experimental nucleosome occupancy data.
The Pearson’s correlation coefficient is calculated between model and experimental data without any renormalization, as opposed to others (23). The nucleosome occupancy of parts of the yeast genome, in particular those containing repetitive sequences, could not be determined experimentally. These parts were not included in our comparative analysis, though our algorithm calculated the nucleosome occupancy for the entire genome.
The algorithm described above is available online at http://bio.physics.leidenuniv.nl/~noort/cgi-bin/nup3_st.py.
Genome-Wide Nucleosome Occupancy.
In addition to the data reported in literature we produced two unique genome-wide experimental data sets on nucleosome occupancy as follows. Genomic DNA was purified from S. cerevisiae strain BY4741 (EUROSCARF) and histone octamers from G. gallus erythrocytes (76). The genomic DNA was mixed with histone octamers in a 1∶1 (nucleosomal) molar ratio with a final DNA concentration of 60 ng/μl in 2 M NaCl, 10 mM Tris pH 8.0, and 0.25 mM EDTA. The histones were reconstituted on DNA using a salt gradient dialysis against 10 mM Tris pH 8.0, and 0.25 mM EDTA and a sequence of decreasing salt concentrations: 1.8, 1.2, 1.0, 0.8, 0.6, 0, and 0 M NaCl. Each dialysis step lasted at least three hours. A control sample of DNA without histones was mock-reconstituted in parallel. Nucleosomal and bare DNA, with concentrations of 9 ng/μl, were digested with 3 mU/μl micrococcal nuclease (Worthington) at 37 °C in a total volume of 60 μl until the nucleosomal DNA was fragmented to 100–160 bp. For both the nucleosomal and bare samples, 100–160 bp–sized DNA was extracted from an agarose gel using the Qiagen gel selection kit. The size-selected DNA was prepared and sequenced on an Illumina GAII according to the manufacturer’s protocol, yielding between 15 and 20 million mapped reads. The number of reads that mapped to the sacCer2 genome was normalized per bp. For comparison of the datasets with the model, the 2 log of the normalized number of reads per bp was calculated.
Supplementary Material
ACKNOWLEDGMENTS.
Much of this work has been inspired by the late Jon Widom. We would like to dedicate this paper to his memory and his contributions to the field of chromatin research. We thank Helmut Schiessel, Guillaume Chevereau, Alan Arneodo, Timon Idema, Nils Becker, Wiepke Koopmans, and Bram van den Broek for useful discussions. This work is part of the research program of the Foundation for Fundamental Research on Matter (FOM), which is part of the Dutch Organization for Scientific Research (NWO).
Footnotes
The authors declare no conflict of interest.
This article is a PNAS Direct Submission.
See Author Summary on page 15088 (volume 109, number 38).
This article contains supporting information online at www.pnas.org/lookup/suppl/doi:10.1073/pnas.1205659109/-/DCSupplemental.
References
- 1.Luger K, Mader AW, Richmond RK, Sargent DF, Richmond TJ. Crystal structure of the nucleosome core particle at 2.8 angstrom resolution. Nature. 1997;389:251–260. doi: 10.1038/38444. [DOI] [PubMed] [Google Scholar]
- 2.Bustamante C, Marko JF, Siggia ED, Smith S. Entropic elasticity of lambda-phage DNA. Science. 1994;265:1599–1600. doi: 10.1126/science.8079175. [DOI] [PubMed] [Google Scholar]
- 3.Widom J. Role of DNA sequence in nucleosome stability and dynamics. Q Rev Biophys. 2001;34:269–324. doi: 10.1017/s0033583501003699. [DOI] [PubMed] [Google Scholar]
- 4.Chien FT, van Noort J. Ten years of tension on chromatin: Results from single molecule force spectroscopy. Curr Pharm Biotechnol. 2009;10:474–485. doi: 10.2174/138920109788922128. [DOI] [PubMed] [Google Scholar]
- 5.van Vugt JJFA, et al. Multiple aspects of ATP-dependent nucleosome translocation by RSC and Mi-2 are directed by the underlying DNA sequence. PLoS One. 2009;4:e6345. doi: 10.1371/journal.pone.0006345. [DOI] [PMC free article] [PubMed] [Google Scholar]
- 6.Balasubramanian S, Xu F, Olson WK. DNA sequence-directed organization of chromatin: Structure-based computational analysis of nucleosome-binding sequences. Biophys J. 2009;96:2245–2260. doi: 10.1016/j.bpj.2008.11.040. [DOI] [PMC free article] [PubMed] [Google Scholar]
- 7.Jiang CZ, Pugh BF. Nucleosome positioning and gene regulation: Advances through genomics. Nat Rev Genet. 2009;10:161–172. doi: 10.1038/nrg2522. [DOI] [PMC free article] [PubMed] [Google Scholar]
- 8.Zhang Y, et al. Evidence against a genomic code for nucleosome positioning. Nat Struct Mol Biol. 2010;17:920–923. doi: 10.1038/nsmb0810-920. [DOI] [PMC free article] [PubMed] [Google Scholar]
- 9.Pugh BF. A preoccupied position on nucleosomes. Nat Struct Mol Biol. 2010;17:923–923. doi: 10.1038/nsmb0810-923. [DOI] [PubMed] [Google Scholar]
- 10.Kaplan N, et al. Nucleosome sequence preferences influence in vivo nucleosome organization. Nat Struct Mol Biol. 2010;17:918–920. doi: 10.1038/nsmb0810-918. [DOI] [PMC free article] [PubMed] [Google Scholar]
- 11.Simpson RT, Stafford DW. Structural features of a phased nucleosome core particle. Proc Natl Acad USA. 1983;80:51–55. doi: 10.1073/pnas.80.1.51. [DOI] [PMC free article] [PubMed] [Google Scholar]
- 12.Fitzgerald DJ, Anderson JN. Unique translational positioning of nucleosomes on synthetic DNAs. Nucleic Acids Res. 1998;26:2526–2535. doi: 10.1093/nar/26.11.2526. [DOI] [PMC free article] [PubMed] [Google Scholar]
- 13.Lowary PT, Widom J. New DNA sequence rules for high affinity binding to histone octamer and sequence-directed nucleosome positioning. J Mol Biol. 1998;276:19–42. doi: 10.1006/jmbi.1997.1494. [DOI] [PubMed] [Google Scholar]
- 14.Dorigo B, Schalch T, Bystricky K, Richmond TJ. Chromatin fiber folding: Requirement for the histone H4N-terminal tail. J Mol Biol. 2003;327:85–96. doi: 10.1016/s0022-2836(03)00025-1. [DOI] [PubMed] [Google Scholar]
- 15.Simpson RT, Kunzler P. Chromatin and core particles formed from the inner histones and synthetic polydeoxyribonucleotides of defined sequence. Nucleic Acids Res. 1979;6:1387–1415. doi: 10.1093/nar/6.4.1387. [DOI] [PMC free article] [PubMed] [Google Scholar]
- 16.Prunell A. Nucleosome reconstitution on plasmid-inserted Poly(dA).Poly(dT) EMBO J. 1982;1:173–179. doi: 10.1002/j.1460-2075.1982.tb01143.x. [DOI] [PMC free article] [PubMed] [Google Scholar]
- 17.Struhl K. Naturally occurring Poly(dA-dT) sequences are upstream promoter elements for constitutive transcription in yeast. Proc Natl Acad Sci USA. 1985;82:8419–8423. doi: 10.1073/pnas.82.24.8419. [DOI] [PMC free article] [PubMed] [Google Scholar]
- 18.Chen W, Tabor S, Struhl K. Distinguishing between mechanisms of eukaryotic transcriptional activation with bacteriophage-T7 RNA-polymerase. Cell. 1987;50:1047–1055. doi: 10.1016/0092-8674(87)90171-1. [DOI] [PubMed] [Google Scholar]
- 19.Iyer V, Struhl K. Poly(dA-dT), a ubiquitous promoter element that stimulates transcription via its intrinsic DNA structure. EMBO J. 1995;14:2570–2579. doi: 10.1002/j.1460-2075.1995.tb07255.x. [DOI] [PMC free article] [PubMed] [Google Scholar]
- 20.Anderson JD, Widom J. Poly(dA-dT) promoter elements increase the equilibrium accessibility of nucleosomal DNA target sites. Mol Cell Biol. 2001;21:3830–3839. doi: 10.1128/MCB.21.11.3830-3839.2001. [DOI] [PMC free article] [PubMed] [Google Scholar]
- 21.Sekinger EA, Moqtaderi Z, Struhl K. Intrinsic histone-DNA interactions and low nucleosome density are important for preferential accessibility of promoter regions in yeast. Mol Cell. 2005;18:735–748. doi: 10.1016/j.molcel.2005.05.003. [DOI] [PubMed] [Google Scholar]
- 22.Segal E, Widom J. Poly(dA-dT) tracts: Major determinants of nucleosome organization. Curr Opin Struct Biol. 2009;19:65–71. doi: 10.1016/j.sbi.2009.01.004. [DOI] [PMC free article] [PubMed] [Google Scholar]
- 23.Kaplan N, et al. The DNA-encoded nucleosome organization of a eukaryotic genome. Nature. 2009;458:362–366. doi: 10.1038/nature07667. [DOI] [PMC free article] [PubMed] [Google Scholar]
- 24.Zhang Y, et al. Intrinsic histone-DNA interactions are not the major determinant of nucleosome positions in vivo. Nat Struct Mol Biol. 2009;16:847–852. doi: 10.1038/nsmb.1636. [DOI] [PMC free article] [PubMed] [Google Scholar]
- 25.Stein A, Takasuka TE, Collings CK. Are nucleosome positions in vivo primarily determined by histone-DNA sequence preferences? Nucleic Acids Res. 2010;38:709–719. doi: 10.1093/nar/gkp1043. [DOI] [PMC free article] [PubMed] [Google Scholar]
- 26.Klug A, Rhodes D, Smith J, Finch JT, Thomas JO. A low resolution structure for the histone core of the nucleosome. Nature. 1980;287:509–516. doi: 10.1038/287509a0. [DOI] [PubMed] [Google Scholar]
- 27.Tolstorukov MY, Choudhary V, Olson WK, Zhurkin VB, Park PJ. nuScore: A web-interface for nucleosome positioning predictions. Bioinformatics. 2008;24:1456–1458. doi: 10.1093/bioinformatics/btn212. [DOI] [PMC free article] [PubMed] [Google Scholar]
- 28.Levitsky VG, Podkolodnaya OA, Kolchanov NA, Podkolodny NL. Nucleosome formation potential of eukaryotic DNA: Calculation and promoters analysis. Bioinformatics. 2001;17:998–1010. doi: 10.1093/bioinformatics/17.11.998. [DOI] [PubMed] [Google Scholar]
- 29.Miele V, Vaillant C, d’Aubenton-Carafa Y, Thermes C, Grange T. DNA physical properties determine nucleosome occupancy from yeast to fly. Nucleic Acids Res. 2008;36:3746–3756. doi: 10.1093/nar/gkn262. [DOI] [PMC free article] [PubMed] [Google Scholar]
- 30.Morozov AV, et al. Using DNA mechanics to predict in vitro nucleosome positions and formation energies. Nucleic Acids Res. 2009;37:4707–4722. doi: 10.1093/nar/gkp475. [DOI] [PMC free article] [PubMed] [Google Scholar]
- 31.Satchwell SC, Drew HR, Travers AA. Sequence periodicities in chicken nucleosome core DNA. J Mol Biol. 1986;191:659–675. doi: 10.1016/0022-2836(86)90452-3. [DOI] [PubMed] [Google Scholar]
- 32.Drew HR, Travers AA. DNA bending and its relation to nucleosome positioning. J Mol Biol. 1985;186:773–790. doi: 10.1016/0022-2836(85)90396-1. [DOI] [PubMed] [Google Scholar]
- 33.Segal E, et al. A genomic code for nucleosome positioning. Nature. 2006;442:772–778. doi: 10.1038/nature04979. [DOI] [PMC free article] [PubMed] [Google Scholar]
- 34.Percus JK. Model for density variation at a fluid surface. J Stat Phys. 1976;15:423–435. [Google Scholar]
- 35.Vanderlick TK, Scriven LE, Davis HT. Solution of Percus’ equation for the density of hard rods in an external field. Phys Rev A. 1986;34:5130–5131. doi: 10.1103/physreva.34.5130. [DOI] [PubMed] [Google Scholar]
- 36.Chevereau G, Palmeira L, Thermes C, Arneodo A, Vaillant C. Thermodynamics of intragenic nucleosome ordering. Phys Rev Lett. 2009;103:188103. doi: 10.1103/PhysRevLett.103.188103. [DOI] [PubMed] [Google Scholar]
- 37.Milani P, et al. Nucleosome positioning by genomic excluding-energy barriers. Proc Natl Acad Sci USA. 2009;106:22257–22262. doi: 10.1073/pnas.0909511106. [DOI] [PMC free article] [PubMed] [Google Scholar]
- 38.Dong F, van Holde KE. Nucleosome positioning is determined by the (H3-H4)2 tetramer. Proc Natl Acad Sci USA. 1991;88:10596–10600. doi: 10.1073/pnas.88.23.10596. [DOI] [PMC free article] [PubMed] [Google Scholar]
- 39.Bohm V, et al. Nucleosome accessibility governed by the dimer/tetramer interface. Nucleic Acids Res. 2011;39:3093–3102. doi: 10.1093/nar/gkq1279. [DOI] [PMC free article] [PubMed] [Google Scholar]
- 40.Thastrom A, Bingham LM, Widom J. Nucleosomal locations of dominant DNA sequence motifs for histone: DNA interactions and nucleosome positioning. J Mol Biol. 2004;338:695–709. doi: 10.1016/j.jmb.2004.03.032. [DOI] [PubMed] [Google Scholar]
- 41.Flaus A, Owen-Hughes T. Dynamic properties of nucleosomes during thermal and ATP-driven mobilization. Mol Cell Biol. 2003;23:7767–7779. doi: 10.1128/MCB.23.21.7767-7779.2003. [DOI] [PMC free article] [PubMed] [Google Scholar]
- 42.Davey CA, Sargent DF, Luger K, Maeder AW, Richmond TJ. Solvent mediated interactions in the structure of the nucleosome core particle at 1.9 angstrom resolution. J Mol Biol. 2002;319:1097–1113. doi: 10.1016/S0022-2836(02)00386-8. [DOI] [PubMed] [Google Scholar]
- 43.Koopmans WJA, Brehm A, Logie C, Schmidt T, van Noort J. Single-pair FRET microscopy reveals mononucleosome dynamics. J Fluoresc. 2007;17:785–795. doi: 10.1007/s10895-007-0218-9. [DOI] [PMC free article] [PubMed] [Google Scholar]
- 44.Koopmans WJA, Buning R, Schmidt T, van Noort J. spFRET using alternating excitation and FCS reveals progressive DNA unwrapping in nucleosomes. Biophys J. 2009;97:195–204. doi: 10.1016/j.bpj.2009.04.030. [DOI] [PMC free article] [PubMed] [Google Scholar]
- 45.Lu AL, Steege DA, Stafford DW. Nucleotide sequence of a 5s-ribosomal RNA gene in the sea urchin Lytechinus variegatus. Nucleic Acids Res. 1980;8:1839–1853. doi: 10.1093/nar/8.8.1839. [DOI] [PMC free article] [PubMed] [Google Scholar]
- 46.Flaus A, Luger K, Tan S, Richmond TJ. Mapping nucleosome position at single base-pair resolution by using site-directed hydroxyl radicals. Proc Natl Acad Sci USA. 1996;93:1370–1375. doi: 10.1073/pnas.93.4.1370. [DOI] [PMC free article] [PubMed] [Google Scholar]
- 47.Widlund HR, et al. Identification and characterization of genomic nucleosome-positioning sequences. J Mol Biol. 1997;267:807–817. doi: 10.1006/jmbi.1997.0916. [DOI] [PubMed] [Google Scholar]
- 48.Cao H, Widlund HR, Simonsson T, Kubista M. TGGA repeats impair nucleosome formation. J Mol Biol. 1998;281:253–260. doi: 10.1006/jmbi.1998.1925. [DOI] [PubMed] [Google Scholar]
- 49.Thastrom A, Lowary PT, Widom J. Measurement of histone-DNA interaction free energy in nucleosomes. Methods. 2004;33:33–44. doi: 10.1016/j.ymeth.2003.10.018. [DOI] [PubMed] [Google Scholar]
- 50.Kornberg RD, Stryer L. Statistical distributions of nucleosomes: Nonrandom locations by a stochastic mechanism. Nucleic Acids Res. 1988;16:6677–6690. doi: 10.1093/nar/16.14.6677. [DOI] [PMC free article] [PubMed] [Google Scholar]
- 51.van Vugt JJFA, Ranes M, Campsteijn C, Logie C. The ins and outs of ATP-dependent chromatin remodeling in budding yeast: Biophysical and proteomic perspectives. Biochim Biophys Acta, Gene Struct Expression. 2007;1769:153–171. doi: 10.1016/j.bbaexp.2007.01.013. [DOI] [PubMed] [Google Scholar]
- 52.Mavrich TN, et al. A barrier nucleosome model for statistical positioning of nucleosomes throughout the yeast genome. Genome Res. 2008;18:1073–1083. doi: 10.1101/gr.078261.108. [DOI] [PMC free article] [PubMed] [Google Scholar]
- 53.Yuan GC, Liu JS. Genomic sequence is highly predictive of local nucleosome depletion. PLoS Comput Biol. 2008;4:e13. doi: 10.1371/journal.pcbi.0040013. [DOI] [PMC free article] [PubMed] [Google Scholar]
- 54.Valouev A, et al. A high-resolution, nucleosome position map of C. elegans reveals a lack of universal sequence-dictated positioning. Genome Res. 2008;18:1051–1063. doi: 10.1101/gr.076463.108. [DOI] [PMC free article] [PubMed] [Google Scholar]
- 55.Lantermann AB, et al. Schizosaccharomyces pombe genome-wide nucleosome mapping reveals positioning mechanisms distinct from those of Saccharomyces cerevisiae. Nat Struct Mol Biol. 2010;17:251–257. doi: 10.1038/nsmb.1741. [DOI] [PubMed] [Google Scholar]
- 56.McGhee JD, Wood WI, Dolan M, Engel JD, Felsenfeld G. A 200 base pair region at the 5′ end of the chicken adult beta-globin gene is accessible to nuclease digestion. Cell. 1981;27:45–55. doi: 10.1016/0092-8674(81)90359-7. [DOI] [PubMed] [Google Scholar]
- 57.Weiss E, Ruhlmann C, Oudet P. Transcriptionally active SV40 minichromosomes are restriction enzyme sensitive and contain a nucleosome-free origin region. Nucleic Acids Res. 1986;14:2045–2058. doi: 10.1093/nar/14.5.2045. [DOI] [PMC free article] [PubMed] [Google Scholar]
- 58.Svaren J, Schmitz J, Horz W. The transactivation domain of Pho4 is required for nucleosome disruption at the PHO5 promoter. EMBO J. 1994;13:4856–4862. doi: 10.1002/j.1460-2075.1994.tb06812.x. [DOI] [PMC free article] [PubMed] [Google Scholar]
- 59.Mavrich TN, et al. Nucleosome organization in the Drosophila genome. Nature. 2008;453:358–362. doi: 10.1038/nature06929. [DOI] [PMC free article] [PubMed] [Google Scholar]
- 60.Takasuka TE, Stein A. Direct measurements of the nucleosome-forming preferences of periodic DNA motifs challenge established models. Nucleic Acids Res. 2010;38:5672–5680. doi: 10.1093/nar/gkq279. [DOI] [PMC free article] [PubMed] [Google Scholar]
- 61.Polach KJ, Widom J. Mechanism of protein access to specific DNA sequences in chromatin: A dynamic equilibrium model for gene regulation. J Mol Biol. 1995;254:130–149. doi: 10.1006/jmbi.1995.0606. [DOI] [PubMed] [Google Scholar]
- 62.Kulic IM, Schiessel H. Nucleosome repositioning via loop formation. Biophys J. 2003;84:3197–3211. doi: 10.1016/S0006-3495(03)70044-7. [DOI] [PMC free article] [PubMed] [Google Scholar]
- 63.Kulic IM, Schiessel H. Chromatin dynamics: Nucleosomes go mobile through twist defects. Phys Rev Lett. 2003;91:148103. doi: 10.1103/PhysRevLett.91.148103. [DOI] [PubMed] [Google Scholar]
- 64.Field Y, et al. Distinct modes of regulation by chromatin encoded through nucleosome positioning signals. PLoS Comput Biol. 2008;4:e1000216. doi: 10.1371/journal.pcbi.1000216. [DOI] [PMC free article] [PubMed] [Google Scholar]
- 65.Bulger M, Ito T, Kamakaka RT, Kadonaga JT. Assembly of regularly spaced nucleosome arrays by Drosophila chromatin assembly factor 1 and a 56-kDa histone-binding protein. Proc Natl Acad Sci USA. 1995;92:11726–11730. doi: 10.1073/pnas.92.25.11726. [DOI] [PMC free article] [PubMed] [Google Scholar]
- 66.Blank TA, Becker PB. The effect of nucleosome phasing sequences and DNA topology on nucleosome spacing. J Mol Biol. 1996;260:1–8. doi: 10.1006/jmbi.1996.0377. [DOI] [PubMed] [Google Scholar]
- 67.Lusser A, Urwin DL, Kadonaga JT. Distinct activities of CHD1 and ACF in ATP-dependent chromatin assembly. Nat Struct Mol Biol. 2005;12:160–166. doi: 10.1038/nsmb884. [DOI] [PubMed] [Google Scholar]
- 68.Fyodorov DV, Kadonaga JT. Dynamics of ATP-dependent chromatin assembly by ACF. Nature. 2002;418:897–900. doi: 10.1038/nature00929. [DOI] [PubMed] [Google Scholar]
- 69.Racki LR, et al. The chromatin remodeller ACF acts as a dimeric motor to space nucleosomes. Nature. 2009;462:1016–1021. doi: 10.1038/nature08621. [DOI] [PMC free article] [PubMed] [Google Scholar]
- 70.Rippe K, et al. DNA sequence- and conformation-directed positioning of nucleosomes by chromatin-remodeling complexes. Proc Natl Acad Sci USA. 2007;104:15635–15640. doi: 10.1073/pnas.0702430104. [DOI] [PMC free article] [PubMed] [Google Scholar]
- 71.Liu N, Balliano A, Hayes JJ. Mechanism(s) of SWI/SNF-induced nucleosome mobilization. Chembiochem. 2011;12:196–204. doi: 10.1002/cbic.201000455. [DOI] [PMC free article] [PubMed] [Google Scholar]
- 72.Kassabov SR, Zhang B, Persinger J, Bartholomew B. SWI/SNF unwraps, slides, and rewraps the nucleosome. Mol Cell. 2003;11:391–403. doi: 10.1016/s1097-2765(03)00039-x. [DOI] [PubMed] [Google Scholar]
- 73.Schwanbeck R, Xiao H, Wu C. Spatial contacts and nucleosome step movements induced by the NURF chromatin remodeling complex. J Biol Chem. 2004;279:39933–39941. doi: 10.1074/jbc.M406060200. [DOI] [PubMed] [Google Scholar]
- 74.Chen L, et al. Subunit organization of the human INO80 chromatin remodeling complex: An evolutionarily conserved core complex catalyzes ATP-dependent nucleosome remodeling. J Biol Chem. 2011;286:11283–11289. doi: 10.1074/jbc.M111.222505. [DOI] [PMC free article] [PubMed] [Google Scholar]
- 75.Olson WK, Gorin AA, Lu XJ, Hock LM, Zhurkin VB. DNA sequence-dependent deformability deduced from protein-DNA crystal complexes. Proc Natl Acad Sci USA. 1998;95:11163–11168. doi: 10.1073/pnas.95.19.11163. [DOI] [PMC free article] [PubMed] [Google Scholar]
- 76.Hansen JC, Ausio J, Stanik VH, van Holde KE. Homogeneous reconstituted oligonucleosomes, evidence for salt-dependent folding in the absence of histone H1. Biochemistry. 1989;28:9129–9136. doi: 10.1021/bi00449a026. [DOI] [PubMed] [Google Scholar]
- 77.Vasudevan D, Chua EY, Davey CA. Crystal structures of nucleosome core particles containing the “601” strong positioning sequence. J Mol Biol. 2010;403:1–10. doi: 10.1016/j.jmb.2010.08.039. [DOI] [PubMed] [Google Scholar]
