

Abstract
Objective
We examined the distribution of diabetes and modifiable risk factors to provide data to aid diabetes prevention programmes in India.
Design
Population-based cross-sectional survey of men and women included in India's third National Family Health Survey (NFHS-3, 2005–2006).
Setting
The sample is a multistage cluster sample with an overall response rate of 98 %. All states of India are represented in the sample (except the small Union Territories), covering more than 99 % of the country's population.
Subjects
Women (n 99 574) and men (n 56 742) aged 20–49 years residing in the sample households.
Results
Prevalence of diabetes was 1598/100 000 (95 % CI 1462, 1735) among men and 1054/100 000 (95 % CI 974, 1134) among women in India. Rural–urban and marked geographic variation were found with higher rates in south and north-eastern India. Weekly and daily fish intake contributed to a significantly higher risk of diabetes among both women and men. Risks of diabetes increased with increased BMI, age and wealth status of both women and men, but no effects of the consumption of milk/curd, vegetables, eggs, television watching, alcohol consumption or smoking were found. Daily consumption of pulse/beans or fruits was associated with a significantly reduced risk of diabetes among women, whereas non-significant inverse associations were observed in the case of men.
Conclusions
Prevalence was underestimated using self-reports. The wide variation in self-reported diabetes is unlikely to be due entirely to reporting biases or access to health care, and indicates that modifiable risk factors exist. Prevention of diabetes should focus on obesity and target specific socio-economic groups in India.
Keywords: Diabetes, Men, Women, India
Type 2 diabetes has become a major health challenge worldwide(1). In 2000, there were an estimated 175 million people with diabetes worldwide and by 2030 the projected estimate of diabetes is 354 million(2,3). The greatest relative rise is predicted in the developing countries of the Middle Eastern Crescent, Sub-Saharan Africa and the Indian subcontinent. By the year 2030, over 85 % of the world's diabetic patients will live in developing countries, reflecting their greater populations(3). India, the world's second most populous country, now has more people with type 2 diabetes (more than 50 million) than any other nation4 and the prevalence is expected to increase to 79·4 million in 2030(3). The prevalence of diabetes in Asian Indians ranges from 2·7 % in rural India to 14·0 % in urban India(5–10) and is higher in migrant Asian Indian people compared with other ethnic groups(11–13). In India, prevalence appears to be increasing in both urban(14–17) and rural areas(6,18,19). Specific data available only for urban areas showed higher prevalence in south than in north India(9). The increasing health challenge of diabetes in Asia as well as India has been well established in a series of recent studies(4,5,20–24).
The increase in diabetes in developing countries has been attributed to increased consumption of saturated fats and sugars and increased sedentary behaviour associated with urbanization and Westernization(23,25–27), underpinned by parallel increases in obesity(28–30). Obesity and weight gain significantly increase the risk of diabetes(31,32), and physical inactivity further elevates the risk, independently of obesity(33–36). Several lifestyle factors also affect the incidence of type 2 diabetes(37). Cigarette smoking is associated with a small increase(38,39) and moderate alcohol consumption with a decrease in the risk of diabetes(40,41). In addition, high consumption of eggs(42), chicken or meat(43–46) and fish(47) has been associated with an increased risk of diabetes whereas a low-fibre diet with high intake of vegetables and fruits(48,49) and legumes(50,51) is associated with a decrease in diabetes risk. In most of the studies, dietary and lifestyle factors have been considered individually, although behavioural factors are typically correlated with one another. In the present study we aimed to describe the geographic variation in prevalence of diabetes among a representative national sample of Indian women and men, contrasting rural and urban rates, and to examine the effect of modifiable risk factors including dietary and lifestyle factors on diabetes prevalence.
Methods
Data from India's third National Family Health Survey (NFHS-3, 2005–2006) were used. Briefly, this survey was designed on the lines of the Demographic and Health Surveys (www.measuredhs.com) that have been conducted in many developing countries since the 1980s. The NFHS has been conducted in India for successive three rounds, each at an interval of 5 years. The third round of the NFHS (i.e. NFHS-3) collected demographic, socio-economic and health information from a nationally representative probability sample of 124 385 women aged 15–49 years and 74 369 men aged 15–54 years residing in 109 041 households. The sample is a multistage cluster sample with an overall response rate of 98 %. All states of India are represented in the sample (except the small Union Territories), covering more than 99 % of the country's population. Full details have been published(52). The analysis in the present study focuses on 99 574 women and 56 742 men aged 20–49 years living in the sample households.
Response variable
The survey asked several questions relating to specific health problems of the individual, including whether the respondent currently has diabetes. The question was: ‘Do you currently have diabetes?’ The survey was conducted using an interviewer-administered questionnaire in the native language of the respondent using a local, commonly understood term for diabetes. A total of eighteen languages were used in the survey with back translation into English to ensure accuracy and comparability. It is important to recognize that reported diabetes is not as accurate as clinical measures of diabetes. No physician diagnosis of diabetes could be obtained to verify self-reports and it was not possible to take fasting blood glucose to establish a diagnosis. In our analysis, this reported prevalence of diabetes is the response variable.
Predictor variables
The survey collected information on demographic, socio-economic factors and food habits. Consumption of selected foods was assessed by asking ‘How often do you yourself consume the following items: daily, weekly, occasionally or never?’ related to milk or curd, pulses or beans, green leafy vegetables, other vegetables, fruits, eggs, and chicken, meat or fish. Frequency of watching television (almost every day, at least once weekly, less than once weekly, not at all) was used as a measure of sedentary behaviour. Use of tobacco was measured as never smoker and ever smoker. Use of alcohol was quantified as drinks almost every day, about once weekly, less than once weekly and never.
Participants were weighed using a solar-powered scale with an accuracy of ±100 g. Height was measured using an adjustable wooden measuring board, specifically designed to provide accurate measurements (to the nearest 0·1 cm) in a developing-country field situation. The weight and height data were used to calculate BMI. Women who were pregnant at the time of the survey or women who had given birth during the two months preceding the survey were excluded from these measurements. Thresholds for BMI were defined as <18·5 kg/m2 (underweight), 18·5 to 24·9 kg/m2 (normal weight), 25·0 to 29·9 kg/m2 (overweight) and ≥30·0 kg/m2 (obese).
Because the effects of the risk factors on the prevalence of diabetes are likely to be confounded with the effects of other risk factors, it is necessary to statistically control or adjust for such factors. Control variables included in the present study were age, education, wealth status of the household and place of residence. Age was divided into three categories as 20–29 years, 30–39 years and 40–49 years. Education was classified as no education, primary (5–7 years completed), secondary (8–9 years) or higher (10+ years). Wealth index (based on thirty-three assets and housing characteristics and graded as lowest, second, middle, fourth and highest) was computed using previously described methods (see Appendix). Place of residence was defined as urban or rural.
Statistical analysis
Descriptive statistics were calculated with the use of standard methods. Prevalence of diabetes was computed as the number of diabetes cases per 100 000 persons. Trend tests were also carried out scoring the variables in different categories by using likelihood ratio tests. Because our response variable – prevalence of diabetes – is dichotomous, we used logistic regression to estimate the odds ratios of the risk factors for diabetes after controlling for socio-economic and demographic factors and examining for the independent effects of risk factors. As certain states and certain categories of respondents were oversampled, in all analyses sample weights were used to restore the representativeness of the sample.
Results are presented in the form of odds ratios with 95 % confidence intervals. The estimation of confidence intervals takes into account the design effects due to clustering at the level of the primary sampling unit. Before carrying out the multivariate models, we tested for the possibility of multicollinearity between the predictor variables. In the correlation matrix of predictor variables, all pairwise Pearson correlation coefficients were <0·5, suggesting that multicollinearity is not a problem. All analyses including the logistic regression models were conducted using the STATA 10 statistical software package (StataCorp., College Station, TX, USA)(53).
Human subjects’ informed consent
The analysis presented herein is based on secondary analysis of existing survey data, with all identifying information removed. The survey obtained informed consent from each respondent before asking questions.
Results
Prevalence of diabetes by state and residence
Table 1 shows diabetes prevalence among men and women by state and residence. Prevalence of diabetes was 1054/100 000 (95 % CI 974, 1134) among women and 1598/100 000 (95 % CI 1462, 1735) among men in India. Overall the prevalence rates were higher in men but inconsistent patterns were seen in different states.
Table 1.
Prevalence of diabetes (per 100 000 persons with 95 % CI) among women (n 99 574) and men (n 56 742) aged 20–49 years by Indian state and residence, 2005–2006
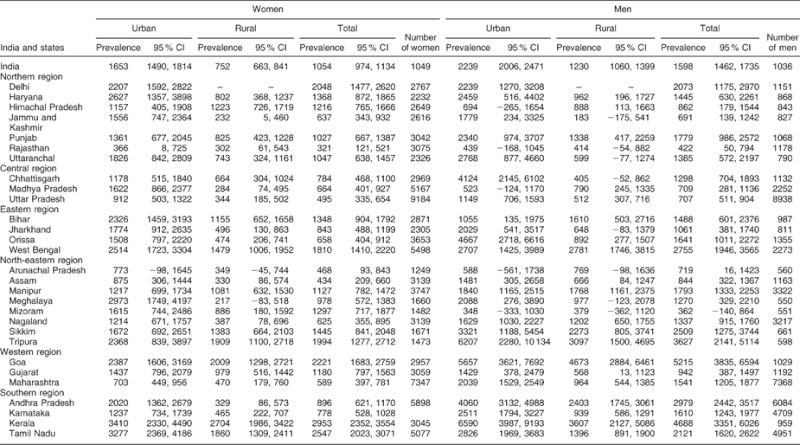
Marked geographic variation and rural urban differences in prevalence were observed. Goa had the highest overall diabetes prevalence among men (5215/100 000; 95 % CI 3835, 6594) while Kerala has highest overall diabetes prevalence among women (2953/100 000; 95 % CI 2352, 3554). Rajasthan, Uttar Pradesh, Assam and Arunachal Pradesh all had diabetes prevalence levels below 500/100 000 among women while only Rajasthan and Mizoram had a diabetes prevalence level below 500/100 000 among men.
Overall there was a large urban–rural variation of diabetes in India. Comparisons between states showed that most had higher diabetes rates in urban compared with rural areas, with similar urban-to-rural ratios in men and women. Prevalence ratios showed a marked variation and were as high as sixteen-fold (women, Meghalaya, north-eastern region) but several states showed no marked urban–rural differences in men or women (Rajasthan, Himachal Pradesh, Manipur, Sikkim, Goa).
Risk factors for diabetes
Table 2 shows the percentage distribution of women and men by diabetes status and Table 3 shows the prevalence rates per 100 000 persons by risk factors and sociodemographic characteristics for women and men. Diabetes was more common among both women and men who consumed milk or curd, eggs, fish, chicken or meat daily, who were either overweight or obese, who watched television almost every day, and in those who were the oldest age group, lived in urban areas and in wealthier households (all P < 0·0001). No differences in prevalence were seen for vegetable and fruit consumption or smoking tobacco. Strong associations between age and diabetes prevalence were observed. No clear pattern of prevalence by education was seen. Diabetes prevalence increased according to the wealth of the household and was almost double in urban women and men compared with their rural counterparts.
Table 2.
Distribution of women (n 99 574) and men (n 56 742) aged 20–49 years according to diabetes status by risk factors and background characteristics, India, 2005–2006
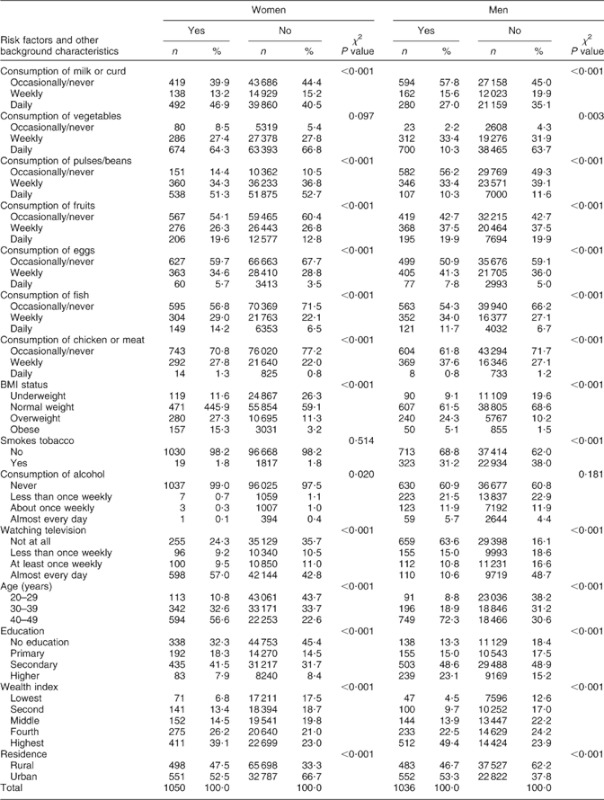
Table 3.
Prevalence of diabetes (per 100 000 persons) with 95 % CI among women (n 99 574) and men (n 56 742) aged 20–49 years by risk factors and background characteristics, India, 2005–2006
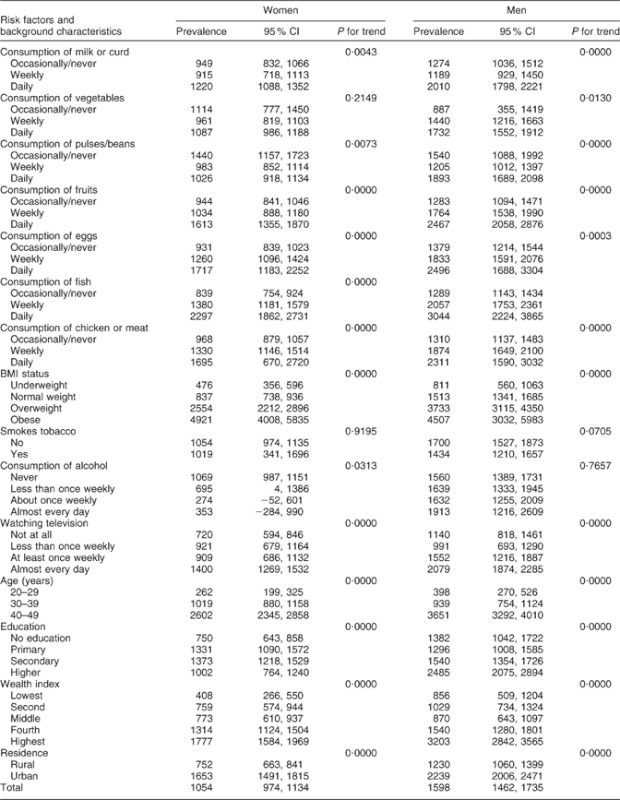
Table 4 presents unadjusted and adjusted logistic regression results showing the effect of modifiable risk factors and socio-economic and demographic characteristics on diabetes among women and men in separate models. Model I presents unadjusted results, Model II presents results independently for the risk factors adjusted for sociodemographic factors which may be confounders and Model III presents results adjusted for both risk factors and confounders.
Table 4.
Unadjusted and adjusted effects of risk factors and socio-economic and demographic characteristics on diabetes from logistic regression analysis among women (n 99 574) and men (n 56 742), India, 2005–2006 (dependent variable: diabetes; yes = 1, no = 0)
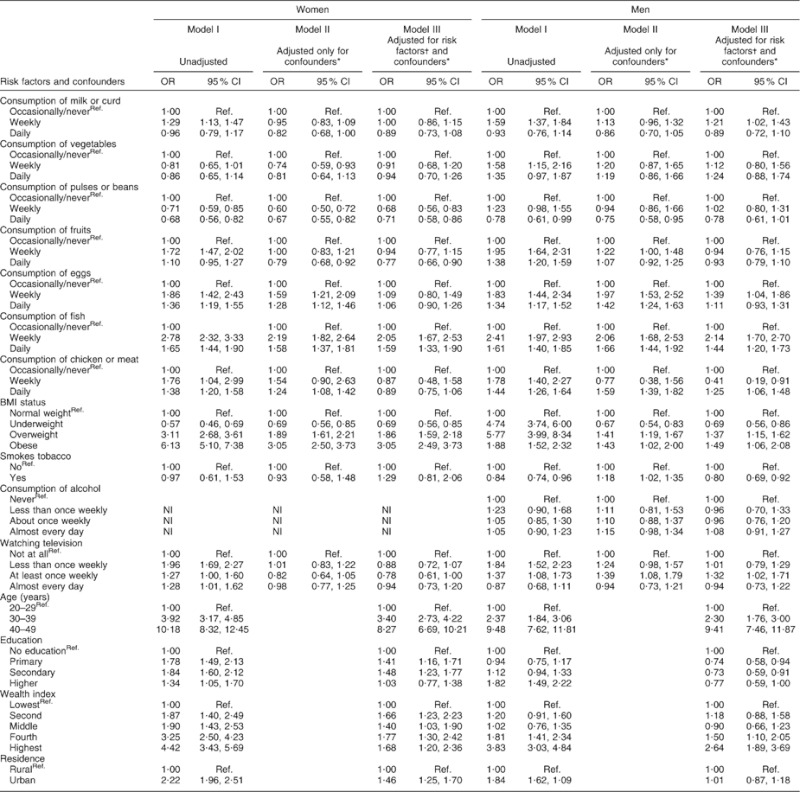
Ref., reference category; NI, not included.
*Confounders are age, residence, education and wealth index.
†Risk factors are consumption of milk/curd, consumption of vegetables/fruits, consumption of pulses/beans, consumption of fish, consumption of eggs/meat/chicken, BMI status, smokes tobacco, consumption of alcohol and watching television.
Unadjusted results show that the risk of diabetes was 1·3 times higher (OR = 1·29; 95 % CI 1·13, 1·47) among women and 1·6 times higher among men (OR = 1·59; 95 % CI 1·37, 1·84) who consumed milk or curd weekly compared with those who consumed them occasionally/never. However, this effect disappeared in women and was markedly attenuated in men (OR = 1·21; 95 % CI 1·02, 1·43) after controlling for the potential confounders. Daily intake of fish was associated with 1·6 times higher risk of diabetes among women (OR = 1·59; 95 % CI 1·33, 1·90) and 1·4 times higher risk among men (OR = 1·44; 95 % CI 1·20, 1·73) as compared with occasional/never consumers. Weekly fish intake also contributed to a higher risk of diabetes both among women (OR = 2·05; 95 % CI 1·67, 2·53; P < 0·0 0 1) and men (OR = 2·14; 95 % CI 1·70, 2·70) even after controlling the effects of potential confounders. Daily chicken/meat consumption was found to be associated with higher diabetes risk among men (OR = 1·25; 95 % CI 1·06, 1·48) but not among women. The odds of diabetes were higher for both women and men who consumed eggs daily or weekly in the crude analyses but in adjusted models these effects disappeared.
Daily consumption of pulse/beans (OR = 0·71; 95 % CI 0·58, 0·86) and fruits (OR = 0·77; 95 % CI 0·66, 0·90) was associated with a significantly reduced risk of diabetes among women whereas non-significant inverse associations were also observed in the case of men. No effect of daily vegetable consumption on diabetes was found either in women or men in both crude and adjusted analyses.
Considering BMI status, the crude odds were more than six times higher among obese women and almost two times higher in obese men; the effect remained strong but was partly attenuated in the fully adjusted model. Diabetes was three times higher among obese women (OR = 3·05; 95 % CI 2·49, 3·73) and 1·5 times higher among obese men (OR = 1·49; 95 % CI 1·06, 2·08) in the adjusted analysis. The unadjusted odds of diabetes were higher among those who watched television almost every day for both women and women but in adjusted models these effects disappeared. However, no effects of alcohol consumption or smoking on diabetes were found in the adjusted analyses.
Age was the strongest risk factor for diabetes in these data. The odds of suffering from diabetes were 8·3 times higher (OR = 8·27; 95 % CI 6·69, 10·21) among women and 9·4 times higher (OR = 9·41; 95 % CI 7·46, 11·87) among men aged more than 40 years. Women with primary or secondary education had greater odds of diabetes in crude analyses which remained strong in the adjusted analysis. Men with higher education had greater unadjusted odds of diabetes but this effect was attenuated to null after full adjustment. By contrast, the wealth index remained significantly associated with increased risk of diabetes even after full adjustment.
Discussion
There is marked country-wide variation in diabetes prevalence in India. Urban rates tend to be highest in the southern region but high urban rates are found in most regions. Consumption of fish, chicken or meat was associated with higher risk of diabetes and consumption of pulses/ beans and fruit was associated with a lower risk of diabetes. Overweight and obesity were also associated with a significantly higher risk of diabetes but watching television was not. Higher wealth was associated with increased risk of diabetes but educational attainment was not. No strong evidence for associations of diabetes risk with daily milk/curd consumption, vegetable consumption, smoking tobacco or alcohol was found. Findings were broadly similar for men and women.
The prevalence of self-reported diabetes in this large nationally representative survey was comparatively low (about 1 %) reflecting the young age of this population and the use of self-reports rather than biochemical assessments. Estimates from a recent study of rural–urban migrants showed an age-adjusted prevalence of diabetes (diagnosed using both self-reports and fasting blood glucose in relatively affluent populations) of 10–15 % in urban people and 5–6 % in rural people of similar age to those recruited in NFHS-3(54). In most urban parts of India the health system is well enough developed for diagnosis of symptomatic diabetes, but at younger ages (<30 years) diabetes may not be symptomatic and NFHS-3 prevalence estimates are undoubtedly conservative, particularly for rural India where diagnosis may be much less likely to occur.
The geographic variation in diabetes prevalence indicates that within most regions of India, some states stand out as ‘hot spots’ reflecting variation between states in their epidemiological transition. Economically more prosperous states (e.g. Goa, Kerala) would be expected to have higher rates of diabetes compared with poorer states (e.g. Rajasthan) which may be mediated by more calorific diets and lower levels of physical activity.
We did not find that daily milk consumption was protective for diabetes in India although there was evidence that weekly milk consumption might be harmful among men (analysis not shown). Previous studies have shown higher dairy intake may lower the risk of type 2 diabetes, but these studies were conducted in developed countries(55–58) with the exception of a recent study of middle-aged Chinese women(59). Our negative finding in India, which has a very different confounding structure to that in Western countries, suggests that the protective effect of milk consumption may be due to residual or uncontrolled confounding in Western studies. It is also possible that reverse causation arises, resulting in people with diabetes taking milk daily as they believe it is protective. The Diabetes India website (www.diabetesindia.com) does recommend up to 1 litre of milk daily as part of a diabetic diet. Confirmation of our findings in other Indian studies would be helpful in determining whether such advice should be withdrawn.
Our finding of daily and weekly fish consumption increasing the risk of diabetes was robust, suggesting that a non-vegetarian diet is harmful. It is supported by recent findings showing similar effects, that regular eating of red meat is associated with increased propensity to gain weight which may be the important factor in determining risk(42,43,60–62,). However, this finding warrants further investigation looking into the cooking methods and mechanisms, which vary throughout the country. In India, fish are eaten dried, fried or fried-cooked with heavy spices and oil. This method of preparation of fish may not be beneficial for diabetes, which our finding shows. The coastal states of India such as Maharashtra, Goa, Karnataka, Kerala, Tamil Nadu, Andhra Pradesh, Orissa and West Bengal are the states where lots of sea fish are eaten along with freshwater fish. Incidentally, those are also the states where diabetes prevalence is higher among men and in urban areas.
However, results of studies that investigated the association between fish intake and type 2 diabetes risk are inconclusive. In contrast with our findings, two earlier cohort studies in the West showed protective effects of fish intake(63,64). An ecological study reported that high fish intake may reduce the risk of type 2 diabetes in populations with a high prevalence of obesity(65). Cross-sectional studies reported inverse(66,67), no(68,69) or positive(70,71) associations between habitual fish intake and diabetes status. Prospective evidence suggested that fish intake is inversely(63,64,72) or not associated(73) or positively associated(74) with the risk of type 2 diabetes. However, studies conducted in this field did not report associations between different types of fish, process of cooking the fish and type 2 diabetes risk.
In the present study, a significant inverse association was found between intakes of pulses/beans and fruit and diabetes among Indian women but among men no effect was found. Various studies in the West have also shown benefits from a vegetarian diet in prevention of diabetes(59,61). There is also convincing evidence that consumption of fruits and vegetables decrease the risks of obesity and diabetes(74). In spite of the growing body of evidence which highlights the protective effect of fruits and vegetables, their intakes are still inadequate in many low- and middle-income countries(75,76). The World Health Survey in 2002–2003 showed that over three-quarters of men and women from fifty-two low- and middle-income countries consumed less than the minimum recommended five daily servings of fruits and vegetables(75). The fruit and vegetable intake among the population in India is about 100 g/capita per d or less(77) compared with 300 g consumed in Australia, several European countries and the USA. Even so, the fruit and vegetable consumption in these high-income countries is still less than the WHO/FAO recommended level of 400 g or five servings daily(78).
We did not find strong evidence of any effect of alcohol or smoking tobacco on type 2 diabetes which has been found in previous developed-country studies(79–82). This may reflect the cross-sectional nature of our data which cannot assess directionality of relationships. Also it might be possible that there is reverse causality and people are engaging in health-protective behaviours in the knowledge of a diagnosis of diabetes.
Current public health campaigns in developing as well as developed countries to reduce obesity and type 2 diabetes have largely focused on increasing exercise, but have paid little attention to the reduction of sedentary behaviours. Several studies have emphasized the importance of reducing prolonged television watching and other sedentary behaviours for preventing obesity and diabetes(26,83,84). However, in India, the specific role of television in diabetes risk has yet not been quantified(4). In our data, adjustment of confounders and other risk factors removed any effect of television watching on diabetes. It is possible that levels of television viewing are too low to be a good marker of sedentary behaviour in the Indian context or that uncontrolled confounders explain the Western findings.
The socio-economic associations with diabetes might be expected to be mediated through obesity but adjustment for BMI did not attenuate the association with diabetes whereas the more modest association with higher educational attainment was fully attenuated in adjusted models. The differential effects of wealth and education suggest that the effect is not simply due to better access to health care resulting in greater likelihood of getting a diagnosis of diabetes. Recent studies have shown complex patterns of association between socio-economic position and development of diabetes, with protective effects of income among whites but not blacks and protective effects of education among blacks but not whites in the USA(85). By contrast findings in developing countries tend to show the opposite effects, which relates to the patterning of risk factors with economic and social transitions. In Indian factory workers, representing the emerging urban elites in the vanguard of social transition, higher educational attainment is associated with lower risk of diabetes and other CVD risk factors(86). In the UK there is evidence that markers of socio-economic position operate in different directions in South Asian groups compared with white groups depending on the health outcome and the marker used(87).
Strengths and limitations of the study
The strengths of our study include the large nationally representative study sample allowing comparisons to be made between states and urban v. rural settings and the ability to examine socio-economic and lifestyle patterning of diabetes risk. The major weaknesses of the study are the collection of only self-reported diabetes, which has resulted in a marked underestimation of prevalence, and its focus on people aged <60 years in whom diabetes is less common. Self- reported data, especially in rural areas, can be flawed owing to several factors such as lack of awareness, low educational status and hesitation to disclose diseases. Despite these shortcomings rigorous precautions were taken in the NFHS to obtain reliable self-reported data such as the survey used the local terminology and commonly understood term of the disease, rigorously trained interviewers and supervisors and standard quality checks. However, underestimation of diabetes may be less problematic in examining associations with risk factors. Moreover, we were unable to distinguish between type 1 and 2 diabetes diagnoses. In these analyses, the cross-sectional design precludes causal inferences and we were limited to the questions used to elicit lifestyle and dietary information. In future national family household surveys, it would be very valuable to make biochemical estimates of raised blood glucose using near-patient testing devices which would provide a much more accurate means of mapping trends in diabetes rates.
Conclusions
The prevalence of diabetes was underestimated using self-reports. The wide variation in self-reported diabetes is unlikely to be due entirely to reporting biases or access to health care, and indicates that modifiable risk factors exist. Confirming our negative findings on milk consumption, alcohol and smoking and our positive findings on animal products in Indian studies with better ascertainment of diabetes would be helpful. Prevention of diabetes should focus on lifestyle aspects of obesity and target specific socio-economic groups in India.
Acknowledgements
This research received no specific grant from any funding agency in the public, commercial or not-for-profit sectors. All authors declared that they do not have any conflict of interest. S.A. conceived and designed the study, analysed and interpreted the data, and drafted and wrote the manuscript; S.E. helped in the analysis of result and interpretation of the data; both authors are responsible for final editing and approval of the manuscript.
Appendix.
Items comprising the wealth index in the third National Family Health Survey
Household electrification; type of windows; drinking water source; type of toilet facility; type of flooring; material of exterior walls; type of roofing; cooking fuel; house ownership; number of household members per sleeping room; ownership of a bank or post-office account; and ownership of a mattress, a pressure cooker, a chair, a cot/bed, a table, an electric fan, a radio/transistor, a black and white television, a colour television, a sewing machine, a mobile telephone, any other telephone, a computer, a refrigerator, a watch or clock, a bicycle, a motorcycle or scooter, an animal-drawn cart, a car, a water pump, a thresher and a tractor.
References
- 1.King H, Aubert RE. Herman WH. Global burden of diabetes, 1995–2025: prevalence, numerical estimates, and projections. Diabetes Care. 1998;21:1414–1431. doi: 10.2337/diacare.21.9.1414. & . ( [DOI] [PubMed] [Google Scholar]
- 2.Shaw JE, Sicree RA. Zimmet PZ. Global estimates of the prevalence of diabetes for 2010 and 2030. Diabetes Res Clin Pract. 2010;87:4–14. doi: 10.1016/j.diabres.2009.10.007. & . ( [DOI] [PubMed] [Google Scholar]
- 3.Wild S, Roglic G, Green A. et al. Global prevalence of diabetes: estimates for the year 2000 and projections for 2030. Diabetes Care. 2004;27:1047–1053. doi: 10.2337/diacare.27.5.1047. ( [DOI] [PubMed] [Google Scholar]
- 4.Diamond JED. Diabetes in India. Nature. 2011;469:479. doi: 10.1038/469478a. ( [DOI] [PubMed] [Google Scholar]
- 5.Ramachandran A. Snehalatha C. Current scenario of diabetes in India. J Diabetes. 2009;1:18–28. doi: 10.1111/j.1753-0407.2008.00004.x. & . ( [DOI] [PubMed] [Google Scholar]
- 6.Tiwari RR, Deb PK, Debbarma A. et al. Risk factor analysis in self-reported diabetes in a rural Kerala population. Int J Diabetes Dev Ctries. 2008;28:91–94. doi: 10.4103/0973-3930.44080. ( [DOI] [PMC free article] [PubMed] [Google Scholar]
- 7.Mohan V, Shantirani CS. Deepa R. Glucose intolerance (diabetes and IGT) in a selected South Indian population with special reference to family history, obesity and lifestyle factors – The Chennai Urban Population Study (CUPS 14) J Assoc Physicians India. 2003;51:771–777. & . ( [PubMed] [Google Scholar]
- 8.Ramachandran A, Snehalatha C, Kapur A. et al. Diabetes Epidemiology Study Group in India (DESI): high prevalence of diabetes and impaired glucose tolerance in India: national urban diabetes survey. Diabetologia. 2001;44:1094–1101. doi: 10.1007/s001250100627. ( [DOI] [PubMed] [Google Scholar]
- 9.Asha Bai PV, Krishnaswami CV. Chellamariappan M. Prevalence and incidence of type-2 diabetes and impaired glucose tolerance in a selected Indian urban population. J Assoc Physicians India. 1999;47:1060–1064. & . ( [PubMed] [Google Scholar]
- 10.Ramachandran A, Jali MV, Mohan V. et al. High prevalence of diabetes in an urban population in South India. BMJ. 1986;297:587–590. doi: 10.1136/bmj.297.6648.587. ( [DOI] [PMC free article] [PubMed] [Google Scholar]
- 11.Simmons D. Ethnic comparisons in diabetes and insulin levels. Asia Pac J Clin Nutr. 1995;4:346–348. ( [PubMed] [Google Scholar]
- 12.Knight TM, Smith Z, Whittles A. et al. Insulin resistance, diabetes and risk markers for ischaemic heart disease in Asian men and non-Asian men in Bradford. Br Heart J. 1992;67:343–350. doi: 10.1136/hrt.67.5.343. ( [DOI] [PMC free article] [PubMed] [Google Scholar]
- 13.Ramaiya K, Kodali VRR. Alberti KGMM. Epidemiology of diabetes in Asians of the Indian subcontinent. Diabetes Metab Rev. 1990;6:125–146. doi: 10.1002/dmr.5610060302. & . ( [DOI] [PubMed] [Google Scholar]
- 14.Gupta R. Misra A. Type 2 diabetes in India: regional disparities. Br J Diabetes Vasc Dis. 2007;7:12–16. & . ( [Google Scholar]
- 15.Mohan V, Deepa M, Deepa R. et al. Secular trends in the prevalence of diabetes and glucose tolerance in urban South India – the Chennai Urban Rural Epidemiology Study (CURES-17) Diabetologia. 2006;49:1175–1178. doi: 10.1007/s00125-006-0219-2. ( [DOI] [PubMed] [Google Scholar]
- 16.Misra A, Pandey RM, Devi JR. et al. High prevalence of diabetes, obesity and dyslipidaemia in urban slum population in northern India. Int J Obes Relat Metab Disord. 2001;25:1722–1729. doi: 10.1038/sj.ijo.0801748. ( [DOI] [PubMed] [Google Scholar]
- 17.Ramachandran A, Snehalatha C, Latha E. et al. Rising prevalence of NIDDM in an urban population in India. Diabetologia. 1997;40:232–237. doi: 10.1007/s001250050668. ( [DOI] [PubMed] [Google Scholar]
- 18.Vijayakumar G, Arun R. Kutty VR. High prevalence of type 2 diabetes mellitus and other metabolic disorders in rural central Kerala. J Assoc Physicians India. 2009;57:563–567. & . ( [PubMed] [Google Scholar]
- 19.Ramachandran A, Snehalatha C. Vijay V. Low risk threshold for acquired diabetogenic factors in Asian Indians. Diabetes Res Clin Pract. 2004;65:185–195. doi: 10.1016/j.diabres.2004.03.012. & . ( [DOI] [PubMed] [Google Scholar]
- 20.Mohan V, Radhika G, Vijayalakshmi P. et al. Can the diabetes/cardiovascular disease epidemic in India be explained, at least in part, by excess refined grain (rice) intake? Indian J Med Res. 2010;131:369–372. ( [PubMed] [Google Scholar]
- 21.Pradeepa R, Anjana RM, Unnikrishnan R. et al. Risk factors for microvascular complications of diabetes among south Indian subjects with type 2 diabetes – the Chennai Urban Rural Epidemiology Study (CURES) Eye Study-5. Diabetes Technol Ther. 2010;12:755–761. doi: 10.1089/dia.2010.0069. ( [DOI] [PubMed] [Google Scholar]
- 22.Ramachandran A, Ma RCW. Snehalatha C. Diabetes in Asia. Lancet. 2010;375:408–418. doi: 10.1016/S0140-6736(09)60937-5. & . ( [DOI] [PubMed] [Google Scholar]
- 23.Chan JCN, Malik V, Jia W. et al. Diabetes in Asia: epidemiology, risk factors, and pathophysiology. JAMA. 2009;301:2129–2140. doi: 10.1001/jama.2009.726. ( [DOI] [PubMed] [Google Scholar]
- 24.Mehta SR, Kashyap AS. Das S. Diabetes mellitus in India: the modern scourge. MJAFI. 2009;65:50–54. doi: 10.1016/S0377-1237(09)80056-7. & . ( [DOI] [PMC free article] [PubMed] [Google Scholar]
- 25.Fall CH. The genesis of ‘Fetal origins of adult disease’. Int J Diabetes Dev Ctries. 2001;21:3–8. ( [Google Scholar]
- 26.Hu FB, Leitzmann MF, Stampfer MJ. et al. Physical activity and television watching in relation to risk for type 2 diabetes mellitus in men. Arch Intern Med. 2001;161:1542–1548. doi: 10.1001/archinte.161.12.1542. ( [DOI] [PubMed] [Google Scholar]
- 27.Gopalan C. Nutrition in developmental transition in South-East Asia WHO/SEARO, New Delhi. Asia Pac J Clin Nutr. 1992;1:191. ( [Google Scholar]
- 28.Popkin BM, Horton S, Kim S. et al. Trends in diet, nutritional status, and diet-related non-communicable diseases in China and India: the economic costs of the nutrition transition. Nutr Rev. 2001;59:379–390. doi: 10.1111/j.1753-4887.2001.tb06967.x. ( [DOI] [PubMed] [Google Scholar]
- 29.Zimmet P, de Courten M, Allison M, Epidemiology, Evidence for Prevention of Type 2 Diabetes. The Epidemiology of Diabetes Mellitus: An International Perspective. Chichester: John Wiley & Sons Ltd; 2001. pp. 42–49. (editors) ( [Google Scholar]
- 30.World Health Organization. Obesity: Preventing and Managing the Global Epidemic. WHO Technical Report Series. Geneva: WHO; 2000. ( no. 894. [PubMed] [Google Scholar]
- 31.Colditz GA, Willett WC, Rotnitzky A. et al. Weight gain as a risk factor for clinical diabetes mellitus in women. Ann Intern Med. 1995;122:481–486. doi: 10.7326/0003-4819-122-7-199504010-00001. ( [DOI] [PubMed] [Google Scholar]
- 32.Colditz GA, Willett WC, Stampfer MJ. et al. Weight as a risk factor for clinical diabetes in women. Am J Epidemiol. 1990;132:501–513. doi: 10.1093/oxfordjournals.aje.a115686. ( [DOI] [PubMed] [Google Scholar]
- 33.Hu FB, Sigal RJ, Rich-Edwards JW. et al. Walking compared with vigorous physical activity and risk of type 2 diabetes in women: a prospective study. JAMA. 1999;282:1433–1439. doi: 10.1001/jama.282.15.1433. ( [DOI] [PubMed] [Google Scholar]
- 34.Lynch J, Helmrich SP, Lakka TA. et al. Moderately intense physical activities and high levels of cardiorespiratory fitness reduce risk of non-insulin-dependent diabetes mellitus in middle-aged men. Arch Intern Med. 1996;156:1307–1314. ( [PubMed] [Google Scholar]
- 35.Helmrich SP, Ragland DR, Leung RW. et al. Physical activity and reduced occurrence of non-insulin-dependent diabetes mellitus. N Engl J Med. 1991;325:147–152. doi: 10.1056/NEJM199107183250302. ( [DOI] [PubMed] [Google Scholar]
- 36.Manson JE, Rimm EB, Stampfer MJ. et al. Physical activity and incidence of non-insulin-dependent diabetes mellitus in women. Lancet. 1991;338:774–778. doi: 10.1016/0140-6736(91)90664-b. ( [DOI] [PubMed] [Google Scholar]
- 37.Hu FB, Manson JE. Stampfer MJ. Diet, lifestyle, and the risk of type 2 diabetes mellitus in women. N Engl J Med. 2001;345:790–797. doi: 10.1056/NEJMoa010492. & . ( [DOI] [PubMed] [Google Scholar]
- 38.Manson JE, Ajani UA, Liu S. et al. A prospective study of cigarette smoking and the incidence of diabetes mellitus among US male physicians. Am J Med. 2000;109:538–542. doi: 10.1016/s0002-9343(00)00568-4. ( [DOI] [PubMed] [Google Scholar]
- 39.Rimm EB, Chan J, Stampfer MJ. et al. Prospective study of cigarette smoking, alcohol use, and the risk of diabetes in men. BMJ. 1995;310:555–559. doi: 10.1136/bmj.310.6979.555. ( [DOI] [PMC free article] [PubMed] [Google Scholar]
- 40.Wei M, Gibbons LW, Mitchell TL. et al. Alcohol intake and incidence of type 2 diabetes in men. Diabetes Care. 2000;23:18–22. doi: 10.2337/diacare.23.1.18. ( [DOI] [PubMed] [Google Scholar]
- 41.Ajani UA, Hennekens CH, Spelsberg A. et al. Alcohol consumption and risk of type 2 diabetes mellitus among US male physicians. Arch Intern Med. 2000;160:1025–1030. doi: 10.1001/archinte.160.7.1025. ( [DOI] [PubMed] [Google Scholar]
- 42.Djoussé L, Gaziano JM, Buring JE. et al. Egg consumption and risk of type 2 diabetes in men and women. Diabetes Care. 2009;32:295–300. doi: 10.2337/dc08-1271. ( [DOI] [PMC free article] [PubMed] [Google Scholar]
- 43.Aune D, Ursin G. Veierød MB. Meat consumption and the risk of type 2 diabetes: a systematic review and meta-analysis of cohort studies. Diabetologia. 2009;52:2277–2287. doi: 10.1007/s00125-009-1481-x. & . ( [DOI] [PubMed] [Google Scholar]
- 44.Steinbrecher A, Erber E, Grandinetti A. et al. Meat consumption and risk of type 2 diabetes: the Multiethnic Cohort. Public Health Nutr. 2010;13:1–7. doi: 10.1017/S1368980010002004. ( [DOI] [PMC free article] [PubMed] [Google Scholar]
- 45.Fung TT, Schulze M, Manson JE. et al. Dietary patterns, meat intake, and the risk of type 2 diabetes in women. Arch Intern Med. 2004;164:2235–2240. doi: 10.1001/archinte.164.20.2235. ( [DOI] [PubMed] [Google Scholar]
- 46.van Dam RM, Willet WC, Rimm EB. et al. Dietary fat and meat intake in relation to risk of type 2 diabetes in men. Diabetes Care. 2002;25:417–424. doi: 10.2337/diacare.25.3.417. ( [DOI] [PubMed] [Google Scholar]
- 47.Woudenbergh GJV, Ballegooijen AJV, Kuijsten A. et al. Eating fish and risk of type 2 diabetes a population-based, prospective follow-up study. Diabetes Care. 2009;32:2021–2026. doi: 10.2337/dc09-1042. ( [DOI] [PMC free article] [PubMed] [Google Scholar]
- 48.Villegas R, Shu Xo, Gao YT. et al. Vegetable but not fruit consumption reduces the risk of type 2 diabetes in Chinese women. J Nutr. 2008;138:574–580. doi: 10.1093/jn/138.3.574. ( [DOI] [PMC free article] [PubMed] [Google Scholar]
- 49.Bazzano LA, Li TY, Joshipura KJ. et al. Intake of fruit, vegetables, and fruit juices and risk of diabetes in women. Diabetes Care. 2008;31:1311–1317. doi: 10.2337/dc08-0080. ( [DOI] [PMC free article] [PubMed] [Google Scholar]
- 50.Villegas R, Gao Y, Yang G. et al. Legume and soy food intake and the incidence of type 2 diabetes in the Shanghai Women's Health Study. Am J Clin Nutr. 2008;87:162–167. doi: 10.1093/ajcn/87.1.162. ( [DOI] [PMC free article] [PubMed] [Google Scholar]
- 51.Venn BJ. Mann JI. Cereal grains, legumes and diabetes. Eur J Clin Nutr. 2004;58:1443–1461. doi: 10.1038/sj.ejcn.1601995. & . ( [DOI] [PubMed] [Google Scholar]
- 52.International Institute for Population Sciences & Macro International. National Family Health Survey (NFHS-3), 2005–06: India: Vol. I. Mumbai: IIPS; 2007. ( [Google Scholar]
- 53.StataCorp. STATA Statistical Software Release 8. College Station, TX: StataCorp; 2003. p. 24. ( , p. [Google Scholar]
- 54.Ebrahim S, Kinra S, Bowen L. et al. The effect of rural to urban migration on obesity and diabetes in India: cross sectional study. PLoS Med. 2010;7:e10000268. doi: 10.1371/journal.pmed.1000268. ( [DOI] [PMC free article] [PubMed] [Google Scholar]
- 55.Elwood PC, Givens DI, Andrew D. et al. The survival advantage of milk and dairy consumption: an overview of evidence from cohort studies of vascular diseases, diabetes and cancer. J Am Coll Nutr. 2008;27(6):723S–734S. doi: 10.1080/07315724.2008.10719750. ( , issue . [DOI] [PubMed] [Google Scholar]
- 56.van Dam RM, Hu FB, Rosenberg L. et al. Dietary calcium and magnesium, major food sources, and risk of type 2 diabetes in US black women. Diabetes Care. 2006;29:2238–2243. doi: 10.2337/dc06-1014. ( [DOI] [PubMed] [Google Scholar]
- 57.Liu S, Choi HK, Ford E. et al. A prospective study of dairy intake and the risk of type 2 diabetes in women. Diabetes Care. 2006;29:1579–1584. doi: 10.2337/dc06-0256. ( [DOI] [PubMed] [Google Scholar]
- 58.Choi HK, Willett WC, Stampfer MJ. et al. Dairy consumption and risk of type 2 diabetes mellitus in men: a prospective study. Arch Intern Med. 2005;165:997–1003. doi: 10.1001/archinte.165.9.997. ( [DOI] [PubMed] [Google Scholar]
- 59.Villegas R, Gao YT, Dai Q. et al. Dietary calcium and magnesium intakes and the risk of type 2 diabetes: the Shanghai Women's Health Study. Am J Clin Nutr. 2009;89:1059–1067. doi: 10.3945/ajcn.2008.27182. ( [DOI] [PMC free article] [PubMed] [Google Scholar]
- 60.Vang A, Singh PN, Lee JW. et al. Meats, processed meats, obesity, weight gain and occurrence of diabetes among adults: findings from Adventist Health Studies. Ann Nutr Metab. 2008;52:96–104. doi: 10.1159/000121365. ( [DOI] [PubMed] [Google Scholar]
- 61.Snowdon DA. Phillips RL. Does a vegetarian diet reduce the occurrence of diabetes? Am J Public Health. 1985;75:507–512. doi: 10.2105/ajph.75.5.507. & . ( [DOI] [PMC free article] [PubMed] [Google Scholar]
- 62.Song Y, Manson JAE, Buring JE. et al. A prospective study of red meat consumption and type 2 diabetes in middle-aged and elderly women: the women's health study. Diabetes Care. 2004;27:2108–2115. doi: 10.2337/diacare.27.9.2108. ( [DOI] [PubMed] [Google Scholar]
- 63.Feskens EJ, Virtanen SM, Rasanen L. et al. Dietary factors determining diabetes and impaired glucose tolerance. A 20-year follow-up of the Finnish and Dutch cohorts of the Seven Countries Study. Diabetes Care. 1995;18:1104–1112. doi: 10.2337/diacare.18.8.1104. ( [DOI] [PubMed] [Google Scholar]
- 64.Feskens EJ, Bowles CH. Kromhout D. Inverse association between fish intake and risk of glucose intolerance in normoglycemic elderly men and women. Diabetes Care. 1991;14:935–941. doi: 10.2337/diacare.14.11.935. & . ( [DOI] [PubMed] [Google Scholar]
- 65.Nkondjock A. Receveur O. Fish-seafood consumption, obesity, and risk of type 2 diabetes: an ecological study. Diabetes Metab. 2003;29:635–642. doi: 10.1016/s1262-3636(07)70080-0. & . ( [DOI] [PubMed] [Google Scholar]
- 66.Panagiotakos DB, Zeimbekis A, Boutziouka V. et al. Long-term fish intake is associated with better lipid profile, arterial blood pressure, and blood glucose levels in elderly people from Mediterranean islands (MEDIS epidemiological study) Med Sci Monit. 2007;13:CR307–CR312. ( [PubMed] [Google Scholar]
- 67.Ruidavets JB, Bongard V, Dallongeville J. et al. High consumptions of grain, fish, dairy products and combinations of these are associated with a low prevalence of metabolic syndrome. J Epidemiol Community Health. 2007;61:810–817. doi: 10.1136/jech.2006.052126. ( [DOI] [PMC free article] [PubMed] [Google Scholar]
- 68.Adler AI, Boyko EJ, Schraer CD. et al. Lower prevalence of impaired glucose tolerance and diabetes associated with daily seal oil or salmon consumption among Alaska Natives. Diabetes Care. 1994;17:1498–1501. doi: 10.2337/diacare.17.12.1498. ( [DOI] [PubMed] [Google Scholar]
- 69.Harding AH, Day NE, Khaw KT. et al. Habitual fish consumption and glycated haemoglobin: the EPIC-Norfolk study. Eur J Clin Nutr. 2004;58:277–284. doi: 10.1038/sj.ejcn.1601779. ( [DOI] [PubMed] [Google Scholar]
- 70.Bjerregaard P, Pedersen HS. Mulvad G. The associations of a marine diet with plasma lipids, blood glucose, blood pressure and obesity among the Inuit in Greenland. Eur J Clin Nutr. 2000;54:732–737. doi: 10.1038/sj.ejcn.1601088. & . ( [DOI] [PubMed] [Google Scholar]
- 71.Kaushik M, Mozaffarian D, Spiegelman D. et al. Long-chain omega-3 fatty acids, fish intake, and the risk of type 2 diabetes mellitus. Am J Clin Nutr. 2009;90:613–620. doi: 10.3945/ajcn.2008.27424. ( [DOI] [PMC free article] [PubMed] [Google Scholar]
- 72.Patel PS, Sharp SJ, Robert N. et al. Association between type of dietary fish and seafood intake and the risk of incident type 2 diabetes: the European Prospective Investigation of Cancer (EPIC)-Norfolk cohort study. Diabetes Care. 2009;32:1857–1863. doi: 10.2337/dc09-0116. ( [DOI] [PMC free article] [PubMed] [Google Scholar]
- 73.Schulze MB, Manson JE, Willett WC. et al. Processed meat intake and incidence of type 2 diabetes in younger and middle aged women. Diabetologia. 2003;46:1465–1473. doi: 10.1007/s00125-003-1220-7. ( [DOI] [PubMed] [Google Scholar]
- 74.World Health Organization. Diet, Nutrition and the Prevalence of Chronic Diseases. WHO Technical Report Series. Geneva: WHO; 2003. ( no. 916. [Google Scholar]
- 75.Hall JN, Moore S, Harper SB. et al. Global variability in fruit and vegetable consumption. Am J Prev Med. 2009;36:402–409. doi: 10.1016/j.amepre.2009.01.029. ( [DOI] [PubMed] [Google Scholar]
- 76.International Agency for Research on Cancer. Changing Structure of Global Food Consumption and Trade: Agricultural and Trade Report. Lyon: IARC Press; 2001. ( [Google Scholar]
- 77.Kanungsukkasem U, Ng N, Minh HV. et al. Fruit and vegetable consumption in rural adults population in INDEPTH HDSS sites in Asia. Global Health Action Supplement 1 2009 doi: 10.3402/gha.v2i0.1988. ( [DOI] [PMC free article] [PubMed] [Google Scholar]
- 78.Pollack SL. Consumer Demand for Fruits and Vegetables: The US Example. Washington, DC: Economic Research Service, US Department of Agriculture; 2001. ( [Google Scholar]
- 79.Rehm J, Gmel G, Sempos CT. et al. Alcohol-related morbidity and mortality. Alcohol Res Health. 2003;27:39–51. ( [PMC free article] [PubMed] [Google Scholar]
- 80.English DR, Holman CDJ, Milne E, The Quantification of Drug Caused Morbidity and Mortality in Australia 1995. Canberra: Commonwealth Department of Human Services and Health; 1995. ( [Google Scholar]
- 81.Perry IJ, Wannamethee SG. Walker MK. Prospective study of risk factors for development of non-insulin dependent diabetes in middle aged British men. BMJ. 1995;310:560–564. doi: 10.1136/bmj.310.6979.560. & . ( [DOI] [PMC free article] [PubMed] [Google Scholar]
- 82.Rimm EB, Chan J. Stampfer MJ. Prospective study for cigarette smoking, alcohol use, and the risk of diabetes in men. BMJ. 1995;310:555–559. doi: 10.1136/bmj.310.6979.555. & . ( [DOI] [PMC free article] [PubMed] [Google Scholar]
- 83.Bowman SA. Television-viewing characteristics of adults: correlations to eating practices and overweight and health status. Prev Chronic Dis. 2006;3:A38. ( [PMC free article] [PubMed] [Google Scholar]
- 84.Hu FB, Li TY, Colditz GA. et al. Television watching and other sedentary behaviors in relation to risk of obesity and type 2 diabetes mellitus in women. JAMA. 2003;289:1785–1791. doi: 10.1001/jama.289.14.1785. ( [DOI] [PubMed] [Google Scholar]
- 85.Maty SC, James SA. Kaplan GA. Life-course socioeconomic position and incidence of diabetes mellitus among blacks and whites: The Alameda County Study, 1965–1999. Am J Public Health. 2010;100:137–145. doi: 10.2105/AJPH.2008.133892. & . ( [DOI] [PMC free article] [PubMed] [Google Scholar]
- 86.Reddy KS, Prabhakaran D. Jeemon P. Educational status and cardiovascular risk profile in Indians. Proc Natl Acad Sci USA. 2007;104:16263–16268. doi: 10.1073/pnas.0700933104. & . ( [DOI] [PMC free article] [PubMed] [Google Scholar]
- 87.Bhopal R, Hayes L. White M. Ethnic and socio-economic inequalities in coronary heart disease, diabetes and risk factors in Europeans and South Asians. J Public Health Med. 2002;24:95–105. doi: 10.1093/pubmed/24.2.95. & . ( [DOI] [PubMed] [Google Scholar]