Abstract
Interactions of mucin glycoproteins with cognate receptors are dictated by the structures and spatial organization of glycans that decorate the mucin polypeptide backbone. The glycan-binding proteins, or lectins, that interact with mucins are often oligomeric receptors with multiple ligand binding domains. In this work, we employed a microarray platform comprising synthetic glycopolymers that emulate natural mucins arrayed at different surface densities to evaluate how glycan valency and spatial separation affect the preferential binding mode of a particular lectin. We evaluated a panel of four lectins (Soybean agglutinin (SBA), Wisteria floribunda lectin (WFL), Vicia villosa-B-4 agglutinin (VVA), and Helix pomatia agglutin (HPA)) with specificity for α-N-acetylgalactosamine (α-GalNAc), an epitope displayed on mucins overexpressed in many adenocarcinomas. While these lectins possess the ability to agglutinate A1-blood cells carrying the α-GalNAc epitope and cross-link low valency glycoconjugates, only SBA showed a tendency to form intermolecular cross-links among the arrayed polyvalent mucin mimetics. These results suggest that glycopolymer microarrays can reveal discrete higher-order binding preferences beyond the recognition of individual glycan epitopes. Our findings indicate that glycan valency can set thresholds for cross-linking by lectins. More broadly, well-defined synthetic glycopolymers enable the integration of glycoconjugate structural and spatial diversity in a single microarray screening platform.
Introduction
A major effort in functional glycomics is to catalog the specificities of glycan-binding proteins (GBPs) toward the diversity of glycan structures found in biological systems. In nature, the typically weak binding interactions between GBPs (e.g., lectins or antibodies) and individual glycans are augmented by their organization in multivalent displays on glycoprotein scaffolds.1 In many instances, the glycan structure alone is not sufficient to generate a recognition event below a certain epitope density threshold.2 The multivalency of glycoproteins is mirrored in GBPs that frequently possess more than one glycan-binding site. As a consequence, there are a number of different modes through which GPBs and glycoproteins can engage each other. For instance, mucins, highly glycosylated proteins that populate surfaces of cells, can serve as discrete ligands for oligomeric lectin receptors.3 An example of this type of interaction is the binding of the macrophage galactose-type lectin (MGL) receptors4 on dendritic cells to MUC1, an aberrantly glycosylated mucin overexpressed in tumors (Figure 1A).5 Mucins can also be cross-linked by lectins to form active receptor complexes and elicit downstream signaling events.6 For instance, galectin-1 cross-linking of the mucin-type CD43 receptor complexed with CD7 triggers apoptosis in human T cells (Figure 1B).7 As well, glycoprotein clustering has been suggested as a regulatory mechanism for the maintenance of cell-surface glycan density gradients required for innate immunity.8 Understanding the factors that determine if mucins will form discrete complexes with lectins or become cross-linked is critical not only for our basic understanding of mucin biology, but also for our ability to exploit these events for therapeutic gains.
Figure 1.
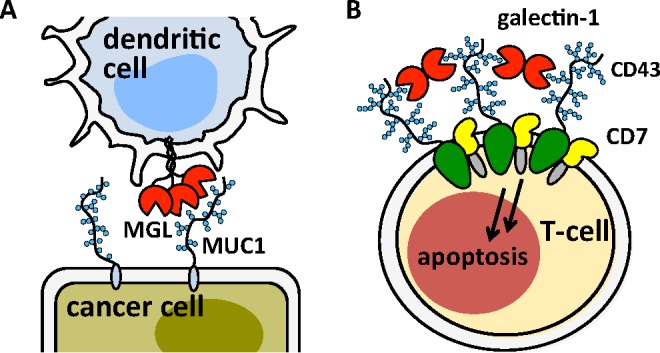
Schematic representation of two major binding modes between mucins and multidomain lectin receptors. (A) The oligomeric macrophage galactose-type lectins (MGLs) of dendritic cells form discrete adhesion complexes with MUC1 overexpressed on cancer cells. (B) Galectin-1 cross-linking of the mucin-type glycoprotein CD43 and CD7 triggers apoptosis in T-cells.
Techniques such as inhibition binding assays, isothermal titration calorimetry, or surface plasmon resonance are routinely used to study multivalent glycan–receptor interactions.9 However, they do not yield themselves to the kind of rapid and high-throughput analysis that is required for systems-level analysis of glycan-binding proteins that are emerging from functional glycomics programs. Glycan microarrays are now considered essential tools for determining the ligand specificities of GBPs.10 In a traditional platform, individual monovalent glycans are attached to the array surface via a linker molecule giving a multivalent display that is sufficient to elicit a high-avidity binding event (Figure 2A).
Figure 2.
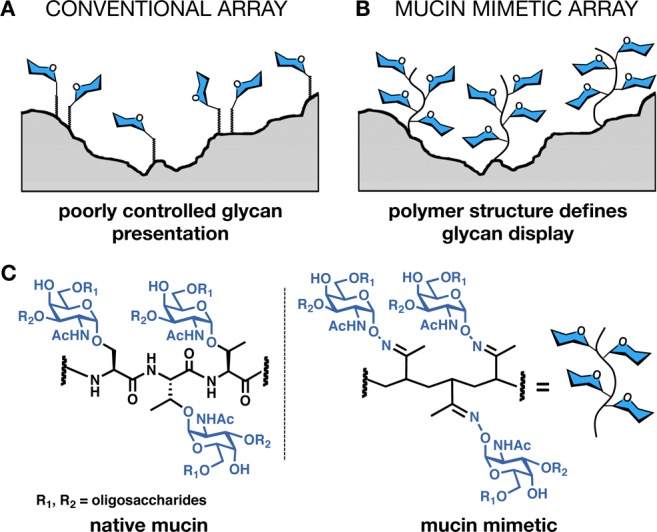
Schematic of mucin mimetic glycopolymer arrays. (A) Traditional glycan arrays rely on two-dimensional arrangements of monovalent glycans with very little control over spatial organization. (B) Glycan presentation on polymeric scaffolds more closely mimics that in native mucins. (C) Left: serine- and threonine-rich domains decorated with branched glycans initiating with a core sugar, α-N-acetylgalactosamine (α-GalNAc), are the hallmark of mucins. Right: a mucin-mimetic domain generated by oxime ligation of α-aminooxy-GalNAc to a poly(methylvinyl ketone) backbone.
Because of poor control over spacing between adjacent epitopes and the two-dimensionality of their presentation on an irregular surface, the current arrays yield very little information beyond indicating which glycan structures are preferred by a specific GBP. An array allowing high-throughput interrogation of glycans in a more physiologically relevant context (e.g., in arrangements found in native mucins, Figure 2B) would provide additional information about how valency and spatial organization of glycans govern their recognition by GBPs.
Recently, Pieters11 and Gildersleeve12 and their co-workers explored the use of multivalent ligands (i.e., glycodendrimers and bovine serum albumin (BSA)-based neoglycoconjugates, respectively) to control the valency of glycan display in microarrays on a biologically relevant scale. Their studies revealed distinct preferences of lectins and antibodies to engage the microarrayed glycoconjugates with particular ligand valencies. In addition, the Gildersleeve team showed that reducing the neoglycoconjugates’ surface density eliminated cross-linking of adjacent array-bound ligands and enabled the identification of high-avidity inhibitors of GBPs.13 While the dendrimer and BSA scaffolds are well suited to mimic small globular low-valency glycoproteins (e.g., <40 glycans per BSA glycoconjugate), they have limited applicability as models for mucins.
The heterogeneous glycosylation of native mucins complicates their direct use in glycan arrays; however, their fundamental architectural features can be recapitulated in linear synthetic glycopolymers with a great degree of control over glycan structure, valency, and presentation.14,15 There is a rich history of glycopolymers serving as soluble multivalent ligands that bind cell-surface receptors and activate biological processes.16 As well, surface-bound glycopolymers have been shown to bind to protein receptors with higher avidity than immobilized monovalent glycans.17
Despite their structural diversity, all mucin glycans share a common α-N-acetylgalactosamine (GalNAc) core sugar through which they are attached to serine or threonine residues of the mucins’ polypeptide backbone (Figure 2C). Mucins decorated with only the GalNAc monosaccharide (called the Tn antigen) result from aberrant glycosylation associated with tumor progression.5,18 Because of Tn antigen’s biological significance, we have previously synthesized mucin mimetic glycopolymers displaying α-GalNAc residues attached to poly(methylvinyl ketone) (pMVK) backbones via oxime linkages (Figure 2C).14,19 Micropatterns of these glycopolymers immobilized on silicon oxide wafers were recognized by the α-GalNAc-specific lectin Helix pomatia agglutinin (HPA).14 Dynamic light scattering and transition electron microscopy confirmed that, just like native mucins, the mucin mimetics adopt extended conformations. Moreover, the polymers can be endowed with a range of surface anchors, as well as optical probes for imaging and quantitation, making them ideally suited for microarray applications. Interferometric imaging of fluorescently labeled mucin mimetics anchored in supported lipid bilayers through a lipid tail revealed their fluidity and extension away from the bilayer surface,19 a behavior attributed to mucins populating cellular membranes.
Here, we describe the construction of a mucin mimetic glycopolymer microarray and its use as a tool to rapidly and quantitatively evaluate the potential of a panel of Tn antigen-binding lectins to cross-link polyvalent mucin-like glycoconjugates. Our array platform revealed a strong preference of the tested lectins to engage the surface-bound polyvalent mucin-like ligands mainly through the formation of discrete adhesion complexes rather than by cross-linking.
Methods
All chemicals, unless stated otherwise, were purchased from Sigma-Aldrich. Chain transfer agent 2 and α-aminooxy-GalNAc (5) were synthesized according to previously published procedures.20,21 Blocker Casein solution in phosphate buffered saline (PBS) was purchased from Thermo Fisher and filtered through a 0.2 μm filter prior to use. FlexWells were purchased from Grace Biolabs. Glycine max (soybean) agglutinin and H. pomatia agglutinin were purchased from Sigma-Aldrich, Vicia villosa-B4 was obtained from E-Y Laboratories, Wisteria floribunda lectin was purchased from Vector laboratories. Cy3-maleimide and AlexaFluor-647 N-hydroxysuccinimidyl ester (AF647-NHS) were purchased from GE Healthcare and Invitrogen, respectively. Sephadex G-25 (PD-10) columns and GalNAc-agarose were purchased from GE Healthcare and Sigma-Aldrich. Solvents were purified on a Glass Contour solvent purification system. Column chromatography was performed on Biotage SP1 flash chromatography system. Nuclear magnetic resonance (NMR) spectra were recorded on a Bruker Biospin Advance II 500 MHz High Performance NMR spectrometer with multinuclear CP-MAS probe. Spectra were recorded in CDCl3 or D2O solutions at 293 K and referenced to residual solvent peaks. Size exclusion chromatography (SEC) was performed on Shimadzu LC-20AD Prominence Liquid Chromatograph with Viscotek VE 3580 RI detector. For measurements in DMF (0.2% LiBr), the instrument was equipped with two in-series mixed bed GMHHR-M columns, separation range 100–4 M (30 cm × 7.8 mm i.d.) at 70 °C. Microarrays were fabricated on Nexterion Slide-S streptavidin-coated glass substrates (Schott) using the DeRisi linear servomotor microarrayer (Center for Advanced Technologies at UCSF) equipped with 75-μm silicon PETC pins from Parallel Synthesis Technologies, Inc. Microarrays were scanned on Axon GenePix 4000B scanner and analyzed by GenePix Pro 7.0 software. UV–vis spectra were collected on a Perkin-Elmer Lambda 35 UV/vis spectrometer. Molecular weight analysis of lectins was performed on GE Healthcare Akta FPLC equipped with Superdex 200 column equilibrated at 4 °C in either 10 mM TRIS buffer (150 mM NaCl, pH = 8.5) for HPA and WFL or 10 mM sodium phosphate buffer (150 mM NaCl, pH = 7.3) for SBA and VVA.
RAFT Polymerization of MVK (1)22 in the Presence of Biotinylated Chain Transfer Agent 2
A flame-dried Schlenk flask (10 mL) equipped with a magnetic stirring bar was charged with 2 (22.8 mg, 0.036 mmol, 0.58 mol %), ACVA (4,4′-azobis(4-cyanovaleric acid), 2.9 mg, 0.010 mmol, 0.17 mol %), and MVK (1, 437.2 mg, 6.238 mmol, freshly distilled). Freshly distilled 2-butanone (476 mg) was added to give ∼50 wt % solution of 1. The flask was equipped with a rubber septum and attached to a Schlenk line. The yellow solution was degassed by three freeze–pump–thaw cycles. After the final cycle, the flask was backfilled with N2, allowed to warm to room temperature and immersed into an oil bath preheated to 65 °C. After 16.5 h, the reaction mixture was diluted with CH2Cl2 and precipitated by the addition of hexanes. The residue was redissolved in a minimal quantity of CH2Cl2 and precipitated again by the addition of hexanes with vigorous stirring. This was repeated twice more. The yellow polymer was concentrated from chloroform three times to remove residual hexanes and dried under high vacuum overnight to give polymer 3 as a pale yellow solid (376.2 mg, 82%). For 1H NMR spectrum see Supporting Information. SEC (DMF, 0.2% LiBr): Mw = 15.08 kDa, Mn = 13.18 kDa, DP = 205, PDI = 1.12.
Polymer backbone 7 was prepared in an identical manner, except 50:1 MVK to CTA ratio was employed. Polymer 7 was isolated as a yellow solid (92%). For 1H NMR spectrum see Supporting Information. SEC (DMF, 0.2% LiBr): Mw = 4.91 kDa, Mn = 4.35 kDa, DP = 60, PDI = 1.13.
Synthesis of Biotin-Terminated Poly(MVK) with a Reactive Thiol Functionality for Conjugation of Cy3 Label
pMVK 3 (50 mg, 0.004 mmol) was dissolved in DMF (1.5 mL) in a 20-mL scintillation vial equipped with a magnetic stir bar and a septum. To the yellow solution degassed by three freeze–pump–thaw cycles was added cysteamine solution (free base in DMF, c = 632 mM, 0.018 mmol, 29 μL, 5 equiv per trithiocarbonate end group) under N2. The reaction was stirred at room temperature for 20 min. After this time, the solution turned colorless and ether (15 mL) was added. The collected polymer 4 was dissolved in a small amount of chloroform and precipitated by the addition of hexanes. This was repeated twice more and the final white solid (48.2 mg, 96%) was dried under vacuum overnight. For 1H NMR spectrum see Supporting Information. SEC (DMF, 0.2% LiBr): Mw = 15.23 kDa, Mn = 13.43 kDa, PDI = 1.14.
Polymer 8 was prepared in an identical manner and isolated as a white solid (80%). For 1H NMR spectrum see Supporting Information. SEC (DMF, 0.2% LiBr): Mw = 4.58 kDa, Mn = 4.01 kDa, DP = 60, PDI = 1.14.
Synthesis of Cy3-Labeled Mucin Mimetics
In a 4-mL vial equipped with a magnetic stir bar, the free thiol-terminated polymer intermediate 4 (5.55 mg, 3.54 × 10⁻⁴ mmol) was dissolved in DMF containing ethylenediamine (4.5 mM, 0.20 mL) and Cy3-maleimide (0.40 mg, 6.02 × 10⁻⁴ mmol, 1.7 equiv). The solution was degassed and allowed to stir at room temperature for 18 h. After this time, the reaction mixture was diluted with CH2Cl2 and precipitated by the addition of hexanes. The resulting Cy3-labeled polymer was divided into five Eppendorf tubes (1.03 mg/tube, 0.007 mmol of keto groups) and dissolved in THF (39.4 μL). Aliquots of a solution of α-aminooxy-GalNAc (5, c = 0.5 M in 100 mM sodium phosphate, pH = 5.2) were added to each tube to obtain α-aminooxy-GalNAc/keto group molar ratios of 0.3, 0.5, 0.6, 0.8, and 1.0. Additional phosphate buffer was added to bring the final volume in each tube to 60.0 μL (cketone = 250 mM). The tubes were closed and placed in a heating block and the reaction was allowed to proceed at 50 °C for 20 h. After this time, the reaction mixtures were loaded onto a Sephadex G-25 (PD-10) desalting column. The polymers were eluted with DI water and the collected fractions were lyophilized to give polymers 6. On the basis of absorbance at λmax = 550 nm, the extent of labeling of polymers 6a–e was determined to be 0.99 ± 0.22 Cy3-labels per chain. Polymer 8 was elaborated into the low valency glycopolymer 9 according to the same procedure using an α-aminooxy-GalNAc/keto group molar ratio of 0.4.
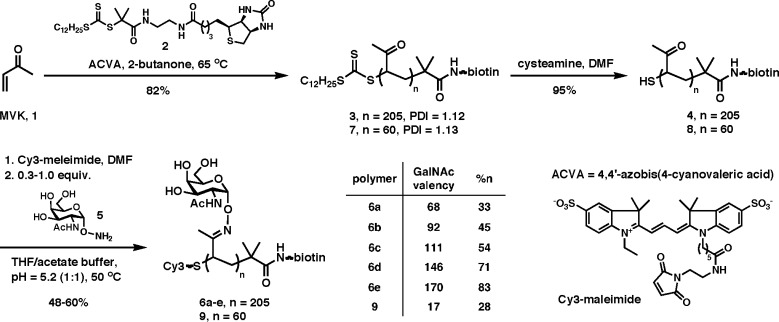
Ligation efficiencies listed in Scheme 1 were determined by 1H NMR analysis in D2O (spectra for all polymers are included in Supporting Information). We were unable to confirm the molecular weights of the resulting polymers by SEC (100 mM NaNO3, 40 °C) analysis using conventional calibration methods, due to their increased retention with respect to the globular PEO and dextran standards on stationary phases available to us (Shodex QHPak SB-804-HQ and Viscotek GMPWXL).
Scheme 1. Synthesis of Mucin Mimetics.
Preparation of Fluorescently Labeled Lectins
To a solution of lectins (2 mg/mL) in sodium carbonate buffer (100 mM, pH = 8.3) containing free GalNAc (200 mM) was added a solution of AF647-NHS ester in DMSO (c = 10 mg/mL, 4 equiv). The resulting mixture was allowed to react at room temperature for 2 h. After this time, the solution was loaded onto a Sephadex G-25 PD-10 desalting column and eluted with PBS (100 mM, pH = 7.2) buffer. The lectins were spin-dialyzed against PBS to remove any free GalNAc, loaded onto a short GalNAc-agarose affinity column and washed with PBS. The bound lectins were released from the column with a solution of free GalNAc (200 mM in PBS). The eluted fractions were once more spin-dialyzed against a storage buffer to remove free GalNAc. The final protein concentrations and extent of labeling were determined by UV–vis (buffers, extinction coefficients at λ = 280 nm, and labeling efficiencies for all lectins are listed in Table S2 in the Supporting Information). To eliminate self-quenching during microarray analysis, the AF647-labeled lectins were diluted with the corresponding unlabeled protein to obtain a degree of labeling of ∼0.05–0.10 AF647 dyes per lectin molecule.
Preparation of Reduced W. floribunda Lectin (RWFL)
In an Eppendorf tube equipped with a stir bar, W. floribunda agglutinin (1.33 mg) was dissolved in a solution of dithiothreithol in PBS (0.35%, 0.67 mL). The solution was degassed for 15 min and then stirred under N2 for 4 h. Upon addition of 4-vinylpyridine (5.33 μL), a white precipitate began to form, which was dissolved after 15 min with additional PBS (1 mL). The reaction mixture was loaded onto a Sephadex G-25 PD-10 desalting column and eluted with PBS buffer. The reduced protein was concentrated, labeled with AF647-NHS and affinity purified as described above.
Construction of Mucin Mimetic Arrays
Polymers 6 were dissolved in phosphate buffer (100 mM, pH = 7.2) containing BSA (0.01 wt %) and betaine (1.5 M) at concentrations of 75, 150, and 400 nM. Solutions of polymer 9 in the same buffer were prepared at concentrations of 75, 150, 300, 600, 1200 nM. The resulting solutions were spotted on Nexterion Slide-S while maintaining relative humidity (RH) between 60 and 65% (more detailed printing parameters are included in the Supporting Information). After printing, the slides were stored at 4 °C for at least 1 day to allow sufficient time for grafting of the biotinylated mucin mimetics to the streptavidin surface. Grafting efficiencies of polymers 6 were determined by comparison of fluorescence intensities of the printed spots before (F1) and after (F2) washing of excess unbound polymer (vide infra). The amount of glycopolymer (n2) that remained attached to the array surface was calculated according to eq 1:
| 1 |
where cpol is the concentration of 6 in the printing solution and Vpol is the volume of that solution transferred onto the microarray surface (∼ 0.2 nL). The average spacing (Δ) between adjacent surface-bound glycopolymer molecules was calculated using eq 2:
| 2 |
where rspot is the radius of a spot and NA is Avogadro’s constant (for derivation of eq 2 see Supporting Information).
Determination of Apparent Dissociation Constants for Lectin Binding to Mucin Mimetic Microarrays
Slides spotted with mucin mimetics 6 or glycopolymer 9 were first imaged using a fluorescence scanner at excitation wavelength λex = 535 nm. They were then placed into a slide holder and plunged into a solution of urea (500 mM) in PBS for 1 min. The slides were washed in PBS containing Tween 20 (0.1%) for 15 min and incubated in Blocker Casein in PBS or 1 h to minimize background due to nonspecific lectin binding. After blocking, the slides were washed with PBS for 15 min, rinsed with DI water and dried by centrifugation. The spots were imaged again at λex = 535 nm. Lectin dilution series (8 dilution points according to Table S3 in the Supporting Information) were prepared in buffers containing Tween 20 (0.1%). As a negative control, SBA was diluted in a buffer containing GalNAc (200 mM) and incubated for 15 min prior to microarray analysis. Adhesive FlexWells were mounted onto the slides to separate individual microarrays and the solutions of lectins (10 μL) were added into the wells. The wells were sealed and the arrays were incubated in dark for 1 h. After incubation, the slides were dunked in a beaker filled with PBS to remove excess lectin, the wells were peeled off and the slides were washed in PBS containing 0.1% Tween 20 for 10 min, PBS (2 × 10 min), rinsed with DI water, and spin-dried. All blocking and washing steps were carried out with gentle rocking. We observed the occurrence of FRET between the Cy3 and AF647 fluorophores upon lectin binding. Therefore, the resulting slides were imaged only at λex = 653 and the 653/535 fluorescence intensity ratios were calculated based on the Cy3 intensities collected prior to incubation with lectins. To obtain apparent Kd values, the AF647/Cy3 intensity ratios were plotted against lectin concentrations and the data points were fitted according to eq 3:
| 3 |
where I647/535,obs is the ratio of mean fluorescence intensities of the AF647 and Cy3 labels at a given lectin concentration [L] and I647/535,max is the maximum fluorescence intensity ratio at saturation.
Lectin Precipitation by Soluble Mucin Mimetics
Dilution series of mucin mimetics 6b and 6e (5 μL, c = 200 μM to 98 nM) and glycopolymer 9 (5 μL, c = 400 μM to 200 nM) in a precipitation buffer (10 mM sodium phosphate, 150 mM NaCl, pH = 7.3 for SBA and 10 mM TRIS, 150 mM NaCl, pH = 8.0 for HPA) were generated in plates with 96 V-shaped wells by serial dilution of stock polymer solutions (200 or 400 μM) by a factor of 2. To each well was added a solution of SBA or HPA lectin (5 μL, 60 μM) to obtain a final lectin concentration of 30 μM. The plates were incubated at room temperature for 5 h. After this time, the plates were centrifuged at 4000g for 10 min at 4 °C. The supernatants were removed and the pelleted aggregates were washed gently 3 times with cold PBS buffer. To the resulting precipitates at the bottom of the wells was added a solution of GalNAc in PBS (100 mM, 55 μL). The suspensions were agitated briefly with a pipet tip and allowed to dissociate at room temperature for 10 min. The solutions were centrifuged at 4000g for 10 min to confirm full dissolution of the aggregates. The solutions were transferred into UV-transparent 96-well plates and their absorption was measured at λex = 280. The absorptions were plotted against polymer concentration and fitted with a sigmoidal curve to give P1/2 values (for precipitation curves and data analysis see Supporting Information). The lectin-to-polymer stoichiometries at half-maximal precipitation were calculated as the ratio of precipitated lectin (15 μM) and the corresponding P1/2 value.33
Statistics
Data points in binding isotherms correspond to an arithmetic average of at least 6 individual spots. Kd’s correspond to an average of 4 experiments performed on separate microarrays. Precipitation assays were performed in triplicates, each data series was fitted individually and half-maximal precipitation concentration, P1/2, were determined. P1/2 values in Figure 7 are arithmetic averages for each triplicate. All errors and error bars represent standard deviations from arithmetic average and p-values are calculated using t test with two-tailed distribution and equal variance.
Figure 7.
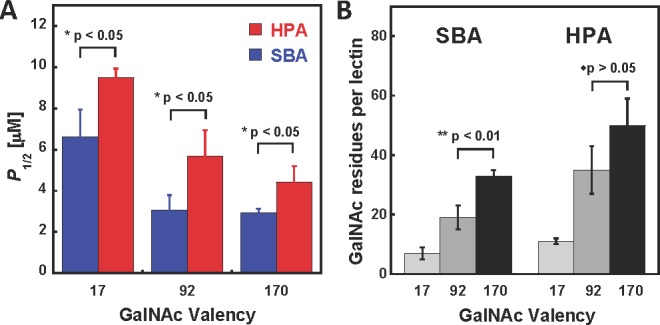
Quantitative precipitation of SBA and HPA by soluble glycopolymers 6b, 6e, and 9 with valencies of 92, 170, and 17 GalNAc residues, respectively. (A) Plot of glycopolymer concentrations (P1/2) necessary to affect half-maximal lectin precipitation as a function of glycopolymer valency. (B) Plot of the number of GalNAc residues per lectin molecule bound in precipitates at P1/2.
Results and Discussion
Synthesis of Mucin Mimetics
We initiated our studies by preparing a series of fluorescent mucin mimetics displaying a range of GalNAc valencies and amenable to immobilization in microarrays. As shown in Scheme 1, RAFT polymerization of methylvinyl ketone (MVK, 1)22 in the presence of a biotin-containing trithiocarbonate chain transfer agent 2 and a radical initiator, ACVA, afforded pMVK polymer 3 with a degree of polymerization (DP) of ∼205 and low polydispersity (PDI = 1.12). One end of the resulting polymer chain was terminated with a biotin handle intended for anchoring of the mucin mimetics to streptavidin-coated microarray substrates. The opposite end of the polymer chain was capped with a trithiocarbonate moiety that, upon rapid aminolysis with cysteamine in DMF, provided a free sulfhydryl group for conjugation of a maleimide-functionalized Cy3 dye. The assembly of the mucin mimetic was then completed by condensation of α-aminooxy-GalNAc (5) to the dual end-functionalized pMVK backbone 4 under acidic conditions at 50 °C. By varying the relative stoichiometry of 5 with respect to the number of keto groups in 4, we obtained five mucin mimetic polymers 6a–e with GalNAc valencies of 68, 92, 111, 146, and 170, as determined by 1H NMR analysis. UV–vis spectroscopy of purified polymers 6 established the Cy3 labeling proceeded quantitatively. By carrying the dye-conjugation step prior to GalNAc ligation, we assured that all five mucin mimetics in our series bore the same amount of Cy3 label irrespective of GalNAc content, thus, facilitating the determination of their densities on the microarray surface.
Construction of Mucin Mimetic Microarrays
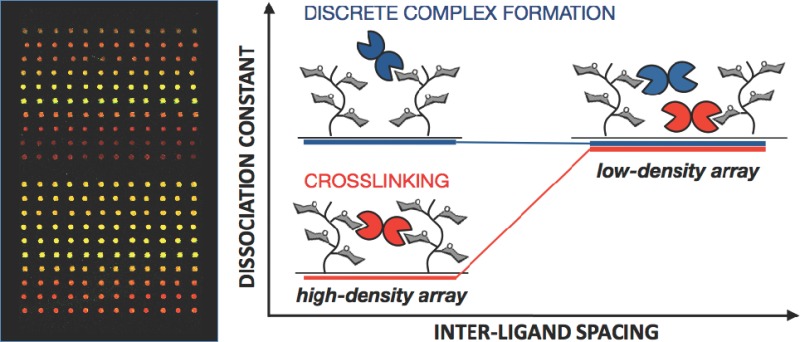
Since our objective was to evaluate the ability of lectins to cross-link polyvalent glycoconjugates, we set to generate arrays of variable glycopolymer surface densities. We reasoned that, by increasing the distance between the surface-bound ligands, we would physically limit the ability of lectins to bridge adjacent glycopolymer molecules. That, in turn, would weaken their binding to the arrayed ligands, as long as cross-linking was a contributing factor to the overall lectin binding avidities (Figure 3). Therefore, if lectins formed discrete complexes with the mucin mimetic ligands (i.e., each lectin binds to only one ligand), the observed dissociation constant (Kd) for this interaction should be independent of the spacing between proximal ligands (Figure 3A). On the other hand, if the lectin’s preference is to also cross-link multiple glycoconjugates, we should observe weaker binding (higher Kd) in the low-density array, where such interactions would be discouraged (Figure 3B).
Figure 3.
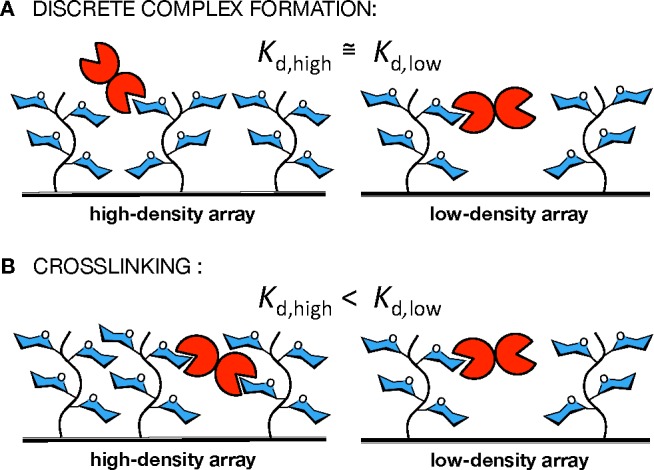
Determination of cross-linking by lectins in mucin mimetic arrays. (A) Cross-linking by lectin does not occur and the observed dissociation constant should be independent of glycolpolymer surface density. (B) Cross-linking is a contributing factor and increasing separation between neighboring mucin mimetic molecules should result in weaker binding (Kd,high and Kd,low denote apparent dissociation constants determined for a lectin in a high and a low glycopolymer surface density array, respectively).
Using contact printing with silicon tips, we spotted solutions of biotinylated mucin mimetics 6 on streptavidin-coated glass slides at concentrations of 400, 150, and 75 nM. We found aqueous sodium phosphate (100 mM, pH = 7.2) containing BSA (0.01%) and betaine (1.5 M) to be an optimal printing buffer giving spots of narrow size distributions and uniform morphology. A glass slide held 64 identical microarrays, each containing five rows of mucin mimetics 6a–e (12 spots per polymer). After printing, the slides were stored at 4 °C overnight to allow sufficient time for attachment of the polymers to the array surface. By comparing the fluorescence intensities of the printed spots before and after washing of excess unbound polymer, we were able to determine the amount of glycopolymer that remained attached to the array surface. The glycopolymer grafting proceeded consistently with ∼40–60% efficiency. We measured the radii of individual spots and calculated the average spacing (Δ) between adjacent surfacebound glycopolymer molecules. A plot of Δ as a function of glycopolymer concentration (Figure 4A) indicates that we were able to modulate the average spacing of the microarrayed glycopolymer ligands in the range of ∼15 nm in the high density array to ∼25 and 35 nm in the medium and low density arrays, respectively. Since the estimated length of our mucin mimetics in their fully extended form is ∼25 nm,23 we did not expect to completely eliminate cross-linking by lectins in the low density microarray; however, we anticipated that an increase of up to 20 nm in glycopolymer separation would discourage cross-linking to an appreciable degree, which would translate into a measurable change in binding avidities. We were unable to increase interligand separation beyond 35 nm without crossing the limit of quantification for our detection scheme.
Figure 4.
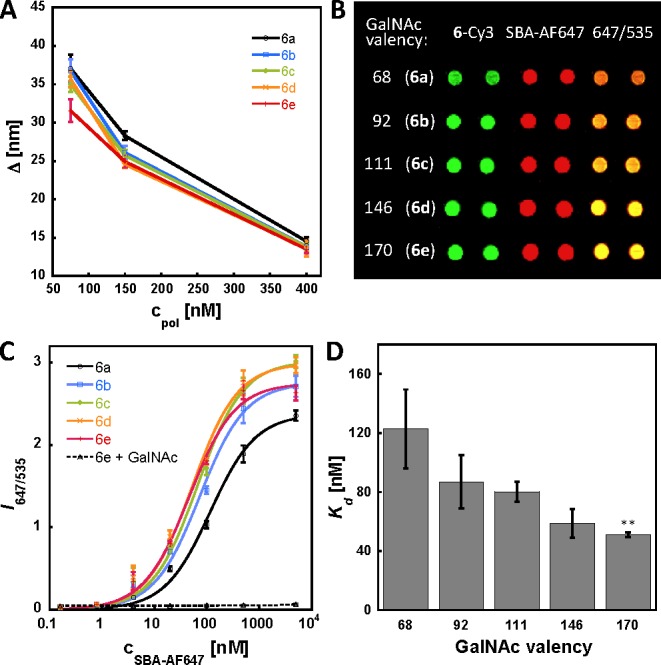
Control of glycopolymer surface density in microarrays and a binding profile of SBA in the lowest density array. (A) Printing with solutions of polymers 6 at concentrations of 75, 150, and 400 nM afforded arrays with average polymer spacing (Δ) of ∼35, 25, and 13 nm, respectively. (B) Image of a portion of the lowest surface density array before (Cy3-channel) and after incubation with SBA-AF647 (100 nM in buffer). (C) Biding isotherms for SBA-AF647 to polymers 6 in the lowest surface density array. (D) Apparent Kd’s obtained for SBA-AF647 in the lowest density array plotted against GalNAc valency in 6. (**p < 0.01; p-value refers to a comparison of Kd’s for polymers 6a and 6e).
Quantitative Evaluation of Lectin Binding to Mucin Mimetics in Microarrays
To quantify the changes in avidities of lectins with changes in GalNAc valency and spatial separation of the mucin mimetics, we determined apparent dissociation constants (Kd’s) for all lectin–glycopolymer combinations at all three surface densities. Kd’s are affinity constants independent of the total amount of ligand attached to a surface and, as such, have become a practical and quantitative way to evaluate binding interactions of biomolecules across different microarray platforms.24,13,12 We used our array to establish the binding profiles of four Tn antigen-recognizing lectins: soybean agglutinin from the G. max (SBA),25W. floribunda lectin (WFL),26V. villosa agglutinin (VVA),27 and H. pomatia agglutinin (HPA).28 First, we incubated each array with AF647-labeled lectins over a range of concentrations. Figure 4B shows a portion of the lowest surface density array before (Cy3 channel) and after (AF647 channel and AF647/Cy3 overlay) incubation with SBA-AF647. We plotted the ratios of fluorescence intensities measured at 635 nm (AF647) and 535 nm (Cy3) excitation wavelengths against the concentration of SBA and determined apparent Kd values by fitting the data points using the single-site Langmuir binding model.24 Figure 4C shows Langmuir isotherms for the binding of SBA-AF647 to polymers 6 in the lowest density array. SBA binding was completely abolished when the experiment was carried out in the presence of free GalNAc ligand (200 mM). This control confirmed that the recognition of mucin mimetics 6 by SBA was glycan specific. Figure 4D shows Kd’s averaged over four experiments plotted against GalNAc valency in polymers 6. The binding profile for SBA clearly shows valency-dependent binding to polymers 6 with polymer 6e (∼ 170 GalNAc residues) giving over 3300-fold avidity enhancement compared to a monovalent Tn-antigen.29 These results are in good agreement with thermodynamic studies by Brewer, Dam, and co-workers on binding of SBA to porcine submaxillary mucins.29 We obtained similar valency-dependent binding profiles for WFL and VVA lectins (see Chart S1 in Supporting Information), while HPA showed a high avidity for 6a (apparent Kd = 1.2 nM) that remained unchanged with further increase in GalNAc valency (Kd’s collected for all lectins in this study are summarized in Tables S4–S9 in the Supporting Information). As well, in their Tn-BSA glycoconjugate array, Gildersleeve and co-workers previously observed similar valency effects for VVA and SBA, but generally a strong valency-independent binding for HPA.12
Evaluation of Glycopolymer Cross-Linking by Lectins in Density Variant Microarrays
We tested the extent to which a particular lectin is able to cross-link polyvalent glycoconjugates using our mucin mimetic arrays. A plot of the observed Kd’s versus the average spacing of the surface bound glycopolymer ligands are shown for SBA in Figure 5A. Decreasing the interpolymer distance of the lowest GalNAc valency mucin mimetic 6a from ∼35 nm to ∼10 nm gave a 2-fold increase in binding avidity toward SBA. However, no statistically significant difference in SBA binding was observed for the highest valency polymer 6e across an identical range of ligand densities. The data revealed a propensity of SBA to cross-link the lower valency glycopolymers 6a–c, while engaging the higher valency ligands 6d and 6e in discrete complexes.
Figure 5.
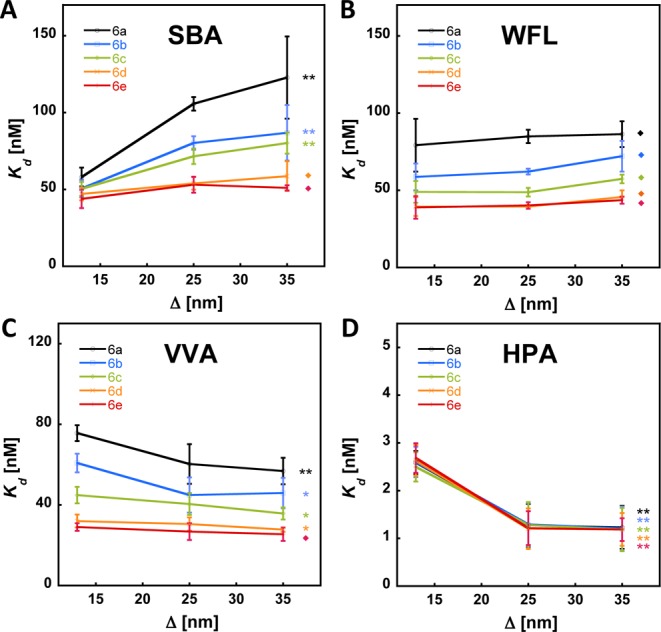
Determination of lectin cross-linking in variable ligand density arrays. (A) A drop in apparent Kd’s for binding of SBA to polymers 6a–c in the highest surface density array (lowest Δ) corresponds to avidity enhancements due to cross-linking by SBA. No SBA cross-linking was observed for polymers 6d and e. Binding profiles for WFL (B), VVA (C), and HPA (D) indicate no cross-linking of polymers 6. A decrease in avidity for VVA and HPA in the highest density array is likely the result of steric interference between lectin molecules bound to proximal ligands (*p < 0.05, **p < 0.01, ⧫p > 0.05; p-values refer to comparison of Kd’s for each polymer in the lowest and highest density arrays).
Next we examined the binding profiles of the remaining lectins in our set. WFL, VVA and HPA (Figure 5B–D) all showed similar behavior, which was quite distinct from that of SBA (Figure 5A). None of these lectins exhibited binding enhancement at the highest surface density array and, in fact, we observed a statistically significant drop in avidities for VVA and HPA with decreasing interpolymer spacing (Figure 5C,D). This phenomenon can possibly be attributed to steric interference between lectin molecules bound to proximal ligands on the array surface.
These results raise interesting questions with regard to how levels of glycosylation in mucins may affect the mode through which they interact with lectin-type receptors. Our observations for SBA indicate that, when cell surface glycoconjugates exceed a certain glycan valency threshold, they become less effective at cross-linking. This conclusion may be extended to the other lectins based on binding data obtained by Gildersleeve and co-workers in their arrays of Tn-BSA conjugates.13 For instance, the authors obtained strong VVA binding to a GalNAc-BSA glycoconjugate with a valency of 22 at high ligand surface densities (Kd = 184 ± 27 nM), but no measurable binding when the same glycoconjugate was spaced further apart on the surface. They attributed this avidity enhancement in the high-density array to contributions from cross-linking. These results indicate the ability of VVA to cross-link multivalent glycoconjugates, but its capacity to do so is severely curtailed in our arrays where the valencies of the glycopolymer ligands exceeded ∼70 GalNAc epitopes.
To investigate whether valency may set a threshold for cross-linking by lectins, we synthesized a glycopolymer ligand 9 (Scheme 1), which shared the same general architecture with the mucin mimetics 6, but was considerably shorter (DP ∼ 60, ∼ 8 nm) and carried only ∼17 GalNAc residues. We then generated arrays with average spacing of 9 ranging from ∼7 nm to ∼28 nm (for array characterization see Supporting Information). At the highest surface density, the ∼8 nm long polymers are positioned sufficiently close to one another to allow for cross-linking by lectins. Figure 6 shows the binding profiles for each lectin obtained from the short glycopolymer array. At the lowest polymer surface density (spacing of ∼28 nm), SBA, WFL, and VVA bound to polymer 9 considerably less strongly than they did to the mucin mimetics 6 at the same surface density, while HPA showed only a modest drop in avidity. This is in agreement with the valency-dependent binding observed for each lectin in the mucin mimetic array (vide supra). However, we observed an increase in binding avidities for all four lectins at interpolymer spacing of ∼7 nm, indicative of cross-linking of 9 by the lectins. The magnitude of the avidity enhancement, defined as the ratio between apparent Kd’s at low and high surface densities, can be used to rank the lectins according to their relative tendency to cross-link glycopolymer 9. Of the four lectins, HPA had the lowest propensity to cross-link (affinity enhancement ∼1.5). On the other hand, SBA effectively engaged the high-density polymer array (Kd ∼360 nM), but bound to polymers separated by ∼28 nm too weakly to give a measurable Kd (for a complete list of Kd’s and statistical analysis see Table S9 in the Supporting Information). The observed affinity enhancements were concordant with data collected by Gildersleeve and co-workers in their GalNAc-BSA neoglycoconjugate arrays.13 For instance, the typical affinity enhancements obtained in their study for the binding of VVA toward the Tn-BSA ligands (GalNAc valency ∼20–80) printed at two different surface densities ranged from ∼5 to more than 25-fold, while the murine macrophage galactose-type lectin-2 (mMGL-2) exhibited a more modest 2-fold increase in avidities across the same set of glycoconjugates. These affinity enhancements are likely to be greater on surfaces of cells, where most glycoconjugates are mobile and can accommodate optimal spatial arrangements that maximize cross-linking. At the same time, only a small energetic bias for cross-linking over discrete complex formation may provide a mechanism for dynamic assembly and disassembly of signaling complexes in cellular membranes.
Figure 6.
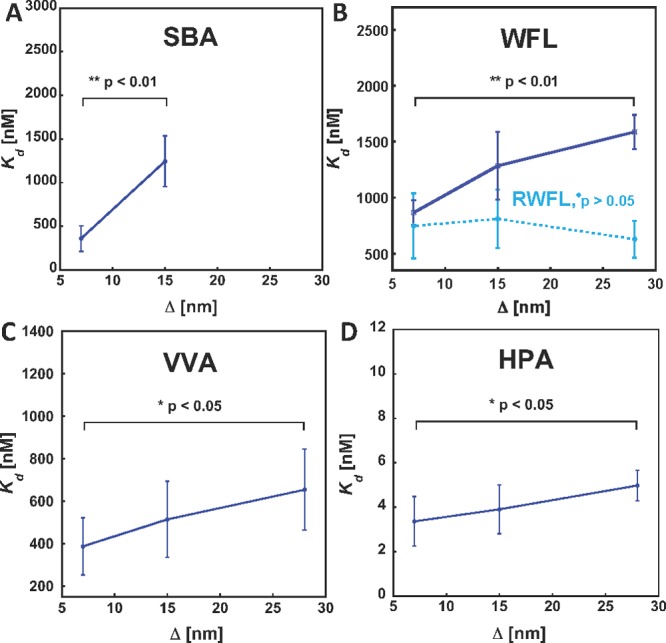
Cross-linking by lectins in density variant arrays of low-valency glycopolymer 9. The lectins show different levels of avidity enhancements resulting from decreased interligand spacing (Δ) indicating their unique intrinsic ability to cross-link polymer 9. No measurable binding was observed for SBA in the lowest density array. RWFL, a reduced nonagglutinating form of WFL, showed no cross-linking activity (p-values refer to comparison of Kd’s for each lectin at the lowest and highest polymer density).
To further confirm that avidity enhancements observed on the highest density array were due to cross-linking, we sought to compare the avidities of multimeric lectins with their constituent noncross-linking components. Most lectins exist in various oligomeric states under physiological conditions and are difficult to dissociate into monomers that retain high affinity for their glycan ligands.30 However, the disulfide-bridged WFL can be reductively dissociated into two subunits (RWFL) that still bind GalNAc but no longer agglutinate erythrocytes.26b This process is reversible and agglutination activity can be fully recovered upon reoxidation of RWFL back to the lectin’s original oligomeric state. We obtained RWFL by reduction of WFL with dithiothreithol, followed by capping of the resulting free sulfhydryl groups with 4-vinylpyridine31 to prevent reoxidation (Section 8 in the Supporting Information). SDS-PAGE analysis under nonreducing conditions verified complete dissociation of WFL.
In contrast to WFL, RWFL showed no change in binding avidity across the different surface densities of glycopolymer 9 in our arrays (Figure 6B) and, hence, no cross-linking, consistent with RWFL’s lack of agglutination activity. This result confirms that the avidity enhancements observed in highest-density arrays reflect cross-linking by the lectins rather than, for example, statistical effects associated with increasing GalNAc epitope density. In fact, the highest density array of glycopolymer 9 displays approximately 10% more GalNAc residues compared to the highest density array of the mucin mimetic 6a (see Section 7 in the Supporting Information), yet all the lectins bind the latter with much greater avidity (e.g., in the case of SBA, Kd,high = 361 ± 148 and 58 ± 6 nM for polymers 9 and 6a, respectively). This observation testifies to the power of array platforms based on three-dimensional multivalent glycan display, as such nuances of ligand binding preference might be obscured in the traditional glycan array.
Evaluation of Glycopolymer Cross-Linking by Lectins in Solution
A recent study of mucin interactions with lectins by Dam, Brewer and co-workers based on solution-phase isothermal titration calorimetry experiments29 revealed that oligomeric lectins engaged mucins with a gradient of diminishing microscopic affinity constants. This led the authors to propose a binding model in which the lectin slides along the mucin backbone, binding to only one GalNAc residue at a time. Increasing GalNAc valency then leads to extended persistence times of the complex and, thus, lower apparent dissociation constants. The unoccupied GalNAc binding sites in the mucin-associated lectins remain available for interactions with other mucin molecules, which may account for the precipitation of cross-linked mucins following saturation binding.
Brewer and co-workers also developed a quantitative precipitation assay to determine the composition of complexes resulting from cross-linking of glycoconjugates by lectins.32 Kiessling and her co-workers later adapted this method to study how architectures of multivalent ligand scaffolds affect receptor clustering.33 In this assay, lectins are incubated with solutions of glycoconjugates. The insoluble cross-linked aggregates that form are then isolated, dissociated in the presence of a free monosaccharide ligand and the concentration of the released soluble lectin is determined based on absorbance of the resulting solutions. The concentration of glycoconjugate required for half-maximal (P1/2) lectin precipitation is indicative of cross-linking efficiency.
To assess whether the cross-linking activities of lectins observed in our density variant arrays are mirrored by their behavior in solution, we subjected SBA and HPA to the quantitative precipitation assay in the presence of mucin mimetics 6b and 6e (∼ 92 and 170 GalNAc residues, respectively) as well as the low valency glycopolymer 9 (17 GalNAc residues). Solutions of either lectin (30 μM) were incubated with each glycopolymer over a range of concentrations (50 nM to 100 μM for 6a and 6b or 100 nM to 200 μM for 9) at ambient temperature for 5 h. The precipitates were isolated by centrifugation, gently washed with cold precipitation buffer and dissolved in the presence of free GalNAc (100 mM in PBS buffer). Precipitation profiles were constructed by plotting lectin absorbance against the concentration of polymers and fitted to give P1/2 values (for precipitation curves, complete listing of P1/2 values and statistical analysis see Supporting Information). Figure 7A shows that all three polymers precipitated SBA more efficiently than HPA, consistent with the greater propensity of SBA for cross-linking observed in our microarrays.
Changes in cross-linking efficiencies of lectins as a function of GalNAc valency of the different ligands cannot be assessed by direct comparison of P1/2 values, since those also reflect enhanced binding avidities that increase with valency. Rather, Kiessling and co-workers have previously used the number of binding residues per lectin as an indicator of clustering efficiency.33 Accordingly, on a per GalNAc residue basis, the lowest valency glycopolymer 9 (17 GalNAc residues) precipitated both SBA and HPA more efficiently than did the mucin mimetics 6 (Figure 7B). And, similarly, the lower valency mucin mimetic 6b (92 GalNAc residues) had a greater tendency to precipitate SBA than the highest valency mucin mimetic 6e (170 GalNAc residues). However, there was no statistically significant change in the GalNAc per lectin ratios of the precipitates formed with HPA and 6b or 6e, indicating that there is no difference in cross-linking activity between the two mucin mimetics. Our microarray findings that neither SBA nor HPA cross-links the highest valency mucin mimetic 6e are not inconsistent with the precipitation data, as the sizes of discrete complexes formed between this polymer and either lectin (four SBA and five HPA molecules per 6e, respectively; see Table S10 in Supporting Information) might be large enough to induce precipitation from solution without necessitating cross-linking.
The crystal structures of SBA and HPA are available and can provide a rationale for the differences in cross-linking activities of these lectins. SBA is a tetramer, in which the GalNAc binding domains are located at the apexes of a quadrangle spaced by ∼5 and 7 nm (Figure 8A).34 HPA is a trimer of disulfide-bridged dimers with three GalNAc binding domains clustered together within ∼3 nm on each face of the 10 nm long protein (Figure 8B).35 The strong, valency independent binding of HPA (Kd ∼ 1 nM across the set of mucin mimetics) suggests that HPA binds to the glycopolymers in a “face-to-face” mode, where two GalNAc residues on the same polymer engage simultaneously two adjacent binding sites (Figure 8B).36 The dissociation constant for this interaction would be approximately the product of dissociation constants for two individual binding events (Kd ∼ 10 nM based on ∼100 μM binding of GalNAc monosaccharide to HPA28). The spacing of the binding sites in HPA is similar to that of the galactose binding domains in Shiga toxin (∼ 3 nm), where such a “face-to-face” interaction with a synthetic multivalent glycoconjugate was notably demonstrated by Bundle and co-workers.37
Figure 8.
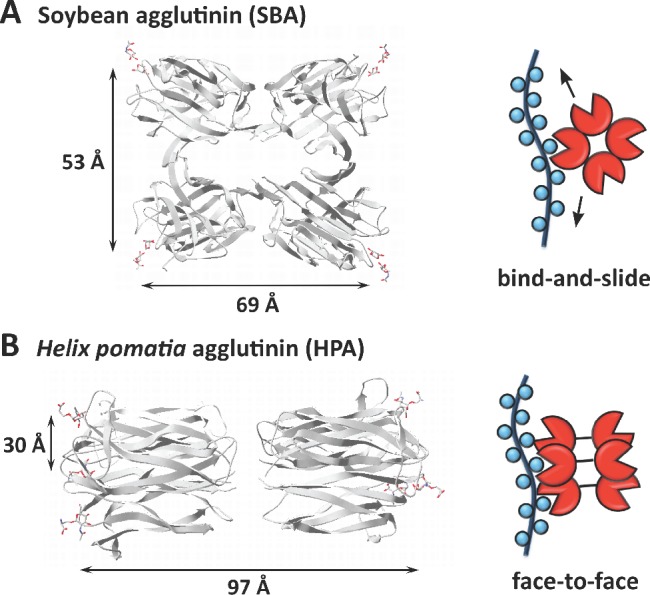
Crystal structures of SBA (A) and HPA (B) lectins in complex with GalNAc-containing ligands (left) and their proposed interactions with mucin mimetics (right). (A) A “bind-and-slide” mode has previously been proposed for the interaction of the tetrameric SBA lectin with mucin-type polyvalent glycoconjugates.29 (B) The strong, valency-independent association of HPA with mucin mimetics 6 is likely to occur through a “face-to-face” binding mechanism.
On the basis of our observation of valency-sensitive binding and consistent with the thermodynamic studies by Brewer and co-workers,29 SBA is likely to engage the mucin mimetics in a “bind-and-slide” mode (vide supra). The binding sites in SBA are likely too far apart to support “face-to-face” interactions with the mucin mimetics, especially in the case of the more conformationally flexible lower valency glycopolymer ligands. As previously proposed by Brewer,29 this provides SBA with an opportunity to dynamically assemble along the glycopolymer backbone and maximize the number of binding interactions with the glycopolymers through the formation of well-organized cross-linked networks (Figure 9A).34,38
Figure 9.
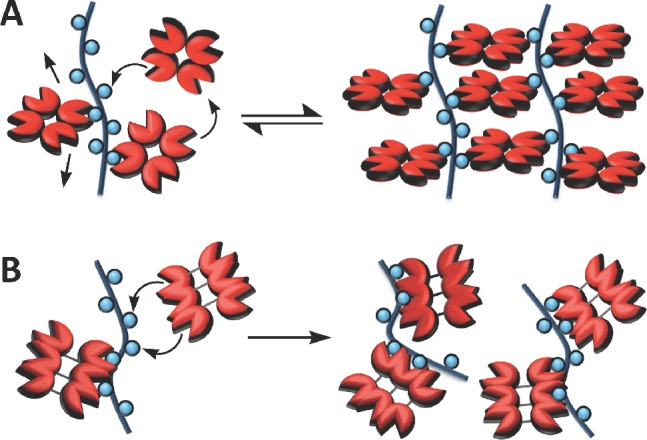
A mechanistic rationale for distinct cross-linking activities of SBA and HPA. (A) The reversible “bind-and-slide” mechanism allows for dynamic assembly of SBA along the polymer scaffold while maximizing binding interactions through cross-linking. (B) Strong “face-to-face” interactions of HPA with the glycopolymers may lead to the formation of kinetically trapped species with a limited number of unbound GalNAc residues available for cross-linking.
On the other hand, the much stronger binding HPA is likely to associate with the glycopolymers more rapidly, forming less ordered, kinetically trapped aggregates where fewer GalNAc sites remain accessible for cross-linking (Figure 9B). This hypothesis is corroborated by our precipitation experiments, in which we observed a greater number of SBA tetramers associated with glycopolymer 6b than would be expected based on the hydrodynamic radius of the lectin (5 SBA tetramers bound to the ∼25 nm long glycopolymers, Table S10 in the Supporting Information). By comparison, ∼ 3 HPA hexamers would be reasonably accommodated by the same polymer in a “face-to-face” binding mode. As well, the generally lower GalNAc-to-lectin ratio found in the glycopolymer precipitates with SBA (e.g., ∼19 GalNAc residues in polymer 6b per SBA tetramer compared to ∼35 GalNAc residues per molecule of HPA, Figure 7B) is evidence of SBA’s more effective use of the GalNAc valency in these ligands.
Our microarray data, confirmed by solution experiments, showed that the ability of SBA to cross-link mucin mimetics 6 decreases with increasing GalNAc valency. The average spacing of GalNAc residues along the polymer backbone decreases from ∼37 Å in 6a to ∼16 Å in polymer 6e. The higher density of GalNAc residues along the scaffold should result in a decrease in microscopic off-rates for SBA in the “bind-and-slide” mode and, according to our model, lead to less effective cross-linking. In fact, the precipitation data show that on a per GalNAc residue basis, SBA engages the higher valency mucin mimetics less effectively (Figure 7B and Table S10 in the Supporting Information). Alternatively, the tighter glycan packing in the higher valency glycopolymers is likely to result in a loss of their conformational flexibility. Such payment of an entropic penalty may permit “face-to-face” interactions with SBA, which would also be less conducive to cross-linking.
Overall, our microarray and solution data suggest that cross-linking of polyvalent mucin-like glycoconjugates by lectins is a dynamic event that is attenuated by increasing the strength of the lectin-ligand interactions. The extent to which cross-linking will occur may be controlled by both the lectin as well as the ligand. Based on our data, high avidity lectins, especially those that engage their ligands in a “face-to-face” mode (e.g., HPA) are unlikely to partake in cross-linking. In contrast, more weakly associating lectins that engage mucins in a “bind-and-slide” mode (e.g., SBA) can dynamically assemble along their ligands into organized ensembles that maximize binding interactions through cross-linking. In this scenario, increasing the level of glycosylation of the ligand results in a higher avidity binding that may disfavor cross-linking and, thus, can serve as a regulatory mechanism for biasing those interactions toward discrete complex formation.
Conclusion
In this work, we have developed a microarray platform, in which glycans are presented in polyvalent ensembles on linear polymer backbones mimicking the spatial arrangements of glycans in native mucins. By modulating the molecular composition and surface density of these mucin mimetics, we were able to systematically evaluate how parameters such as GalNAc valency and interligand spacing affect their recognition by several Tn antigen-specific lectins. We observed valency-dependent binding for SBA, WFL and VVA lectins, while HPA showed generally strong avidities toward all the polymers irrespective of their GalNAc valency. Binding profiles obtained from arrays with increasing glycopolymer surface densities revealed that, despite the capacity of all four lectins to cross-link low valency glycoconjugates and to agglutinate A1 cells carrying the GalNAc epitope, only SBA showed propensity to cross-link the high-valency mucin mimetics. This finding shows that glycan valency and organization are critical parameters that determine the modes through which these interactions occur. The mucin mimetic microarray offers a convenient platform to systematically evaluate these parameters and its utility is aided by the modular nature of our synthetic strategy, which we designed to enable rapid diversification of the mucin mimetic structures with respect to their length, glycan composition, and valency.
Acknowledgments
The synthesis of glycopolymers was performed at The Molecular Foundry, Lawrence Berkeley National Laboratory, Berkeley, CA. Microarrays were constructed and lectin-binding assays were performed at the Center For Advanced Technologies at the University of California and the California Institute for Quantitative Biosciences (qb3), San Francisco, CA. We thank Cheryl Goldbeck and Heather Jensen for their help with protein modification and analysis, Prof. Joseph DeRisi for his advice regarding microarray construction, and Dr. Ronald Zuckermann, Dr. Alexis Ostrovski and Dr. Aaron Albers for their valuable insights. This work was supported by the American Recovery and Reinvestment Act (ARRA) funds through a grant to C.R.B. from the National Institutes of Health (GM59907). K.G. was supported by an NIH Pathway to Independence Award (5 K99 EB013446-02).
Supporting Information Available
1H NMR spectra and SEC traces for glycopolymers 6 and 9 and their precursors, microarray printing parameters, characterization and fluorescence scans of full microarrays, lectin characterization data, complete list of dissociation constants for all lectins, plots of Kd’s as a function of GalNAc valency measured in the lowest-density array, and lectin precipitation data and analysis. This material is available free of charge via the Internet at http://pubs.acs.org.
The authors declare no competing financial interest.
Funding Statement
National Institutes of Health, United States
Supplementary Material
References
- a Lundquist J. J.; Toone E. J. Chem. Rev. 2002, 102, 555–578. [DOI] [PubMed] [Google Scholar]; b Mammen M.; Choi S.-K.; Whitesides G. M. Angew. Chem., Int. Ed. 1998, 37, 2754–2794. [DOI] [PubMed] [Google Scholar]; c Lee R. T.; Lee Y. C. Glycoconjugate J. 2000, 17, 543–551. [DOI] [PubMed] [Google Scholar]; d Kitov P. I.; Bundle D. R. J. Am. Chem. Soc. 2003, 125, 16271–16284. [DOI] [PubMed] [Google Scholar]
- Dam T. K.; Brewer C. F. Glycobiology 2010, 20, 270–279. [DOI] [PubMed] [Google Scholar]
- Weis W. I.; Taylor M. E.; Drickamer K. Immunol. Rev. 1998, 163, 19–34. [DOI] [PubMed] [Google Scholar]
- a Saeland E.; van Vliet S. J.; Bäckström M.; van den Berg V. C. M.; Geijtenbeek T. B. H.; Meijer G. A.; van Kooyk Y. Cancer Immunol. Immunother. 2007, 56, 1225–1236. [DOI] [PMC free article] [PubMed] [Google Scholar]; b Napoletano C.; Rughetti A.; Agervig Tarp M. P. A.; Coleman J.; Bennet P. E.; Picco G.; Sale P.; Denda-Nagai K.; Irimura T.; Mandel U.; Clausen H.; Frati L.; Taylor-Papadimitriou J.; Burchell J.; Nuti M. Cancer Res. 2007, 67, 8358–8367. [DOI] [PubMed] [Google Scholar]
- Hollingsworth M. A.; Swanson B. J. Nat. Rev. Cancer 2004, 4, 45–60. [DOI] [PubMed] [Google Scholar]
- a Sacchettini J, C; Baum L. G.; Brewer C. F. Biochemistry 2001, 40, 3009–3015. [DOI] [PubMed] [Google Scholar]; b Dam T. K.; Brewer C. F. Biochemistry 2008, 47, 8470–8476. [DOI] [PubMed] [Google Scholar]; c Singh P. K.; Hollingsworth M. A. Trends Cell Biol. 2006, 16, 467–476. [DOI] [PubMed] [Google Scholar]
- Pace K. E.; Lee C.; Stewart P. L.; Baum L. G. J. Immunol. 1999, 163, 3801–3811. [PubMed] [Google Scholar]
- a Lau K. S.; Partridge E. A.; Grigorian A.; Silvescu C. I.; Reinhold V. N.; Demetriou M.; Dennis J. W. Cell 2007, 129, 123–134. [DOI] [PubMed] [Google Scholar]; b Dam T. K.; Brewer F. C. Glycobiology 2010, 20, 1061–1064. [DOI] [PubMed] [Google Scholar]
- a Dam T. K.; Brewer C. F. Adv. Carb. Chem. Biochem. 2010, 63, 139–164. [DOI] [PubMed] [Google Scholar]; b Kiessling L. L.; Gestwicki J. E.; Strong L. E. Angew. Chem., Int. Ed. 2006, 45, 2348–2368. [DOI] [PMC free article] [PubMed] [Google Scholar]; c Houseman B. T.; Mrksich M. Top. Curr. Chem. 2002, 218, 1–44. [Google Scholar]
- For recent reviews see:; a Rillahan C. E.; Paulson J. C. Annu. Rev. Biochem. 2011, 80, 797–823. [DOI] [PMC free article] [PubMed] [Google Scholar]; b Liang P.-H.; Wu C.-Y.; Greenberg W.; Wong C.-H. Curr. Opin. Chem. Biol. 2008, 12, 86–92. [DOI] [PMC free article] [PubMed] [Google Scholar]; c Oyelaran O.; Gildersleeve J. C. Curr. Opin. Chem. Biol. 2009, 13, 406–413. [DOI] [PMC free article] [PubMed] [Google Scholar]
- Branderhorst H. M.; Ruijtenbeek R.; Liskamp. R. M. J.; Pieters R. J. ChemBioChem 2008, 9, 1836–1844. [DOI] [PubMed] [Google Scholar]
- Oyelaran O.; Li Q.; Farnsworth D.; Gildersleeve J. C. J. Proteome Res. 2009, 8, 3529–3538. [DOI] [PMC free article] [PubMed] [Google Scholar]
- Zhang Y.; Li Q.; Rodriguez L. G.; Glidersleeve J. C. J. Am. Chem. Soc. 2010, 132, 9653–9662. [DOI] [PMC free article] [PubMed] [Google Scholar]
- a Chen X.; Lee G. S.; Zettl A.; Bertozzi C. R. Angew. Chem., Int. Ed. 2004, 43, 6111–6116. [DOI] [PubMed] [Google Scholar]; b Godula K.; Rabuka D.; Nam K. T.; Bertozzi C. R. Angew. Chem., Int. Ed. 2009, 48, 4973–4976. [DOI] [PMC free article] [PubMed] [Google Scholar]
- a Spain S. G.; Gibson M. I.; Cameron N. R. J. Polym. Sci., Part A: Polym. Chem. 2007, 45, 2059–2072. [Google Scholar]; b Ladmiral V.; Melia E.; Haddleton D. M. Eur. Pol. J. 2004, 40, 431–449. [Google Scholar]; c Miura Y. J. Polym. Sci., Part A: Polym. Chem. 2007, 45, 5031–5036. [Google Scholar]; d Ting S. R. S.; Chen G.; Stenzel M. H. Polym. Chem. 2010, 1, 1392–1412. [Google Scholar]
- a Manning D. D.; Hu X.; Beck P.; Kiessling L. L. J. Am. Chem. Soc. 1997, 119, 3161–3162. [Google Scholar]; b Bovin N. E. Glycoconjugate Chem. 1998, 15, 431–446. [DOI] [PubMed] [Google Scholar]; c Gordon E. J.; Gestwicki J. E.; Strong L. E.; Kiessling L. L. Chem. Biol. 2000, 7, 9–16. [DOI] [PubMed] [Google Scholar]; d Mowery P.; Yang Z. Q.; Gordon E. J.; Dwir O.; Spencer A. G.; Alon R.; Kiessling L. L. Chem. Biol. 2004, 11, 725–732. [DOI] [PubMed] [Google Scholar]; e Fleming C.; Maldjian A.; Da Costa D.; Rullay A. K.; Haddleton D. M.; St John J.; Penny P.; Noble R. C.; Cameron N. R.; Davis B. G. Nat. Chem. Biol. 2005, 1, 270–274. [DOI] [PubMed] [Google Scholar]; f Guan R.; Sun X. L.; Hou S.; Wu P.; Chaikof E. L. Bioconjugate Chem. 2004, 15, 145–151. [DOI] [PubMed] [Google Scholar]; g Rawat M.; Gama C. I.; Matson J. B.; Hsieh-Wilson L. C. J. Am. Chem. Soc. 2008, 130, 2959–2961. [DOI] [PMC free article] [PubMed] [Google Scholar]
- a Gestwicki J. E.; Cairo C. W.; Mann D. A.; Owen R. M.; Kiessling L. L. Anal. Biochem. 2002, 305, 149–155. [DOI] [PubMed] [Google Scholar]; b Lee S.-G.; Brown J. M.; Rogers C. J.; Matson J. B.; Krishnamurthy C.; Rawat M.; Hsieh-Wilson L. C. Chem. Sci. 2010, 1, 322–325. [DOI] [PMC free article] [PubMed] [Google Scholar]
- a Springer G. F. J. Mol. Med. 1997, 75, 594–602. [DOI] [PubMed] [Google Scholar]; b Ju. T.; Otto V. I.; Cummings R. D. Angew. Chem., Int. Ed. 2011, 50, 1770–1791. [DOI] [PMC free article] [PubMed] [Google Scholar]; c Brockhausen I. EMBO Rep. 2006, 7, 599–604. [DOI] [PMC free article] [PubMed] [Google Scholar]
- Godula K; Umbel M. L.; Rabuka D; Botyanszki Z; Bertozzi C. R.; Parthasarathy R. J. Am. Chem. Soc. 2009, 131, 10263–10268. [DOI] [PMC free article] [PubMed] [Google Scholar]
- Godula K.; Bertozzi C. R. J. Am. Chem. Soc. 2010, 132, 9963–9965. [DOI] [PMC free article] [PubMed] [Google Scholar]
- Marcaurelle L. A.; Shin Y.; Goon S.; Bertozzi C. R. Org. Lett. 2001, 3, 3691–3694. [DOI] [PubMed] [Google Scholar]
- a Moad G.; Rizzardo E.; Thang S. H. Aust. J. Chem. 2009, 62, 1402–1472. [Google Scholar]; b Cheng C.; Sun G.; Khoshdel E.; Wooley K. L. J. Am. Chem. Soc. 2007, 129, 10086–10087. [DOI] [PubMed] [Google Scholar]
- Based on MM2 force field calculations, we estimate 1.2 Å per monomer unit.
- a Gordus A.; MacBeath G. J. Am. Chem. Soc. 2006, 128, 13668–13669. [DOI] [PubMed] [Google Scholar]; b Liang P.-H.; Wang S.-K.; Wong C.-H. J. Am. Chem. Soc. 2007, 129, 11177–11184. [DOI] [PubMed] [Google Scholar]
- Lotan R.; Siegelman H. W.; Lis H.; Sharon N. J. Biol. Chem. 1974, 249, 1219–1224. [PubMed] [Google Scholar]
- a Toyoshima S.; Akiyama Y.; Nakano K.; Tonomura A.; Osawa T. Biochemistry 1971, 10, 4457–4463. [DOI] [PubMed] [Google Scholar]; b Kurokawa T.; Tsuda M.; Sugino Y. J. Biol. Chem. 1976, 251, 5686–5693. [PubMed] [Google Scholar]; c Cheung G.; Haratz A.; Katar M.; Skrokov R.; Poretz R. D. Biochemisry 1979, 18, 1646–1650. [DOI] [PubMed] [Google Scholar]; d Sugii S.; Kabat E. A. Biochemistry 1980, 19, 1192–1199. [DOI] [PubMed] [Google Scholar]
- Tollefsen S. E.; Kornfeld R. J. Biol. Chem. 1983, 258, 5165–5171. [PubMed] [Google Scholar]
- Sanchez J.-F.; Lescar J.; Chazalet V.; Audfray A.; Gagnon J.; Alvarez R.; Breton C.; Imberty A.; Mitchell E. P. J. Biol. Chem. 2006, 281, 20171–20180. [DOI] [PubMed] [Google Scholar]
- Dam T. K.; Gerken T. A.; Cavada B. S.; Nascimento K. S.; Moura T. R.; Brewer C. F. J. Biol. Chem. 2007, 282, 28256–28263. [DOI] [PubMed] [Google Scholar]
- For example, SBA can only be dissociated from its tetrameric state at pH< 2.Sinha S.; Surolia A. Biophys. J. 2005, 88, 4243–4251. [DOI] [PMC free article] [PubMed] [Google Scholar]
- Kaku H.; Shibuya N. FEBS J. 1992, 306, 176–180. [DOI] [PubMed] [Google Scholar]
- Khan M. I.; Mandal D. K.; Brewer C. F. Carbohydr. Res. 1991, 213, 69–77. [DOI] [PubMed] [Google Scholar]
- a Gestwicki J. E.; Strong L. E.; Cairo C. W.; Boehm F. J.; Kiessling L. L. Chem. Biol. 2002, 9, 163–169. [DOI] [PubMed] [Google Scholar]; b Cairo C. W.; Gestwicki J. E.; Kanai M.; Kiessling L. L. J. Am. Chem. Soc. 2002, 124, 1615–1619. [DOI] [PubMed] [Google Scholar]; c Gestwicki J. E.; Cairo C. W.; Strong L. E.; Oetjen K. A.; Kiessling L. L. J. Am. Chem. Soc. 2002, 124, 14922–14933. [DOI] [PubMed] [Google Scholar]
- a Gupta D.; Bhattacharyya L.; Fant J.; Macaluso F.; Sabesan S.; Brewer C. F. Biochemistry 1994, 33, 7495–7504. [DOI] [PubMed] [Google Scholar]; b Dessen A.; Gupta D.; Sabesan S.; Brewer C. F.; Sacchettini J. C. Biochemistry 1995, 34, 4933–4942. [DOI] [PubMed] [Google Scholar]; c Olsen L. R.; Dessen A.; Gupta D.; Sabesan S.; Sacchettini J. C.; Brewer F. C. Biochemistry 1997, 36, 15073–15080. [DOI] [PubMed] [Google Scholar]
- Sanchez J.-F.; Lescar J.; Chazalet V.; Audfray A.; Gagnon J.; Alvarez R.; Breton C.; Imberty A.; Mitchell E. P. J. Biol. Chem. 2006, 281, 20171–20180. [DOI] [PubMed] [Google Scholar]
- Dam T. K.; Brewer C. F. Biochemistry 2008, 47, 8470–8476. [DOI] [PubMed] [Google Scholar]
- Kitov P. I.; Sadowska J. M.; Mulvey G.; Armstrong G. D.; Ling H.; Pannu N. S.; Read R. J.; Bundle D. R. Nature 2000, 403, 669–672. [DOI] [PubMed] [Google Scholar]
- Sacchettini J. C.; Baum L. G.; Brewer C. F. Biochemistry 2001, 40, 3009–3015. [DOI] [PubMed] [Google Scholar]
Associated Data
This section collects any data citations, data availability statements, or supplementary materials included in this article.


