Abstract
Renal Klotho controls mineral metabolism by directly modulating tubular reabsorption of phosphate and calcium and by acting as a co-receptor for the phosphaturic and vitamin D–regulating hormone fibroblast growth factor-23 (FGF23). Klotho null mice have a markedly abnormal phenotype. We sought to determine effects of renal-specific and partial deletion of Klotho to facilitate investigation of its roles in health and disease. We generated a mouse model with partial deletion of Klotho in distal tubular segments (Ksp-KL−/−). In contrast to Klotho null mice, Ksp-KL−/− mice were fertile, had a normal gross phenotype, and did not have vascular or tubular calcification on renal histology. However, Ksp-KL−/− mice were hyperphosphatemic with elevated FGF23 levels and abundant expression of the sodium-phosphate cotransporter Npt2a at the brush border membrane. Serum calcium and 1,25-dihydroxyvitamin D3 levels were normal but parathyroid hormone levels were decreased. TRPV5 protein was reduced with a parallel mild increase in urinary calcium excretion. Renal expression of vitamin D regulatory enzymes and vitamin D receptor was higher in Ksp-KL−/− mice than controls, suggesting increased turnover of vitamin D metabolites and a functional increase in vitamin D signaling. There was a threshold effect of residual renal Klotho expression on FGF23: deletion of >70% of Klotho resulted in FGF23 levels 30–250 times higher than in wild-type mice. A subgroup of Ksp-KL−/− mice with normal phosphate levels had elevated FGF23, suggesting a Klotho-derived renal-bone feedback loop. Taken together, renal FGF23-Klotho signaling, which is disrupted in CKD, is essential for homeostatic control of mineral metabolism.
Type I membrane-bound α-Klotho (Klotho) is expressed in tissues requiring abundant calcium transport, such as the kidneys and parathyroid glands. It was originally described as a senescence-related protein, because mice lacking functional Klotho protein develop a syndrome resembling human aging, including shortened life span, atherosclerosis, vascular calcification, and osteoporosis.1
Klotho regulates mineral metabolism by promoting renal calcium reabsorption through stabilization of the transient receptor potential vanilloid-5 (TRPV5) channel in distal tubules2 and inhibits inorganic phosphate reabsorption through decreased expression and activity of the sodium-dependent phosphate cotransporter type 2a and c (Npt2a, Npt2c) in proximal tubules.3 Furthermore, Klotho forms a specific receptor complex with fibroblast growth factor receptor 1c (FGFR1c) that transmits signaling of the circulating hormone FGF23.4 Renal FGF23-Klotho signaling leads to internalization of Npt2a and Npt2c5–7 and alterations in Cyp27B1 and Cyp24A1 transcripts encoding regulatory enzymes in vitamin D metabolism.8 At the systemic level, this translates into a reduction of serum phosphate and 1,25-dihydroxyvitamin D3 (1,25(OH)2D).
The importance of Klotho as a renal coreceptor for FGF23 is evidenced by Klotho and Fg23 null mice that share nearly identical biochemical phenotypes consistent with dismantled FGF23 signaling, including hyperphosphatemia, elevated 1,25(OH)2D, and hypercalcemia.1,9 Notably, the aging characteristics of Klotho and Fgf23 null mice are attenuated by dietary restrictions of phosphate and/or 1,25(OH)2D, or by eliminating vitamin D effects through ablation of its receptor (VDR) or the enzyme responsible for its activation (Cyp27B1).10–13 Collectively, this suggests that the aging phenotype is due to both systemic toxicity of mineral metabolites and perturbed FGF23-Klotho signaling.
The FGF23 level gradually increases during progression of CKD, whereas expression of Klotho decreases.14,15 Disturbances in FGF23-Klotho activity presumably contribute to the accelerated aging process and cardiovascular disease evident in CKD patients.16,17 Given the profound phenotype of Klotho null mice, we wanted to determine the effect of a renal-specific and partial deletion of Klotho. Such a model would shed light on several issues, including dose-dependent effects and kidney-derived systemic influence of Klotho on growth development and life span. Furthermore, it would allow the investigation of cell-specific autocrine or paracrine effects of renal Klotho involved in the pathophysiology of CKD-related complications such as interstitial fibrosis and ectopic calcification.
Herein, we generated a novel mouse model with a kidney-specific Klotho deletion mainly in distal tubular segments and provide genetic evidence favoring a pivotal role of FGF23-Klotho signaling in controlling mineral metabolism.
Results
Generation of Ksp-KL−/− Mice
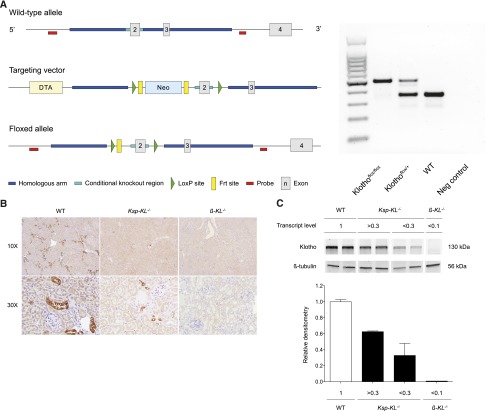
The targeting vector of floxed Klotho mice and genotyping results are shown in Figure 1A. To obtain the desired Klotho deletion, we used Ksp-cadherin-Cre mice, which express Cre exclusively in tubular epithelial cells in the mature and developing kidney and in the developing genitourinary tract.18 A partial deletion of renal Klotho was confirmed with immunohistochemistry (Figure 1B). The relative level of remnant median Klotho transcripts in 15 screened kidney homogenates was 0.69 (range, 0.26–1.0) compared with wild-type controls. Protein levels of Klotho quantified by Western blotting correlated highly to transcript levels (Figure 1C).
Figure 1.
Generation of floxed Klotho allele and targeted deletion of Klotho in Ksp-KL−/− and β-KL−/− mice. (A) Left panel shows schematic representation of wild-type allele (top), targeting vector (middle), and floxed allele with deleted Neo cassette (bottom). LoxP sites are flanking exon 2, thus enabling targeted deletion of the Klotho gene by Cre recombination. Right panel shows genotyping of mice. Representative PCR products from Klothoflox/flox (0.47 kB), Klothoflox/+ (0.47 and 0.37 kB), and wild-type (0.37 kB) mice. (B) Immunohistochemical staining of kidneys revealed partial deletion of Klotho in Ksp-KL−/− mice, and complete deletion of Klotho in β-KL−/− mice. (C) Western blotting of whole kidney extracts from wild-type, Ksp-KL−/−, and β-KL−/− mice. Numbers indicate relative transcript levels of Klotho measured by real-time qPCR, and for Ksp-KL−/− these were arbitrarily categorized in separate groups based on degree on the efficacy of Klotho deletion. Klotho protein level quantified by Western blotting correlated highly to its transcript level.
Gross Phenotype of Adult Ksp-KL−/− Mice
Ksp-KL−/− mice were viable, fertile, and did not differ in size or display any gross physical or behavioral abnormalities (Figure 2). There was no correlation between residual Klotho expression and body size.
Figure 2.
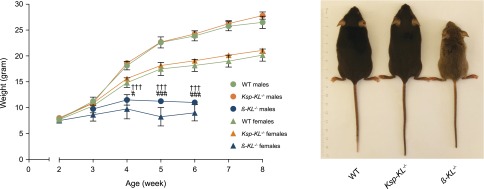
Weight and gross appearance of Ksp-KL−/− and β-KL−/− mice. (Left panel) Ksp-KL−/− mice did not differ in body weight compared with wild-type controls. Conversely, β-KL−/− mice were markedly smaller than wild-type littermates already at 4 weeks of age. (Right panel) Ksp-KL−/− mice were viable, fertile, and had a normal gross phenotype. In contrast, β-KL−/− mice displayed severe growth retardation, kyphosis, and a reduced life span with spontaneous deaths occurring around 7 weeks of age. †††Wild-type versus β-KL−/− males; #Wild-type versus β-KL−/− females. #P<0.05; †††###P<0.001.
Generation of β-KL−/− Mice
To confirm functionality of the floxed Klotho allele, we generated a global deletion of Klotho (β-KL−/−) using mice expressing Cre under the control of the human β-actin promoter. In stark contrast to Ksp-KL−/− mice, β-KL−/− mice recapitulated the phenotype of existing Klotho null mice,1 including severe growth retardation, kyphosis, lessened activity, and significantly reduced life span (Figure 2). In agreement, β-KL−/− mice (n=2, mean ± SEM) were hyperphosphatemic (5.3±0.06 mmol/L), hypercalcemic (2.80±0.06 mmol/L), with extremely elevated FGF23 levels (234,630±30,000 pg/ml) despite normal serum creatinine (44.8±1.9 μmol/L).
Biochemistries of Ksp-KL−/− Mice
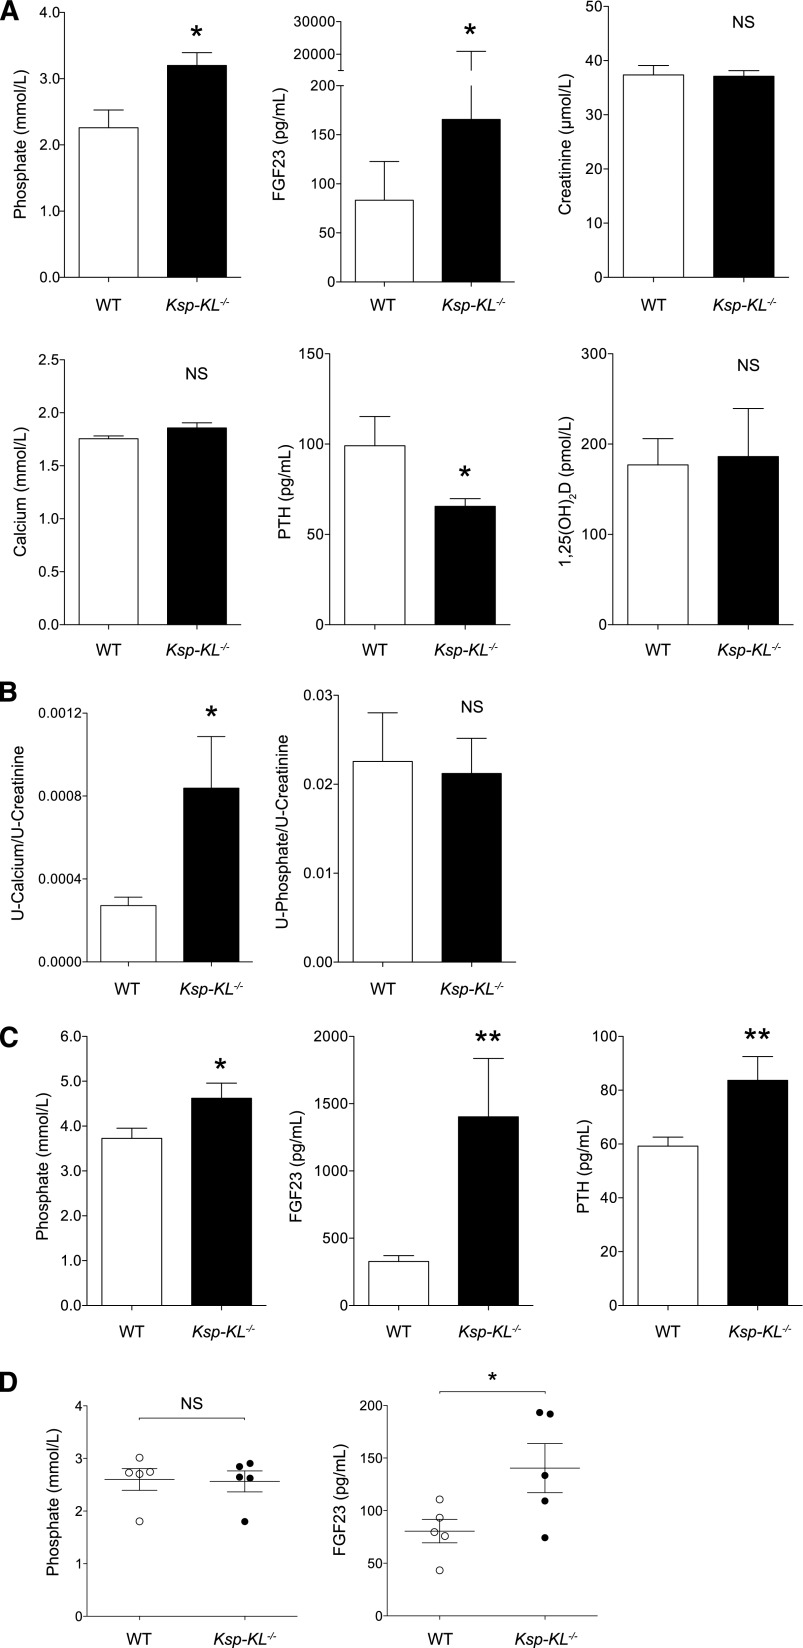
Serum biochemistries were examined in adult mice at 8 weeks of age (Figure 3A). Ksp-KL−/− mice were hyperphosphatemic with elevated FGF23. Parathyroid hormone (PTH) was decreased in Ksp-KL−/− mice, whereas 1,25(OH)2D, calcium, and creatinine levels were unaltered. Urinary calcium excretion was significantly increased as determined by calcium/creatinine ratio (Figure 3B) and fractional excretion of calcium (1.82 versus 0.67; P<0.05), but no difference was found in urinary phosphate/creatinine ratio (Figure 3B) or fractional excretion of phosphate (28.4 versus 35.0; P=0.44).
Figure 3.
Serum and urine biochemistry in adult Ksp-KL−/− mice. (A) At 8 weeks of age, Ksp-KL−/− mice displayed hyperphosphatemia and elevated FGF23 levels. Conversely, serum PTH was lower in Ksp-KL−/− mice than in controls. Calcium, creatinine, and 1,25(OH)2D were similar in the two groups (*P<0.05; n=10 in each group for all analysis except 1,25(OH)2D where n≥5). (B) Analysis of urine biochemistry revealed hypercalciuria in Ksp-KL−/− mice. Urinary phosphate excretion was unchanged (*P<0.05; n=9–10 per group). (C) Serum biochemistry in Ksp-KL−/− and wild-type mice on a high phosphate diet (1.65% phosphate for 10 days). Both groups developed hyperphosphatemia and elevated FGF23, although more pronounced in Ksp-KL−/− mice. Ksp-KL−/− mice on a high phosphate diet had higher serum PTH than wild-type controls (*P<0.05; **P<0.01; n≥5 per group). (D) In a subgroup analysis of Ksp-KL−/− and wild-type mice with matched serum phosphate levels (2.56 versus 2.60 mmol/L; P=0.90; n=5 in each group), FGF23 was significantly higher in Ksp-KL−/− mice (140.4 versus 80.6 pg/ml; P<0.05).
Ksp-KL−/− Mice and Dietary Phosphate Loading
Serum biochemistries of 8-week-old Ksp-KL−/− and wild-type mice challenged with a high phosphate diet are shown in Figure 3C. Both groups developed hyperphosphatemia, albeit more pronounced in Ksp-KL−/− mice. The FGF23 response to phosphate loading was accentuated in Ksp-KL−/− mice. Ksp-KL−/− mice had higher PTH, contrasting the reduced PTH level when fed a regular diet (Figure 3A). In linear regression analysis, phosphate was the only assessed biochemical parameter that correlated to FGF23 in mice on a regular diet (r2=0.29; P<0.01), whereas phosphate (r2=0.29, P<0.05) and PTH (r2=0.41, P<0.005) correlated with FGF23 in mice on a high phosphate diet.
Comparison of Ksp-KL−/− and Wild-Type Mice with Matched Serum Phosphate Levels
In this subgroup analysis, Ksp-KL−/− mice had significantly higher FGF23 despite similar phosphate values (Figure 3D). No differences in calcium, phosphate, PTH, 1,25(OH)2D, or creatinine were noted (Table 1). In the same mice, transcript level of Cyp27B1 was increased (P<0.001) with a similar trend for Cyp24A1 (P=0.08).
Table 1.
Serum biochemistry and gene expression in wild-type and Ksp-KL−/− mice with matched serum phosphate levels
| Parameters | WT (n=5) | Ksp-KL−/− (n=5) | P Value |
|---|---|---|---|
| Serum biochemistries | |||
| FGF23 (pg/mL) | 79.6 (43.3–110–7) | 133.5 (74.3–193.3) | <0.05 |
| Phosphate (mmol/L) | 2.73 (1.81–3.02) | 2.65 (1.80–2.91) | 0.90 |
| Calcium (mmol/L) | 1.76 (1.70–1.89) | 1.80 (1.67–1.92) | 0.80 |
| PTH (pg/mL) | 78.4 (65.8–93.0) | 79.4 (67.8–185.1) | 0.26 |
| 1,25(OH)2D (pmol/L) | 132.2 (102.0–204.9) | 215.3 (115.3–382.4) | 0.34 |
| Creatinine (μmol/L) | 36.0 (28.5–40.5) | 39.0 (36.0–44.5) | 0.20 |
| Gene expression | |||
| Klotho | 1.12 (0.86–1.17) | 0.83 (0.51–1.13) | 0.13 |
| Cyp27B1 | 1.00 (0.44–1.38) | 2.45 (1.64–2.76) | <0.001 |
| Cyp24A1 | 0.73 (0.27–2.36) | 2.32 (1.02–3.60) | 0.08 |
| VDR | 0.97 (0.69–1.39) | 1.21 (0.85–1.57) | 0.45 |
| Npt2a | 1.01 (0.67–1.35) | 0.98 (0.79–1.11) | 0.63 |
| Npt2c | 1.01 (0.53–1.79) | 0.82 (0.78–1.45) | 0.86 |
| FGFR1 | 1.06 (0.91–1.16) | 1.02 (0.74–1.34) | 0.73 |
| CaSR | 0.97 (0.62–1.33) | 0.87 (0.53–1.40) | 0.86 |
| TRPV5 | 0.98 (0.79–1.54) | 0.94 (0.75–1.21) | 0.72 |
FGF23 was the only serum variable differing between wild-type and Ksp-KL−/− mice in a subgroup analysis of mice with matched serum phosphate levels. In gene expression analysis, there was a marked increase of Cyp27B1 in the Ksp-KL−/− mice. Values are median (interquartile range).
Serum Biochemistries as a Function of Residual Klotho Expression
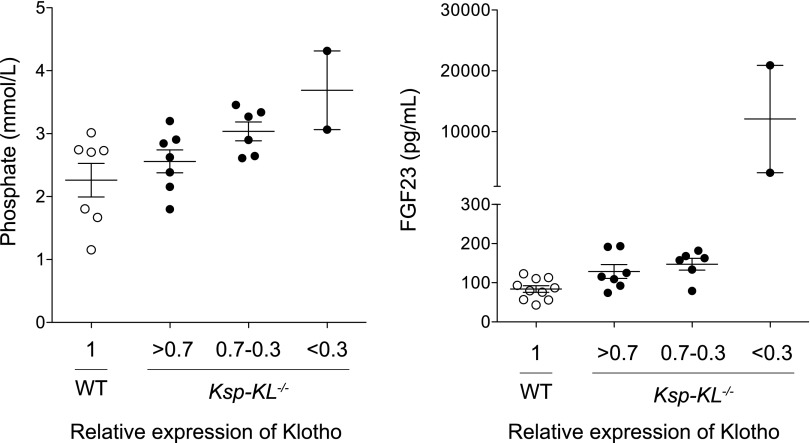
Because Klotho was deleted with variable efficacy, we analyzed the Klotho transcript level as a continuous variable. FGF23 was the only serum parameter significantly correlating to Klotho (r2=0.23; P<0.05), whereas no correlations were found for phosphate (P=0.09), calcium (P=0.13), PTH (P=0.13), or 1,25(OH)2D (P=0.72). To determine possible threshold effects, we screened 15 Ksp-KL−/− mice and arbitrarily categorized them into the following three groups based on their residual Klotho level: Klotho level >70% of wild-type counterparts (mean 88%; n=7); Klotho level of 30%–70% (mean 59%; n=6); and Klotho <30% (mean 28%; n=2). Phosphate and calcium levels gradually increased, whereas PTH levels decreased with lower Klotho expression (Table 2). In contrast, a marked threshold effect was established for FGF23 when relative Klotho expression was <30%, leading to levels 30–250 times higher than in wild-type mice (Figure 4).
Table 2.
Serum biochemistry as a function of residual Klotho expression
| Serum Biochemistries | WT (KL=1) | Ksp-KL−/− (KL >0.7) | Ksp-KL−/− (KL 0.7–0.3) | Ksp-KL−/− (KL <0.3) |
|---|---|---|---|---|
| FGF23 (pg/mL) | 83.3 (43.3–122.8) | 115.3 (74.3–193.3) | 160.4 (78.9–182.0) | 12,076 (3234–20,917) |
| Phosphate (mmol/L) | 2.71 (1.16–3.02) | 2.63 (1.80–3.20) | 3.09 (2.61–3.46) | 3.69 (3.07–4.32) |
| Calcium (mmol/L) | 1.74 (1.67–1.89) | 1.80 (1.67–1.92) | 1.86 (1.65–1.93) | 1.97 (1.84–2.10) |
| PTH (pg/mL) | 87.2 (65.8–188.9) | 76.5 (54.2–185.1) | 63.0 (53.2–79.4) | 55.2 (53.2–57.1) |
| 1,25(OH)2D (pmol/L) | 176.8 (102.0–168.9) | 134.8 (81.1–215.3) | 161.0 (66.5–382.4) | 130.9 (n=1) |
| Creatinine (μmol/L) | 39.5 (28.5–41.0) | 37.5 (33.5–44.5) | 37.3 (32.5–41.0) | 36.5 (34.5–38.5) |
In wild-type and Ksp-KL−/− mice, categorized into groups based on residual Klotho level, there was a gradual increase in serum FGF23, phosphate, and calcium levels and a reciprocal reduction in PTH level as Klotho expression declined.
Figure 4.
Serum phosphate and FGF23 as a function of renal Klotho expression. Klotho transcript levels were normalized to 1 in wild-type mice, and Ksp-KL−/− mice were arbitrarily divided into three groups based on relative Klotho level: >0.7 (mean level 0.88; n=7); 0.30–0.7 (mean 0.59; n=6); and <0.3 (mean 0.28; n=2). Serum phosphate level increased linearly after the decreased Klotho expression. In contrast, a threshold was found for FGF23 when relative Klotho expression was below 0.3, leading to levels 30–250 times higher than in control mice.
Histology
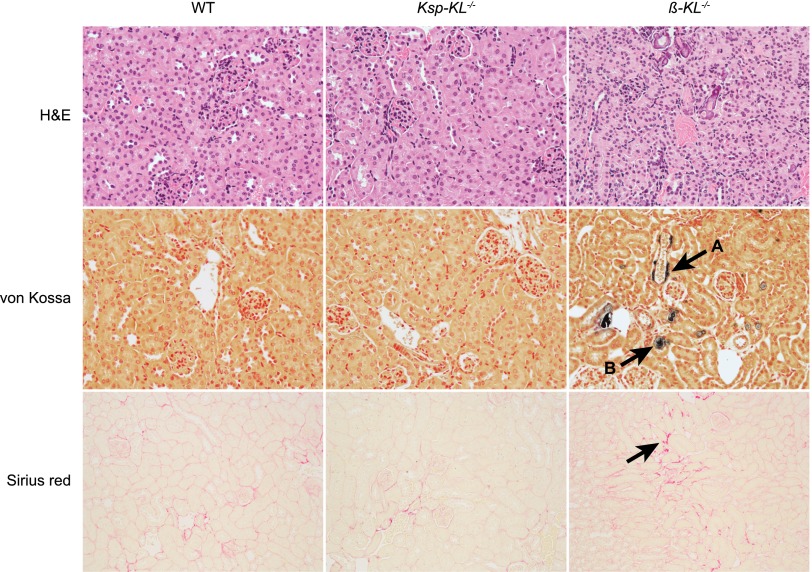
No differences were found with regard to general renal morphology, calcifications, or fibrosis in Ksp-KL−/− mice (Figure 5). The parathyroid glands were grossly normal with similar Klotho expression as in wild-type mice (data not shown). In contrast, β-KL−/− mice had reduced kidney size and cortex height, higher cell density, extensive vascular and tubular calcifications, and slightly increased fibrosis compared with wild-type mice (Figure 5).
Figure 5.
Renal histology in Ksp-KL−/− and β-KL−/− mice. Hematoxylin and eosin staining (top) showed a normal renal morphology in Ksp-KL−/− mice contrasting β-KL−/− mice, which had reduced cortex height and higher cell density. In von Kossa staining (middle), β-KL−/− mice displayed vascular and tubular calcifications (arrows A and B, respectively). No calcifications were seen in wild-type or Ksp-KL−/− mice. A subtle increase in fibrosis was noted in kidneys from β-KL−/− mice when stained with Sirius red for collagen (bottom). Sirius red staining was similar in Ksp-KL−/− mice and wild-type littermates. Number of kidneys examined was n=5 (wild-type); n=6 (Ksp-KL−/−); n=2 (β-KL−/−).
Renal Protein Expression
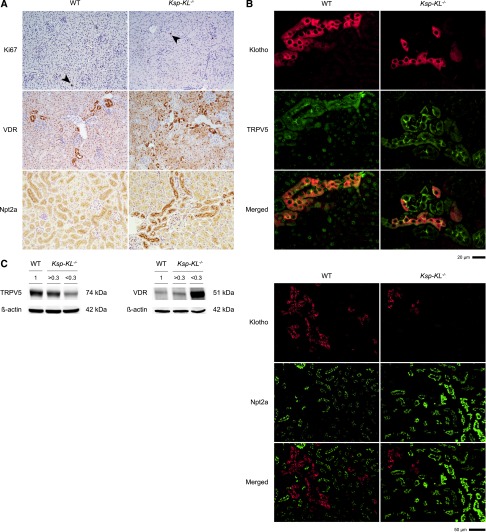
Immunohistochemical analysis revealed abundant expression of Npt2a at the brush border membrane in Ksp-KL−/− mice compared with wild-type controls. The vitamin D receptor (VDR) had a more heterogeneous pattern in Ksp-KL−/− mice. There was no difference in cell proliferation rate as determined by Ki67 index (1.0% versus 0.95%; P=0.66; n≥5 of each genotype) (Figure 6A).
Figure 6.
Renal protein expression of Ki67, VDR, TRPV5 and Npt2a in Ksp-KL−/− mice. (A) Proliferation rate as determined by immunostaining for Ki67 did not differ between Ksp-KL−/− and wild-type mice (top) (1.0% versus 0.95%; P=0.66). Staining for VDR (middle) revealed a more heterogeneous expression pattern in Ksp-KL−/− mice compared with wild-type littermates. Npt2a protein was abundantly expressed at the brush border membrane in Ksp-KL−/− mice compared with wild-type controls (bottom). Number of kidneys examined was n=5 (wild-type); n=6 (Ksp-KL−/−); n=2 (β-KL−/−). (B) Dual immunofluorescence staining for Klotho and the distal tubuli specific marker TRPV5 revealed complete colocalization in wild-type mice, and partial colocalization in Ksp-KL−/− mice. There was no apparent difference in TRPV5 staining intensity between distal segments with or without Klotho expression. Klotho was only weakly expressed in the proximal tubuli, and dual immunofluorescence staining for Klotho and the proximal tubuli specific marker Npt2a showed almost no colocalization. Npt2a expression at the brush border membrane was markedly higher in Ksp-KL−/− mice compared with wild-type controls. (C) Western blotting of whole kidney extracts from wild-type and Ksp-KL−/− mice revealed a gradual decrease of TRPV5 (left panel), whereas VDR protein (right panel) level increased with declining Klotho level. Original magnification, ×40 in top panel of B; ×10 in bottom panel of B.
Dual immunofluorescence staining in wild-type mice showed that Klotho predominantly colocalized with the distal tubuli marker TRPV5, and very weakly with the proximal marker Npt2a. A similar pattern of residual Klotho protein was found in Ksp-KL−/− mice. The signal intensity of Klotho in the proximal tubuli appeared unaltered in Ksp-KL−/− compared with wild-type mice, confirming a distal rather than proximal deletion of Klotho (Figure 6B).
Western blotting showed increased VDR and decreased TRPV5 protein in Ksp-KL−/− mice (Figure 6C). However, immunostaining did not show a cell-specific downregulation of TRPV5 in the tubular segments where Klotho was deleted (Figure 6B).
Renal Gene Expression
Transcript level of renal Cyp27B1 was increased in Ksp-KL−/− mice, whereas VDR, Npt2a, Npt2c, FGFR1, CaSR, and TRPV5 were unaltered (Table 3). Significant correlations were found between Klotho and Cyp27B1, VDR, Npt2a, and FGFR1 (Figure 7A). Renal transcript levels of mice challenged with a high phosphate diet are also shown in Table 3. Similarly, Cyp27B1 expression was higher in Ksp-KL−/− mice whereas VDR, Npt2a, and CaSR were reduced. The correlations between Klotho to VDR and Npt2a were strengthened by dietary phosphate loading (Figure 7B).
Table 3.
Renal gene expression in Ksp-KL−/− mice on a regular and high phosphate diet
| Gene Transcript | Regular Diet | High Phosphate Diet | ||||
|---|---|---|---|---|---|---|
| WT | Ksp-KL−/− | P Value | WT | Ksp-KL−/− | P Value | |
| Klotho | 1±0.06 | 0.51±0.06 | <0.0001 | 1±0.08 | 0.56±0.06 | <0.001 |
| Cyp27B1 | 1±0.13 | 4.03±0.78 | <0.01 | 1±0.29 | 3.77±0.86 | <0.01 |
| Cyp24A1 | 1±0.26 | 5.20±2.24 | 0.10 | 1±0.20 | 0.93±0.43 | 0.87 |
| VDR | 1±0.10 | 0.86±0.05 | 0.23 | 1±0.10 | 0.57±0.07 | <0.01 |
| Npt2a | 1±0.08 | 0.81±0.09 | 0.14 | 1±0.06 | 0.48±0.06 | <0.0001 |
| Npt2c | 1±0.16 | 0.95±0.22 | 0.85 | 1±0.20 | 0.95±14 | 0.87 |
| FGFR1 | 1±0.05 | 0.84±0.11 | 0.21 | 1±0.06 | 0.84±0.04 | 0.07 |
| CaSR | 1±0.11 | 0.95±0.14 | 0.78 | 1±0.07 | 0.73±0.06 | <0.05 |
| TRPV5 | 1±0.10 | 1.10±0.11 | 0.51 | 1±0.07 | 1.00±0.09 | 0.97 |
Data are mean ± SD. Transcript level of Cyp27B1 was significantly higher in Ksp-KL−/− mice on a regular diet. Cyp27B1, VDR, Npt2a, and CaSR were significantly changed in Ksp-KL−/− mice on a high phosphate diet in Ksp-KL−/− mice.
Figure 7.
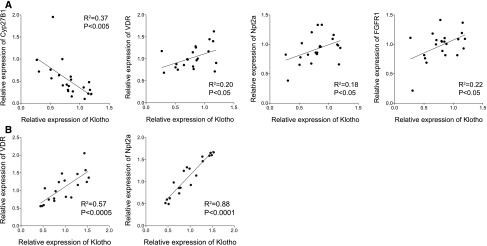
Gene expression in kidneys of Ksp-KL−/− mice. (A) Klotho transcript level correlated significantly to Cyp27B1, VDR, Npt2a, and FGFR1. (B) The correlations between Klotho, VDR, and Npt2a were accentuated in mice on a high phosphate diet.
Discussion
We present a novel mouse model (Ksp-KL−/−) harboring a partial deletion of Klotho predominantly in distal tubular segments of the kidney, demonstrating a pivotal role of Klotho in regulation of mineral metabolism. Ksp-KL−/− mice provide additional valuable information compared with general Klotho null mice. First, the variable efficacy of Klotho deletion allowed testing for potential dose-dependent effects, revealing a graded increase in serum phosphate and FGF23 levels with lower Klotho levels, corroborating with the established phosphaturic action of FGF23-Klotho. There was also a trend toward an increase in serum calcium level that paralleled the Klotho reduction. The reason for this remains unclear, especially given that fractional excretion of calcium was increased and PTH somewhat lower in Ksp-KL−/− compared with wild-type mice. One explanation may be a functional increase in VDR signaling because VDR protein was quantitatively increased in the face of an unaltered systemic 1,25(OH)2D level. We also found it rather surprising that the 1,25(OH)2D level remained normal given that FGF23-Klotho signaling is a counter-regulatory hormone system for 1,25(OH)2D. Mechanistically, there was an increase in Cyp27B1 and a borderline significant increase in Cyp24A1 at the transcript level, which presumably translates into both an increased synthesis and degradation of active vitamin D. The rise in Cyp27B1 is in agreement with attenuated FGF23-Klotho signaling, whereas the rise in Cyp24A1 contradicts the established physiology of FGF23. The exact cause remains elusive but may speculatively be due to differences in distal versus proximal tubuli signaling of FGF23-Klotho.
The combination of hyperphosphatemia and high FGF23 levels in Ksp-KL−/− mice strongly indicates a partial renal FGF23 resistance, supported by the fact that FGF23 was the only biochemical variable related to Klotho expression and the observed exponential increase in FGF23 when renal Klotho drop below approximately 30% of normal levels. Although not entirely surprising, this is an important in vivo proof of principle suggesting that initial onset of FGF23-Klotho dysregulation in CKD at least in part could be attributed to a renal FGF23 resistance. It may also explain the large interindividual FGF23 variation observed in ESRD patients,16 which simply cannot be attributed to differences in the circulating mineral metabolites. However, this study is clearly limited in terms of investigating the dynamics of FGF23-Klotho in early CKD, and this important question should be addressed in future studies.
A fundamental question is how a renal FGF23 resistance due to Klotho deficiency translates into increased FGF23 production in bone. Secondary changes in mineral metabolism, including hyperphosphatemia, are plausible. Indeed, we found a gradual rise in serum phosphate and FGF23 with declining Klotho levels, and dietary phosphate loading further increased FGF23. However, FGF23 was higher in Ksp-KL−/− mice compared with wild-type mice with similar serum phosphate levels, suggesting that additional mechanisms are present. Speculatively, soluble Klotho may antagonize FGF receptor signaling in bone, which has been implied as an important transcriptional regulator of FGF23,19 or interact with other yet unidentified FGF23 regulatory elements. These possibilities need to be explored in additional experimental studies.
In contrast to general Klotho null mice, Ksp-KL−/− mice had a normal growth development and did not differ in body size compared with wild-type littermates. This contradicts that renal Klotho insufficiency causes systemic toxicity, although it may also be explained by the incomplete knockout efficacy (i.e., the residual Klotho amounts are sufficient to maintain a normal growth status and body weight). Similarly, the biochemical abnormalities in Ksp-KL−/− mice may be too subtle to evoke systemic toxicity as in general Klotho null mice, favored by previous studies showing that a low calcium- and phosphate-containing rescue diet attenuates the phenotype in animal models of absent FGF23-Klotho signaling11
Another distinct difference compared with general Klotho null mice is the absence of overt renal abnormalities such as interstitial fibrosis and ectopic calcifications in Ksp-KL−/− mice. This was unexpected given that Klotho has been implicated as an antifibrotic agent by blocking TGF-β signaling20 and by acting as an endogenous inhibitor of vascular calcification.15 This argues against dominant cell-specific autocrine or paracrine effects of renal tubular Klotho, at least in the short term. Additional long-term studies are warranted to determine whether renal-specific Klotho deletion affects these phenotypes, especially in CKD.
Both FGF23 and PTH are phosphaturic hormones, acting on the same phosphate transporters in the kidney, namely Npt2a and Npt2c.7,21,22 In the face of hyperphosphatemia, serum PTH was suppressed, whereas FGF23 was increased in Ksp-KL−/− mice on a regular diet, suggesting that FGF23 may either respond earlier or play a more dominant role than PTH in regulating phosphate transport during chronic hyperphosphatemia. The reduction in PTH found in Ksp-KL−/− mice could could either be caused by higher systemic calcium levels or the fact that FGF23 inhibits PTH synthesis and secretion by directly targeting the parathyroid glands.23,24 In contrast, Ksp-KL−/− mice challenged with a high-phosphate diet had higher PTH than wild-type littermates. The underlying mechanisms remain unclear. One possibility is that parathyroid Klotho expression is differentially regulated in Ksp-KL−/− mice and that dietary phosphate loading evokes a Klotho-dependent parathyroid FGF23 resistance. Irrespectively, this phenomenon may represent a rescue mechanism against phosphate toxicity when FGF23 signaling is inappropriately low in relation to the degree of phosphate challenge.
The proximal tubule is the principal site for renal phosphate reabsorption.22 In agreement with a previous report, we found that Klotho expression is largely confined to the distal tubules3 and that the Cre recombination driven by the Ksp-cadherin promoter is functional mainly in distal tubular cells. Although immunofluorescence staining suggested a low Klotho expression also in proximal segments, it is still likely that distal Klotho plays an important role in proximal phosphate transport.
Hyperphosphatemic Ksp-KL−/− mice had increased Npt2a protein expression at the brush-border membrane. In contrast, the Npt2a transcript level was positively correlated to the renal Klotho, indicating uncoupling of Npt2a transcription to translation. Because the observed reduction in the Npt2a transcript level is an adequate compensatory response to hyperphosphatemia, our data suggest that dismantling of renal FGF23-Klotho signaling may result in aberrant Npt2a protein processing or degradation rather than transcriptional dysregulation. A similar uncoupling, possibly an adaptive response, was observed for VDR.
Urinary calcium excretion was increased in Ksp-KL−/− mice consistent with the known action of renal Klotho from previous in vitro studies2 and the observed reduction in TRPV5 protein. In contrast, we did not detect any difference in urinary phosphate excretion despite hyperphosphatemia and increased abundance of Npt2a in Ksp-KL−/− mice. We speculate that this may be due to intermittent periods of hypophosphaturia that were not captured by our spot urinary analysis.
In summary, deletion of Klotho in distal tubular segments reveals a fundamental role of Klotho in renal homeostatic control of mineral metabolism and as a determinant of circulating FGF23.
Concise Methods
Generation of Kidney-Specific Klotho Knockout Mice
Mice with a kidney-specific Klotho deletion were generated using Cre-Lox recombination. Briefly, the sequence of mouse chromosome 5 was retrieved from the Ensembl database (http://www.ensembl.org). The RP23–434H9 BAC clone was used for generation of homology arms and the conditional knockout region of the targeting vector. The fragments were cloned in the LoxFtNwCD or pCR4.0 vector and electroporated into C57BL/6 embryonic stem cells. Male chimeras were generated and subsequently bred with wild-type females to generate Klotho-LoxP heterozygotes (Klothoflox/+). Klothoflox/+ were crossed with mice expressing Cre recombinase under the Ksp-cadherin promoter (B6.Cg-Tg(Cdh16-cre)91Igr/J; Jackson Laboratory, Bar Harbor, ME). Homozygous mice without Cre (Klothoflox/flox) served as wild-type controls. To minimize the intra-litter variability, mice were intercrossed, making 50% of the offspring kidney-specific Klotho null mice and 50% controls that were subsequently analyzed. Mice with a systemic Klotho deletion were generated using mice expressing Cre under the human β-actin promotor (FVB/N-Tg(ACTB-cre)2Mrt/J, Jackson Laboratory). Generation of the targeting vector, cloning, and electroporation into embryonic stem cells was carried out by Caliper Life Sciences (Hopkinton, MA).
Genotyping
Total DNA was extracted from tail biopsies using DirectPCR Lysis Reagent (Viagen, Los Angeles, CA). PCR amplification was carried out on a 2720 Thermal Cycler (Applied Biosystems, Carlsbad, CA) using HotStarTaq DNA Polymerase (Qiagen, Venlo, Netherlands). The PCR products were visualized on a 1% agarose gel with GelRed Nucleic Acid Gel Stain (Biotium, Hayward, CA). Sequences of the primers used for genotyping are listed in Supplemental Table 1.
Animal Housing
Mice were fed standard rodent chow (RM1; SDS, Essex, UK) containing 0.73% calcium and 0.52% phosphate. In the high phosphate experiment mice were fed a diet containing 1.0% calcium and 1.65% phosphate (TD.88345; Harlan Laboratories, Indianapolis, IN) for 10 days, starting at 8 weeks of age. Blood sampling was performed by tail vein incision at intermediate time points and by bleeding the axillary artery at sacrifice. All experiments were conducted in compliance with the guidelines of animal experiments at Karolinska Institutet and approved by the regional ethical board.
Biochemistries
Serum and urine calcium, phosphate, and creatinine were measured on a Konelab 20XTi (Thermo Scientific, Vantaa, Finland). Intact FGF23 was measured using an intact FGF23 ELISA kit (Kainos Laboratories, Tokyo, Japan). Serum PTH was measured using a Mouse Intact PTH ELISA kit (Immutopics, Carlsbad, CA) and serum 1,25(OH)2D using a RIA kit (IDS, Scottsdale, AZ). Fractional excretion of calcium and phosphate was calculated using the formula: [urine calcium or phosphate] × [serum creatinine] × 100/[urine creatinine] × [serum calcium or phosphate].
RNA Isolation, cDNA Synthesis, and Real-Time qPCR
Kidneys were homogenized using a TissueLyzer LT (Qiagen) and total RNA was extracted using E.Z.N.A. Total RNA Kit I (Omega Bio-tek, Norcross, GA). DNA was removed with E.Z.N.A. RNase-Free DNase Set (Omega Bio-tek). First-strand cDNA synthesis was carried out using the iScript cDNA Synthesis Kit (Bio-Rad, Hercules, CA). For real-time qPCR analysis, the CFX96 Real-Time PCR Detection System and iQ SYBR Green Supermix (Bio-Rad) were used. The relative gene expression was calculated with the 2-ΔΔ Cq method normalizing the gene of interest to β-actin in the same sample. Data are presented as relative fold-change compared with wild-type mice. Sequences of primers used are listed in Supplemental Table 1.
Immunohistochemistry and Immunofluorescence
Kidneys were dissected, fixed in 4% formalin overnight, and subsequently embedded in paraffin. Immunohistochemical analyses were performed according to standard protocols on 4-μm sections using the Vector ABC Reagent kit and developed with DAB substrate (Vector Laboratories). For immunofluorescence, Alexa Fluor conjugated secondary antibodies were used for visualization (Invitrogen, Carlsbad, CA, US). The primary antibodies used were rat monoclonal anti-Klotho (KM2076, kindly provided by Kyowa Hakko Kogyo Co. Ltd, Japan), mouse monoclonal anti-VDR (sc-13133; Santa Cruz Biotechnology, Santa Cruz, CA), rabbit monoclonal anti-Ki67 (SP6; Thermo Scientific, Fremont, CA), rabbit polyclonal anti-TRPV5 (SC-30187; Santa Cruz Biotechnology), and rabbit polyclonal anti-Npt2a (NPT27; Alpha Diagnostics, San Antonio, TX). Proliferation index (%) was calculated as Ki67 positive cells/total number of cells in at least four viewing fields (at ×20 magnification) from two sections of each assessed mouse.
Histology
Paraffin sections from wild-type, Ksp-KL−/−, and β-KL−/− kidneys were stained with hematoxylin and eosin, periodic acid–Schiff , von Kossa, and Sirius red according to standard histologic protocol. Sections were examined blinded by an experienced renal pathologist (A.W.). Glomeruli, tubuli, interstitium, and vessels were systematically evaluated for all samples.
Western Blotting
Kidney extracts were homogenized in PBS-TDS buffer (Sigma-Aldrich Co., St Louis, MO) using a Tissue Lyzer LT. Extracts were incubated on ice for 30 minutes, and centrifuged at 10,000 rpm for 10 minutes at 4°C. Supernatants were collected for further analysis. Protein quantification was carried out using a BCA protein assay kit (Thermo Scientific, Rockford, IL). Forty micrograms of protein was separated on a 7.5% SDS-PAGE and electrotransferred to a polyvinylidene fluoride membrane (Bio-Rad). After blocking with Casein blocking solution (Thermo Scientific), membranes were sequentially incubated with primary and secondary antibodies. Primary antibodies were anti-Klotho (KM2076), anti-VDR (sc-13133), anti-TRPV5 (SC-30187), and anti-β-tubulin (Santa Cruz). The secondary antibody was IRDyes 680LT (LI-COR Biosciences, Lincoln, NE). Visualization was carried out using the ODYSSEY Infrared imaging system (LI-COR Biosciences). The amount of Klotho protein was normalized to the amount of β-tubulin in each sample. Image studio 2.0 (LI-COR Biosciences) was used for densitometry and results are presented as arbitrary densitometric units.
Statistical Analyses
In comparisons between Ksp-KL−/− and wild-type mice, Ksp-KL−/− mice with relative Klotho levels >70% were excluded. In correlation tests, all mice were included. GraphPad Prism 5.0 software (GraphPad Software Inc, La Jolla, CA) was used for statistical analysis. Gaussian distribution was tested using the D’Agostino and Pearson omnibus normality test. Variables fulfilling the criteria for normal distribution were tested with the two-tailed t test. Non-normally distributed variables were compared using the Mann–Whitney test. Correlations were tested with linear regression analysis. P values <0.05 were considered statistically significant. A minimum of five mice of each genotype was analyzed in all experiments, unless otherwise stated.
Disclosures
T.E.L. served as a consultant and/or received honoraria from Genzyme, Sanofi-Aventis, Shire, Amgen, Abbott, Astellas, Fresenius, and AstraZeneca.
Supplementary Material
Acknowledgments
This study was funded by grants from the Swedish Foundation for Strategic Research, Swedish Research Council, Swedish Kidney Foundation, and Karolinska Institutet.
Footnotes
Published online ahead of print. Publication date available at www.jasn.org.
See related editorial, “Partial Answers from Partial Klotho Deficiency,” on pages 1599–1601.
This article contains supplemental material online at http://jasn.asnjournals.org/lookup/suppl/doi:10.1681/ASN.2012010048/-/DCSupplemental.
References
- 1.Kuro-o M, Matsumura Y, Aizawa H, Kawaguchi H, Suga T, Utsugi T, Ohyama Y, Kurabayashi M, Kaname T, Kume E, Iwasaki H, Iida A, Shiraki-Iida T, Nishikawa S, Nagai R, Nabeshima YI: Mutation of the mouse klotho gene leads to a syndrome resembling ageing. Nature 390: 45–51, 1997 [DOI] [PubMed] [Google Scholar]
- 2.Chang Q, Hoefs S, van der Kemp AW, Topala CN, Bindels RJ, Hoenderop JG: The beta-glucuronidase klotho hydrolyzes and activates the TRPV5 channel. Science 310: 490–493, 2005 [DOI] [PubMed] [Google Scholar]
- 3.Hu MC, Shi M, Zhang J, Pastor J, Nakatani T, Lanske B, Razzaque MS, Rosenblatt KP, Baum MG, Kuro-o M, Moe OW: Klotho: A novel phosphaturic substance acting as an autocrine enzyme in the renal proximal tubule. FASEB J 24: 3438–3450, 2010 [DOI] [PMC free article] [PubMed] [Google Scholar]
- 4.Urakawa I, Yamazaki Y, Shimada T, Iijima K, Hasegawa H, Okawa K, Fujita T, Fukumoto S, Yamashita T: Klotho converts canonical FGF receptor into a specific receptor for FGF23. Nature 444: 770–774, 2006 [DOI] [PubMed] [Google Scholar]
- 5.Larsson T, Marsell R, Schipani E, Ohlsson C, Ljunggren O, Tenenhouse HS, Jüppner H, Jonsson KB: Transgenic mice expressing fibroblast growth factor 23 under the control of the alpha1(I) collagen promoter exhibit growth retardation, osteomalacia, and disturbed phosphate homeostasis. Endocrinology 145: 3087–3094, 2004 [DOI] [PubMed] [Google Scholar]
- 6.Bai X, Miao D, Li J, Goltzman D, Karaplis AC: Transgenic mice overexpressing human fibroblast growth factor 23 (R176Q) delineate a putative role for parathyroid hormone in renal phosphate wasting disorders. Endocrinology 145: 5269–5279, 2004 [DOI] [PubMed] [Google Scholar]
- 7.Baum M, Schiavi S, Dwarakanath V, Quigley R: Effect of fibroblast growth factor-23 on phosphate transport in proximal tubules. Kidney Int 68: 1148–1153, 2005 [DOI] [PubMed] [Google Scholar]
- 8.Bai XY, Miao D, Goltzman D, Karaplis AC: The autosomal dominant hypophosphatemic rickets R176Q mutation in fibroblast growth factor 23 resists proteolytic cleavage and enhances in vivo biological potency. J Biol Chem 278: 9843–9849, 2003 [DOI] [PubMed] [Google Scholar]
- 9.Shimada T, Kakitani M, Yamazaki Y, Hasegawa H, Takeuchi Y, Fujita T, Fukumoto S, Tomizuka K, Yamashita T: Targeted ablation of Fgf23 demonstrates an essential physiological role of FGF23 in phosphate and vitamin D metabolism. J Clin Invest 113: 561–568, 2004 [DOI] [PMC free article] [PubMed] [Google Scholar]
- 10.Ohnishi M, Nakatani T, Lanske B, Razzaque MS: Reversal of mineral ion homeostasis and soft-tissue calcification of klotho knockout mice by deletion of vitamin D 1alpha-hydroxylase. Kidney Int 75: 1166–1172, 2009 [DOI] [PMC free article] [PubMed] [Google Scholar]
- 11.Ohnishi M, Razzaque MS: Dietary and genetic evidence for phosphate toxicity accelerating mammalian aging. FASEB J 24: 3562–3571, 2010 [DOI] [PMC free article] [PubMed] [Google Scholar]
- 12.Sitara D, Kim S, Razzaque MS, Bergwitz C, Taguchi T, Schüler C, Erben RG, Lanske B: Genetic evidence of serum phosphate-independent functions of FGF-23 on bone. PLoS Genet 4: e1000154, 2008 [DOI] [PMC free article] [PubMed] [Google Scholar]
- 13.Hesse M, Fröhlich LF, Zeitz U, Lanske B, Erben RG: Ablation of vitamin D signaling rescues bone, mineral, and glucose homeostasis in Fgf-23 deficient mice. Matrix Biol 26: 75–84, 2007 [DOI] [PubMed] [Google Scholar]
- 14.Larsson T, Nisbeth U, Ljunggren O, Jüppner H, Jonsson KB: Circulating concentration of FGF-23 increases as renal function declines in patients with chronic kidney disease, but does not change in response to variation in phosphate intake in healthy volunteers. Kidney Int 64: 2272–2279, 2003 [DOI] [PubMed] [Google Scholar]
- 15.Hu MC, Shi M, Zhang J, Quiñones H, Griffith C, Kuro-o M, Moe OW: Klotho deficiency causes vascular calcification in chronic kidney disease. J Am Soc Nephrol 22: 124–136, 2011 [DOI] [PMC free article] [PubMed] [Google Scholar]
- 16.Gutiérrez OM, Mannstadt M, Isakova T, Rauh-Hain JA, Tamez H, Shah A, Smith K, Lee H, Thadhani R, Jüppner H, Wolf M: Fibroblast growth factor 23 and mortality among patients undergoing hemodialysis. N Engl J Med 359: 584–592, 2008 [DOI] [PMC free article] [PubMed] [Google Scholar]
- 17.Isakova T, Xie H, Yang W, Xie D, Anderson AH, Scialla J, Wahl P, Gutiérrez OM, Steigerwalt S, He J, Schwartz S, Lo J, Ojo A, Sondheimer J, Hsu CY, Lash J, Leonard M, Kusek JW, Feldman HI, Wolf M; Chronic Renal Insufficiency Cohort (CRIC) Study Group: Fibroblast growth factor 23 and risks of mortality and end-stage renal disease in patients with chronic kidney disease. JAMA 305: 2432–2439, 2011 [DOI] [PMC free article] [PubMed] [Google Scholar]
- 18.Shao X, Somlo S, Igarashi P: Epithelial-specific Cre/lox recombination in the developing kidney and genitourinary tract. J Am Soc Nephrol 13: 1837–1846, 2002 [DOI] [PubMed] [Google Scholar]
- 19.Martin A, Liu S, David V, Li H, Karydis A, Feng JQ, Quarles LD: Bone proteins PHEX and DMP1 regulate fibroblastic growth factor Fgf23 expression in osteocytes through a common pathway involving FGF receptor (FGFR) signaling. FASEB J 25: 2551–2562, 2011 [DOI] [PMC free article] [PubMed] [Google Scholar]
- 20.Doi S, Zou Y, Togao O, Pastor JV, John GB, Wang L, Shiizaki K, Gotschall R, Schiavi S, Yorioka N, Takahashi M, Boothman DA, Kuro-o M: Klotho inhibits transforming growth factor-beta1 (TGF-beta1) signaling and suppresses renal fibrosis and cancer metastasis in mice. J Biol Chem 286: 8655–8665, 2011 [DOI] [PMC free article] [PubMed] [Google Scholar]
- 21.Shimada T, Hasegawa H, Yamazaki Y, Muto T, Hino R, Takeuchi Y, Fujita T, Nakahara K, Fukumoto S, Yamashita T: FGF-23 is a potent regulator of vitamin D metabolism and phosphate homeostasis. J Bone Miner Res 19: 429–435, 2004 [DOI] [PubMed] [Google Scholar]
- 22.Forster IC, Hernando N, Biber J, Murer H: Proximal tubular handling of phosphate: A molecular perspective. Kidney Int 70: 1548–1559, 2006 [DOI] [PubMed] [Google Scholar]
- 23.Krajisnik T, Björklund P, Marsell R, Ljunggren O, Akerström G, Jonsson KB, Westin G, Larsson TE: Fibroblast growth factor-23 regulates parathyroid hormone and 1alpha-hydroxylase expression in cultured bovine parathyroid cells. J Endocrinol 195: 125–131, 2007 [DOI] [PubMed] [Google Scholar]
- 24.Ben-Dov IZ, Galitzer H, Lavi-Moshayoff V, Goetz R, Kuro-o M, Mohammadi M, Sirkis R, Naveh-Many T, Silver J: The parathyroid is a target organ for FGF23 in rats. J Clin Invest 117: 4003–4008, 2007 [DOI] [PMC free article] [PubMed] [Google Scholar]
Associated Data
This section collects any data citations, data availability statements, or supplementary materials included in this article.


