

Abstract
Alzheimer's disease (AD) is the most common cause of dementia. Much is known concerning AD pathophysiology but our understanding of the disease at the systems level remains incomplete. Previous AD research has used resting-state functional connectivity magnetic resonance imaging (rs-fcMRI) to assess the integrity of functional networks within the brain. Most studies have focused on the default-mode network (DMN), a primary locus of AD pathology. However, other brain regions are inevitably affected with disease progression. We studied rs-fcMRI in five functionally defined brain networks within a large cohort of human participants of either gender (n = 510) that ranged in AD severity from unaffected [clinical dementia rating (CDR) 0] to very mild (CDR 0.5) to mild (CDR 1). We observed loss of correlations within not only the DMN but other networks at CDR 0.5. Within the salience network (SAL), increases were seen between CDR 0 and CDR 0.5. However, at CDR 1, all networks, including SAL, exhibited reduced correlations. Specific networks were preferentially affected at certain CDR stages. In addition, cross-network relations were consistently lost with increasing AD severity. Our results demonstrate that AD is associated with widespread loss of both intranetwork and internetwork correlations. These results provide insight into AD pathophysiology and reinforce an integrative view of the brain's functional organization.
Introduction
Alzheimer's disease (AD) is the most common cause of dementia. The pathological hallmarks of AD are accumulation of amyloid β (Aβ1–42) plaques and tau tangles (Blennow et al., 2006; Holtzman et al., 2011). The application of novel neuroimaging techniques may provide additional insight into AD pathophysiology.
Resting-state functional connectivity magnetic resonance imaging (rs-fcMRI) is a method that noninvasively assesses brain function (for review, see Zhang and Raichle, 2010). rs-fcMRI measures the temporal correlation of spontaneous fluctuations of the blood oxygen level-dependent (BOLD) signal between regions (Biswal et al., 1995). Correlated regions have been reproducibly classified into resting-state networks (RSNs) using both independent components analysis (Calhoun et al., 2001; Beckmann et al., 2005) and seed-based analysis (Damoiseaux et al., 2006; Shehzad et al., 2009). RSNs are of scientific interest because they recapitulate the topographies of task-related functional response (Beckmann et al., 2005; Smith et al., 2009). Importantly, rs-fcMRI eliminates performance confounds associated with task-based functional neuroimaging (Hyvärinen, 1999; Ewers et al., 2011). We used seed-based analysis, which affords straightforward comparison across groups.
The default-mode network (DMN), the RSN most active in the absence of task (Raichle et al., 2001; Macey et al., 2004), was the first network to be identified as affected by AD (Greicius et al., 2004). There is a compelling colocalization between DMN abnormalities and AD histopathology (Aβ1–42 deposition and atrophy) (Braak and Braak, 1991; Buckner et al., 2005, 2008; Bero et al., 2011; Drzezga et al., 2011). Moreover, the DMN is associated with episodic memory (Buckner, 2004; Cole et al., 2010), a cognitive domain impaired early in AD. Following the work of Greicius and colleagues (2004), additional resting state studies of AD have reported abnormalities in the DMN (Rombouts et al., 2005; Sorg et al., 2007; Hedden et al., 2009; Zhang et al., 2010; Jones et al., 2011). Further, DMN rs-fcMRI abnormalities increase with disease progression (Supekar et al., 2008; Sanz-Arigita et al., 2010; Zhang et al., 2010; Zhou et al., 2010; Agosta et al., 2011; Petrella et al., 2011).
Focal changes in DMN function occur early in AD. Eventually, however, the entire cortex becomes affected. However, the sequence of involvement of functional systems outside the DMN is not well known. Only a few rs-fcMRI studies have investigated the effects of AD in other RSNs (Wang et al., 2007; Zhou et al., 2008; Murphy et al., 2009; Agosta et al., 2011). rs-fcMRI studies of AD have found decreased graph-based connectivity measures across many RSNs (Supekar et al., 2008; Fox et al., 2009; Sanz-Arigita et al., 2010). Other studies have reported varied changes in rs-fcMRI between regions of interest (ROI) across RSNs (Wang et al., 2007; Agosta et al., 2011).
Here, we report a cross-sectional rs-fcMRI study of AD in a large cohort, assessing five RSNs as a function of disease stage. Our results demonstrate that widespread disturbances in RSNs are seen even in very mild [clinical dementia rating (CDR) 0.5] and mild (CDR 1) AD.
Materials and Methods
Patient characteristics.
Data were examined from 559 human participants of either sex enrolled in memory and aging studies at the Knight Alzheimer's Disease Research Center at Washington University in St. Louis. The Washington University in St. Louis Human Research Protection Office approved all procedures. Following informed consent, each participant had clinical examinations, neuropsychological performance testing, and neuroimaging studies.
Clinical examination.
Experienced clinicians conducted semistructured interviews with each participant and a knowledgeable collateral source. The CDR was used to determine the presence or absence of dementia and, if present, to stage its severity. CDR 0 indicates cognitive normality while a CDR 0.5 corresponds to very mild AD and CDR 1 specifies mild AD (Morris, 1993; Hagmann et al., 2008). All CDR > 0 participants had a clinical diagnosis of dementia of the Alzheimer's type in accordance with the National Institute of Neurological and Communicative Disorders and Stroke and the Alzheimer's Disease and Related Disorders Association (McKhann et al., 1984; Buckner et al., 2009; Sperling et al., 2009; Zuo et al., 2011).
Image acquisition.
Imaging was performed using a 3T Siemens scanner equipped with a standard 12-channel head coil. A high-resolution structural scan was acquired using a 3-D sagittal T1-weighted magnetization-prepared rapid gradient echo (MPRAGE; TE = 16 ms, TR = 2400 ms, TI = 1000 ms, flip angle = 8°, 256 × 256 acquisition matrix, 1 × 1 × 1 mm voxels]. The high-resolution MPRAGE was used for definitive atlas registration. High-resolution 2-D multislice oblique axial spin density/T2-weighted fast spin echo (FSE) structural images were acquired using slice tilts and positions computed by slice preregistration (TE = 455 ms, TR = 3200 ms, 256 × 256 acquisition matrix, 1 acquisition, 1 × 1 × 1 mm voxels). These T2-weighted FSE data were used in the rs-fcMRI atlas registration procedure. rs-fcMRI scans were collected using a gradient spin-echo sequence (TE = 27 ms, TR = 384 ms, field of view = 256 mm, flip angle = 90°, 4 mm isotropic voxels) sensitive to the BOLD contrast (T2* weighting). Complete brain coverage was obtained using 36 contiguous slices acquired parallel to the anterior commissure/posterior commissure plane. Two 6 min rs-fcMRI runs (164 volumes each) were acquired, during which participants were instructed to fixate on a visual cross-hair and not fall asleep.
Preprocessing of rs-fcMRI.
Initial preprocessing followed conventional methods as previously described (Shulman et al., 2010; Drzezga et al., 2011). Briefly, this included compensation for slice-dependent time shifts, elimination of systematic odd–even slice intensity differences due to interleaved acquisition, and rigid body correction for head movement within and across runs. rs-fcMRI data were intensity scaled (one multiplicative factor applied to all voxels of all frames within each run) to obtain a mode value of 1000 (Ojemann et al., 1997; Morris et al., 2001; Fagan et al., 2009). This scaling facilitated assessment of voxelwise variance for purposes of quality assurance but did not affect computed correlations. Atlas transformation was achieved by composition of affine transforms connecting the rs-fcMRI volumes with the T2-weighted and MPRAGE structural images. Head movement correction was included in a single resampling that generated a volumetric time-series in 3 mm3 atlas space.
Additional preprocessing in preparation for correlation mapping included the following: (1) spatial smoothing (6 mm full-width half-maximum Gaussian blur in each direction), (2) voxelwise removal of linear trends over each run, (3) temporal low-pass filtering that retained frequencies <0.1 Hz, and (4) reduction of spurious variance by regression of nuisance waveforms derived from head motion correction and extraction of the time series from regions (of noninterest) in white matter and CSF. This regression step included the time-series averaged over the whole brain (Buckner et al., 2005; Fox et al., 2009; Bero et al., 2011). A consequence of whole-brain signal regression is that all subsequently computed correlations are effectively partial correlations of first-order controlling for widely shared variance.
Quality assurance.
Particular care was taken to minimize the impact of head motion both at the individual and at the group levels. For each individual, the preprocessed rs-fcMRI data were passed through a procedure that detected frames (volumes) with excessively high whole-brain root mean squared (rms) signal change over time (Sheline et al., 2010; Smyser et al., 2010; Power et al., 2012; Van Dijk et al., 2012). These frames were subsequently excluded from rs-fcMRI assessments. The fraction of frames so excluded was <10% in each group (no significant effect of group as factor on fraction of frames removed). Overall, 10 individuals had a large proportion of high-noise frames (>25% frames identified as contaminated) and were therefore excluded from the analysis. Additional quality assurance (QA) measures included rms head displacement (in mm) derived from the motion-correction procedure and the voxelwise time series standard deviation averaged over the whole brain (de Calignon et al., 2012; Van Dijk et al., 2012). QA-based exclusion criteria were empirically determined with the objective of maximizing the number of included subjects while achieving QA parameter distribution equivalence across groups. Individuals (n = 39) with a mean preprocessed rs-fcMRI signal >2.5% SD (after nuisance regression) or rms movement exceeding 1.25 mm were also excluded. The mean rms movement before and after the removal of contaminated frames is shown in Table 1. There were no significant differences among groups in QA parameters (Table 1).
Table 1.
The mean (SD) rms of movement and standard deviation of the signal before (pre) and after (post) removal of contaminated frames that contained large amounts of movement
| rms pre | SD pre | Percentage of frames removed | rms post | SD post | |
|---|---|---|---|---|---|
| CDR 0 | 0.54 (0.23) | 0.11 (0.094) | 6.4 (4.9) | 0.48 (0.17) | 0.10 (0.081) |
| CDR 0.5 | 0.65 (0.34) | 0.17 (0.13) | 8.2 (4.3) | 0.56 (0.18) | 0.16 (0.11) |
| CDR 1 | 0.60 (0.28) | 0.20 (0.15) | 8.5 (4.6) | 0.52 (0.21) | 0.18 (0.12) |
The rms decreased after this procedure with differences not significantly affected by group membership.
Seed ROI definition.
Thirty-six spherical (6 mm radius) ROIs, originally representing seven RSNs, were derived by maximizing the topographic concordance between results obtained by seed-based correlation mapping and by spatial independent component analysis (ICA) (Beckmann et al., 2005; Fagan et al., 2009). The fastICA algorithm (Hyvärinen, 1999; Greicius et al., 2004; Sestieri et al., 2011) was implemented in MATLAB. rs-fcMRI data were analyzed from 17 healthy young adults acquired in a prior study (Greicius et al., 2004; Fox and Raichle, 2007; Sestieri et al., 2011). Following preprocessing and atlas transformation as described above, but omitting nuisance regression, spatial ICA was run on the rs-fcMRI data concatenated over all runs (4 runs that were 7 min in duration each) and subjects. Concurrently, correlation mapping was performed using initial seed coordinates taken from multiple sources (Table 2). Loci of matching peaks in the correlation maps and the ICA results were selected as ROI centers. To maximize comparison of certain features of our results compared with prior findings, four ROIs within the salience (SAL) network were taken directly from the literature (Shulman et al., 1997; Raichle et al., 2001; Greicius et al., 2004; Seeley et al., 2007; Zhou et al., 2010; Sestieri et al., 2011). Three originally separate RSNs corresponding to the primary auditory, primary visual, and somatomotor cortices were combined into a single sensory-motor network (SMN). Thus, a total of five RSN were analyzed and included: DMN, dorsal attention network (DAN), SAL, control (CON), and SMN (Fig. 1).
Table 2.
Regions, MNI coordinates, and sample of references supporting choice of ROIs
References included contain ROIs that are within the expanded seed ROIs used in this study.
Footnote symbols indicate network membership and correspond to colors in Figure 1.
aDMN.
bDAN.
cCON.
dSAL.
eSMN.
Figure 1.

Schematic representation of the 36 canonical expanded seed regions used for evaluating composite scores for five brain RSNs. Abbreviations and corresponding Montreal Neurological Institute (MNI) coordinates are listed in Table 2.
rs-fcMRI procedures.
Correlation maps were produced by extracting the time course from each of the 36 seed regions. The Pearson correlation coefficient (r) was computed between the time course from a seed region and all other brain voxels. Statistical tests of rs-fcMRI results were computed after application of Fisher's z transform (z = 0.5ln[(1 + r)/(1 − r)]). CDR group average images were computed by averaging individual correlation maps across subjects. Group difference significance maps were computed by a random-effects analysis of the Fisher z transformed correlation maps (voxelwise p < 0.001, uncorrected; cluster size = 5).
Statistical analysis.
To obtain quantitative results at the level of RSN node pairs, the group-averaged Fisher z-transformed correlation maps were sampled in areas surrounding the original seeds. These regions were obtained by thresholding the mean (z-transformed) correlation map averaged over groups (weighting each group equally) at a threshold of |z| = 0.3 and isolating the cluster of voxels surrounding each seed. Results using these expanded seed ROIs were qualitatively similar to, but considerably less noisy, than directly computing seed pair correlation matrices. The use of expanded seed ROIs also reduced the variance across individuals. This improvement in quantitative stability is understandable as the spatial extent of group differences in correlation maps is greater than the volume of the original seeds. All presently reported results concerning ROI pairs were obtained by evaluating z-transformed correlation maps within expanded seed ROIs. The values extracted from these expanded seed ROIs were subjected to one-way ANOVA (3 levels: CDR 0, 0.5, and 1). The p values were corrected for the false discovery rate (q = 0.05) and significant effects assessed with post hoc t tests between the CDR 0 versus CDR 0.5 and CDR 0.5 versus CDR 1 contrast levels (p < 0.05).
Inspection of these results suggested that correlations within and across RSNs were progressively lost with advancing AD stage. To perform statistical tests of these effects while avoiding sampling error at the level of node pairs, we computed individual subject composite scores for each network for each CDR stage. Thus, the composite DMN score for a subject k was computed as ckDMN = 〈zijk〉i, j ∈ DMN, where i and j refer to a ROI pair and 〈 〉 represents the mean across subjects. Similarly, ckX was computed as the average correlation within network X in subject k. A similar strategy was used to define cross-network composite scores. Thus, ckX,Y = 〈zijk〉i ∈ X, j ∈ Y was computed the average correlation between RSNs X and Y in subject k. This approach to statistical inference achieves data reduction and reduces the impact of sampling error across node pairs. However, this method potentially obscures focal phenomena. To assess statistical significance, the ck of all RSNs and RSN pairs was entered into one-way ANOVAs with CDR status as a factor. The resulting p values were Bonferroni corrected for five (within-network) and 10 (between-network) multiple comparisons, respectively. Significant effects were assessed by post hoc t tests of the CDR 0 versus CDR 0.5 and CDR 0.5 versus CDR 1 contrasts (p < 0.05).
Results
Demographics of participants
A total of 510 participants had acceptable neuroimaging studies following QA measures. The average age was 77 years with 47% of the participants being male; 386 were CDR 0, 91 were CDR 0.5, and 33 were CDR 1. No significant differences in age, education, or sex were present among the three groups (all p > 0.33). Mini-mental status exam (MMSE) scores were systematically lower with greater CDR stage (mean MMSE = 29 for CDR 0, 27 for CDR 0.5, and 20 for CDR 1).
Functional connectivity of the posterior cingulate cortex
Correlation maps generated using a seed in posterior cingulate cortex (PCC; 0, −51, 29) for each of the groups are shown in Figure 2, A–C. Correlation magnitude within the DMN and anticorrelations with other RSNs were systematically lower for higher CDR. The CDR 0–CDR 0.5 comparison (Fig. 2D) showed decreases in correlations between the PCC and medial prefrontal cortex (mPFC), inferior temporal cortex (iTMP), and lateral parietal cortex (LP), all nodes of the DMN. Reduced anticorrelations were seen in somatosensory, motor, and premotor regions bilaterally. These results suggest that decreases in functional connectivity with the PCC are detectable at the group level even at the earliest symptomatic disease stage (CDR 0.5). Similar, but more pronounced effects were evident in the CDR 0.5–CDR 1 comparison (Fig. 2E).
Figure 2.

rs-fcMRI maps using the PCC as a seed region projected onto a characteristic brain slice. A–C,C orrelations (orange and red) and anticorrelations (dark blue) with PCC are seen for CDR 0 (A) CDR 0.5 (B), and CDR 1 (C). Reduced correlations (less orange and red) and anticorrelations (blue) were seen with increasing disease severity. D, E, Random effects contrast of CDR 0 versus CDR 0.5 (p < 0.01; D) and CDR 0.5 versus CDR 1 (p < 0.01 (E).
To more thoroughly investigate the effects of disease severity within the DMN, we assessed correlations between the PCC and other DMN nodes. The z-transformed correlation for each seed–ROI pair was subjected to a one-way ANOVA for effect of CDR (Table 3). Each ANOVA yielded a p value that was false-discovery rate corrected at q = 0.05 (critical p = 0.02). Some but not all nodes of the DMN showed significant differences with higher CDR. Within these affected node pairings, several patterns associated with disease severity emerged. Between the PCC and mPFC, a reduction in correlation occurred between CDR 0 and CDR 0.5 but not between CDR 0.5 and CDR 1. This was in contrast to LP regions where correlations were preserved at early stages but decreased at CDR 1. Finally, within iTMP, correlation was systematically reduced at successively higher CDR stages. Correlations between the PCC and other nodes of the DMN (including thalamus and cerebellum) were not significantly affected by CDR stage, although a trend was observed.
Table 3.
Effect of CDR status on correlations between the PCC and DMN nodes
| PCC–X | ANOVA |
CDR 0* | t† | CDR 0.5* | t† | CDR 1* | |
|---|---|---|---|---|---|---|---|
| F | p | ||||||
| mPFC | 6.65 | 0.0014 | 0.21 | t = 3.30, p = 0.001, d = 0.42 | 0.16 | t = 0.12, p = 0.90, d = 0.07 | 0.16 |
| lLP | 1.16 | 0.32 | 0.26 | t = 0.45, p = 0.65 | 0.27 | t = 1.46, p = 0.15 | 0.23 |
| rLP | 4.4 | 0.013 | 0.21 | t = 0.021, p = 0.98, d = 0.02 | 0.21 | t = 2.73, p = 0.0073, d = 0.55 | 0.14 |
| liTMP | 8.68 | 0.00019 | 0.13 | t = 3.30, p = 0.001, d = 0.39 | 0.084 | t = 0.77, p = 0.45, d = −0.18 | 0.064 |
| riTMP | 3.93 | 0.0203 | 0.097 | t = 1.82, p = 0.069, d = 0.23 | 0.071 | t = 1.20, p = 0.23, d = 0.26 | 0.045 |
| mdTHAL | 0.28 | 0.76 | 0.08 | t = 0.29, p = 0.77 | 0.08 | t = 0.71, p = 0.48 | 0.066 |
| lpCBLM | 3.46 | 0.032 | 0.094 | t = 1.79, p = 0.075, d = 0.23 | 0.068 | t = 0.88, p = 0.38, d = 0.21 | 0.046 |
| rpCBLM | 2.27 | 0.1 | 0.096 | t = 1.60, p = 0.11 | 0.074 | t = 0.52, p = 0.61 | 0.062 |
*Mean z-transformed correlation values.
†Results of t test between CDR stages. Bold indicates significance (false-discovery rate corrected, q = 0.05). Effect size is reported as Cohen's d. See Figure 2 for abbreviations and coordinates.
All RSNs were affected with increasing AD severity
We next investigated the effects of AD severity across a wider set of expanded seed–ROI pairs (Table 2). Each network showed a distinctive pattern (Fig. 3). To assess the changes in all ROIs for all networks, 36 × 36 matrices were computed (Fig. 4). In Figure, 4 intranetwork correlations are arrayed in blocks along the diagonal; cross-network correlations appear in off-diagonal blocks. The CDR 0 matrix (Fig. 4A) shows positive correlations within each network and negative correlations between networks. The CDR 0.5 matrix (Fig. 4B) and, to an even greater extent, the CDR 1 matrix (Fig. 4C), show generally reduced correlations within networks as well as reduced anticorrelations between networks. The effects of higher CDR are displayed as difference matrices in Figure 4, D and E. For a majority of ROI pairs, the sign of the correlation difference (earlier stage minus later stage) matches the sign of the correlation itself. Thus, warm hues in Figure 4, D and E, predominantly indicate reduced positive correlations while cool hues predominantly indicate reduced anticorrelations.
Figure 3.
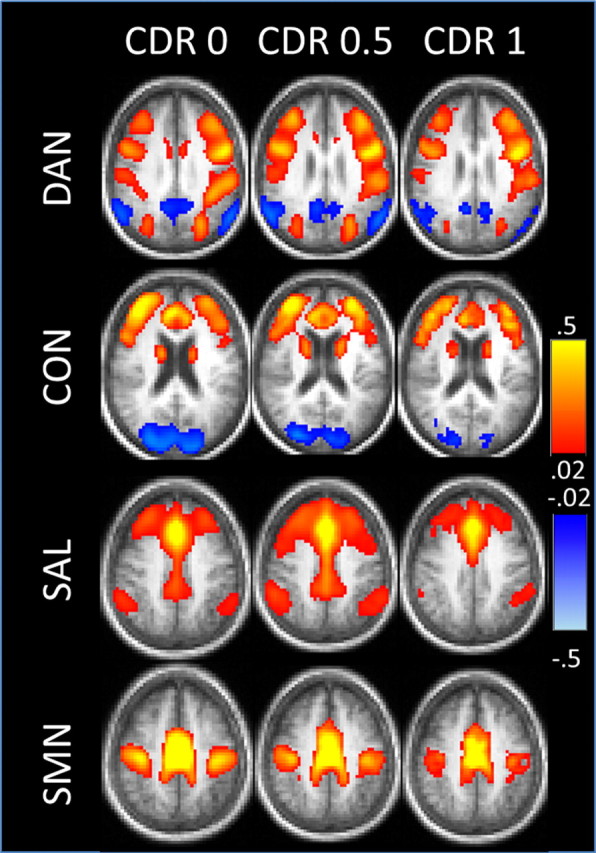
rs-fcMRI maps for each of the four non-DMN networks obtained in the CDR 0, CDR 0.5, and CDR 1 groups. Each row shows the correlation map obtained for a given network using a representative seed ROI. For these maps, the left MT+ was used as a seed region for the DAN; the dorsal mPFC for the CON; the dorsal anterior cingulate cortex for the SAL; and the supplementary motor area for the SMN.
Figure 4.
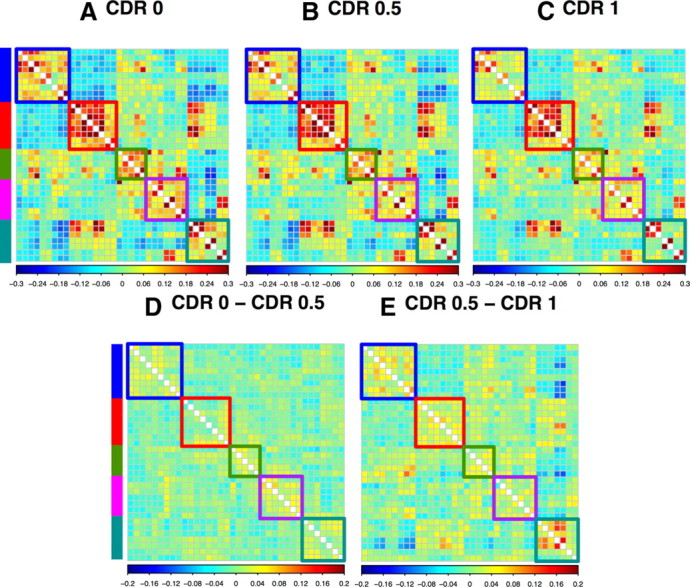
A–C, ROI pair correlation matrices for CDR 0 (A), CDR 0.5 (B), and CDR 1 (C). The ROIs are grouped by RSN. Intranetwork correlations appear on diagonal bocks; internetwork correlations appear in off-diagonal blocks. D, CDR 0 − CDR 0.5 difference matrix. E, CDR 0.5 − CDR 1 difference matrix. Colors denote network membership: blue, DMN; red, DAN; green, CON; purple, SAL; teal, SMN. Units are z-transformed correlation coefficients.
Intranetwork correlations versus CDR stage
As assessed by composite scores, all networks showed significant decreases with higher CDR stage, except for the SAL (Fig. 5A; Table 4). A slight but significant increase in the composite SAL score was seen between CDR 0 and CDR 0.5. All intranetwork composite scores were lower at CDR 1 compared with CDR 0.5. In particular, the SAL composite score was lower at CDR 1. This decrease was nearly significant when compared with CDR 0 (t(416) = 1.79, p = 0.07).
Figure 5.

Mean composite z scores for intranetworks and internetworks across CDR status. A, Mean composite scores for the five investigated networks. All network composite scores tended toward 0 with increasing disease severity. A transient increase in functional correlations was seen in the SAL between CDR 0 and CDR 0.5. Thick solid line, DMN; dashed line, DAN; dotted line, CON; dashed and dotted line, SAL; thin solid line, SMN. B, Mean composite scores for internetwork pairs that showed a significant effect of CDR. Note that the anticorrelations for three network pairs also tended to move toward 0. Solid line, DMN–DAN; dashed line, DMN–SMN; dotted line, CON–SMN. C, Mean composite scores for internetwork pairs that did not show a significant effect of CDR. Thick solid line, DMN–CON; thick dashed line, DMN–SAL; thick dotted line, DAN–CON; dashed and dotted line, DAN–SAL; thin solid line, DAN–SMN; thin dashed line, CON–SAL; thin dotted line, SAL–SMN.
Table 4.
Effect of CDR within individual RSNs
| RSN | ANOVA |
CDR 0* | t† | CDR 0.5* | t† | CDR 1* | |
|---|---|---|---|---|---|---|---|
| F | p | ||||||
| DMN | 14.049 | 0.0000012 | 0.17 | t = 2.59, p = 0.0099, d = 0.31 | 0.15 | t = 3.18, p = 0.0019, d = 0.66 | 0.13 |
| DAN | 4.13 | 0.017 | 0.24 | t = 0.44, p = 0.66, d = 0.07 | 0.23 | t = 2.18, p = 0.032, d = 0.46 | 0.2 |
| CON | 8.017 | 0.00037 | 0.24 | t = 2.26, p = 0.024, d = 0.29 | 0.22 | t = 1.91, p = 0.059, d = 0.37 | 0.19 |
| SAL | 2.14 | 0.14 | 0.17 | t = 2.70, p = 0.0071, d = −0.32 | 0.19 | t = 2.72, p = 0.0075, d = 0.58 | 0.15 |
| SMN | 14.86 | 0.00000053 | 0.22 | t = 2.15, p = 0.032, d = 0.28 | 0.21 | t = 3.80, p = 0.00022, d = 0.83 | 0.16 |
*Mean z-transformed correlation values.
†Results of t test between CDR stages. Bold indicated significance (p < 0.05, Bonferonni corrected). Effect size is reported as Cohen's d.
Internetwork correlations versus CDR stage
We next investigated cross-network composite scores across CDR stage (Table 5). A significant effect of CDR status was seen for the DMN–DAN, DMN–SMN, and CON–SMN pairs (Fig. 5B). In these three cases, anticorrelations were consistently weaker (trend toward 0) comparing CDR 1 to CDR 0.5 (Table 3). The other seven RSN pairs did not show significant difference between CDR status (Fig. 5C, Table 5). Of these, three were anticorrelated and four were positively correlated. It should be noted that, despite increases in SAL correlations at CDR 0.5, no increases were seen in internetwork composite scores involving the SAL at any stage.
Table 5.
Effect of CDR on RSN pairs
| RSN | ANOVA |
CDR 0* | t† | CDR 0.5* | t† | CDR 1* | |
|---|---|---|---|---|---|---|---|
| F | p | ||||||
| DMN–DAN | 8.52 | 0.00023 | −0.1 | t = 1.88, p = 0.060, d = −0.23 | −0.091 | t = 2.53, p = 0.013, d = −0.53 | −0.065 |
| DMN–CON | 3.068 | 0.047 | 0.043 | 0.056 | 0.037 | ||
| DMN–SAL | 0.51 | 0.48 | 0.0050 | 0.0035 | 0.00 | ||
| DMN–SMN | 9.62 | 0.000079 | −0.098 | t = 0.93, p = 0.35, d = 0.12 | −0.092 | t = 3.69, p = 0.0003, d = −0.81 | −0.058 |
| DAN–CON | 0.13 | 0.88 | 0.027 | 0.026 | 0.022 | ||
| DAN–SAL | 1.89 | 0.067 | −0.033 | −0.026 | −0.027 | ||
| DAN–SMN | 1.53 | 0.22 | 0.077 | 0.081 | 0.06 | ||
| CON–SAL | 0.12 | 0.73 | 0.038 | 0.043 | 0.029 | ||
| CON–SMN | 7.43 | 0.00066 | −0.095 | t = 1.34, p = 0.18, d = −0.16 | −0.085 | t = 2.62, p = 0.0098, d = −0.61 | −0.051 |
| SAL–SMN | 3.16 | 0.043 | −0.032 | −0.022 | −0.0081 | ||
*Mean z-transformed correlation values.
†Results of t test between CDR stages. Bold indicated significance (p < 0.05, Bonferonni corrected). Effect size is reported as Cohen's d.
Intranetwork correlations versus sum of box scores
The CDR is a clinically useful tool but is categorical rather than continuous. A better estimate of decline of resting state functional connectivity with increasing AD severity may be obtained by comparing composite scores using the sum of boxes (CDR-SB) (Morris et al., 2001). We performed an ANCOVA on CDR-SB versus RSN composite scores. In this analysis, we only included participants with a CDR-SB > 0 (i.e., only CDR 0.5 and CDR 1 subjects). We did not include subjects with a CDR-SB = 0 (i.e., subjects with a CDR of 0), as the large number of individuals within this group would impose a floor effect and violate the assumptions of most statistical tests. We modeled the direct effect of CDR-SB (i.e., the correlation between composite scores and CDR-SB across networks), the main effect of network (i.e., the difference in absolute magnitude differences in composite scores across different RSNs), and the interaction between network and CDR-SB (differences in the slope of the CDR-SB vs composite score relationship across networks; Fig. 6). The composite scores generally were significantly correlated with CDR-SB within RSNs (F(1,595) = 34, p < 0.0001); however, the slopes did not significantly vary across networks (F(4,595) = 1.39, p = 0.24).
Figure 6.

Scatter plots of mean composite z scores versus CDR-SB. Linear fit lines are shown. Both p and r values for each correlation are shown.
Analysis at the level of ROI pairs
Composite scores (Fig. 5) achieve data reduction but do not address potentially focal effects at the individual ROI pair level. To examine this question, we plotted correlation difference versus correlation mean (across CDRs) for all ROI pairs (Fig. 7). In this representation, lower positive correlation between ROI pairs in the more advanced CDR group appears in the top right quadrant while lower magnitude anticorrelation between ROI pairs (trend toward 0) appears in the bottom left quadrant. Similarly, greater positive correlations appear in the bottom right quadrant and greater magnitude anticorrelations appear in the top left quadrant. In the CDR 0.5 versus CDR 0 comparison (Fig. 7, left), systematically greater correlations were seen for ROI pairs within the SAL (blue) and DAN (red). This result is consistent with the RSN composite score analysis (Fig. 5A). The CDR 0.5 versus CDR 1 plot (Fig. 7, right) demonstrates no convincing evidence of greater correlation magnitude in any RSN at more advanced disease stage.
Figure 7.

Scatter plots of CDR stage-dependent correlation difference vs correlation mean. Left, CDR 0 and CDR 0.5. Right, CDR 0.5 and CDR 1. Red, DAN; blue, SAL; black, other RSNs. The bottom right quadrant shows positively correlated ROI pairs that are more correlated at more advanced CDR.
The points in Figure 7 cluster around a central tendency, but considerable variability is evident. To better understand this variability, we assessed CDR 0 versus CDR 0.5 and CDR 0.5 versus CDR 1 differences in individual ROI pairs within RSNs (Fig. 8). Figure 8 represents the same data in the same manner as Figure 7 except that the ROI pairs in each of the two comparisons are connected, and only within-network effects are plotted. The majority of trajectories are vertical and to the left. The vertical component of the trajectory indicates that the difference between CDR 0.5 and CDR 1 is larger than the difference between CDR 0 and CDR 0.5. The horizontal component indicates that the mean correlation value decreases with increasing CDR. Further, the trajectories of the individual ROI pairs parallel the trajectory of the composite scores. These results suggest that, within RSNs, the effect of higher CDR stage manifests approximately uniformly over ROI pairs.
Figure 8.

CDR stage-dependent correlation difference versus correlation mean. The plot axes are the same as in Figure 7 but ROI pairs are evaluated at CDR 0 and CDR 0.5 (empty circles) and at CDR 0.5 and CDR 1 (filled circles) and connected by lines. Network composite scores are represented by the larger symbols. Subscripts in the axis labels refer, respectively, to earlier and later CDR stages.
Discussion
Our principal finding is that cross-sectionally measured differences in intranetwork correlations were overwhelmingly in the direction of loss with advancing disease stage. Within the SAL, transient increases were observed between CDR 0 and CDR 0.5, but these effects were overtaken by significant losses at mild AD (CDR 1; Figs. 4–6). Loss of cross-network correlations was also observed predominantly in RSN pairs that were anticorrelated at CDR 0. These effects were overwhelmingly in the direction of reduced anticorrelation (movement to zero) with advancing CDR stage. Intranetwork and internetwork correlations declined at different rates. These results suggest that AD is characterized by widespread loss of RSN integrity throughout the brain, occurring in a particular spatial and temporal sequence. It has been suggested that the effects of AD may manifest focally in certain ROI pairs but not others. Our results suggest that functional connectivity changes approximately uniformly across ROI pairs within networks (Figs. 7, 8). Hence, composite scores capture the critical phenomenology.
To date, this is the largest rs-fcMRI study to assess the effects of AD severity on functional connectivity. Only participants with a probable diagnosis of AD were included in CDR > 0 groups. The large sample size enabled us to distinguish between three groups (CDR 0 vs CDR 0.5 and CDR 0.5 vs CDR 1). Stringent QA reduced the impact of head motion on rs-fcMRI results.
Our technique included global signal regression during preprocessing (Shulman et al., 1997; Raichle et al., 2001; Greicius et al., 2004; Seeley et al., 2007; Fox et al., 2009; Zhou et al., 2010; Sestieri et al., 2011). Algebraically, this is approximately equivalent to computing partial correlations treating the global signal as a nuisance regressor (Raichle et al., 2001; Alexander et al., 2002; Seeley et al., 2007; Hampson et al., 2010). Global signal regression effectively reduces nonneuronal physiological noise (Raichle et al., 2001; Alexander et al., 2002; Macey et al., 2004; Seeley et al., 2007). Concomitantly, negative correlations are markedly enhanced (de Zubicaray et al., 2001; Raichle et al., 2001; Dosenbach et al., 2007; Seeley et al., 2007; Fox et al., 2009). The merits of this strategy have been debated (for discussion, see Raichle et al., 2001; Johnson et al., 2002; Dosenbach et al., 2007; Seeley et al., 2007; Cole et al., 2010), but it is generally acknowledged that global signal regression enhances the spatial specificity of obtained results (Raichle et al., 2001; Johnson et al., 2002; Dosenbach et al., 2007; Seeley et al., 2007; Fox et al., 2009; Weissenbacher et al., 2009).
Loss of BOLD signal correlations within the DMN, as found here, is a well established finding in AD (Casey et al., 1998; Greicius et al., 2004; Rombouts et al., 2005; Fox et al., 2006; Sorg et al., 2007; Sylvester et al., 2007; Hedden et al., 2009). The principal novelty of our work is in extending these observations to other RSNs at two levels of disease severity. For each of five RSNs, we demonstrate reduced intranetwork correlations at CDR stage 1. Intranetwork effects were RSN-dependent. Most RSNs showed significant decreases in composite scores, relative to CDR 0, even at CDR 0.5, except for the DAN, which remained relatively spared, and the SAL, which showed a significant increase. These results are generally consistent with several other recent studies (Casey et al., 1998; Fox et al., 2006; Sylvester et al., 2007; Supekar et al., 2008; Sanz-Arigita et al., 2010; Zhou et al., 2010; Agosta et al., 2011).
Previous works have reported greater functional connectivity in the SAL of participants with mild dementia (primarily CDR 1) relative to controls (Büchel et al., 1998; Mazoyer et al., 2001; Fox et al., 2006; Dosenbach et al., 2007; Sylvester et al., 2009; Zhou et al., 2010). This discrepancy with respect to the present results may be related to the following differences in methodology. First, in the previous studies, an ICA analysis was performed, while this study used a seed-based approach. Second, a smaller sample was studied (n = 12 for CDR > 0 vs the present n = 124). Third, our studies applied greater stringency in the application of rs-fcMRI QA inclusion criteria.
Our work also demonstrates reduced anticorrelations in three specific internetwork relationships (DMN–DAN, DMN–SMN, CON–SMN). All three network pairs showed strong anticorrelations within CDR 0 subjects, which became progressively attenuated with increasing CDR. In particular, the DMN–DAN pair showed a nearly significant difference in the magnitude of the anticorrelations between CDR 0 and CDR 0.5, but all of these RSN pairs showed a significantly weaker anticorrelations at CDR 1 compared with CDR 0.5. We believe that these effects are not an artifact of signal processing. While it is true that whole-brain signal regression mandates that, for every decreasing positive correlation, there be increases in negative correlations (Büchel et al., 1998; Mazoyer et al., 2001; Fox et al., 2005, 2006; Dosenbach et al., 2007; Murphy et al., 2009; Sylvester et al., 2009), the topography of these differences is not constrained (for an extended discussion, see Fox et al., 2009).
Why these three network pairs were preferentially impacted in AD remains a question. We hypothesize that this result relates to the high level of anticorrelation at CDR 0 (Figs. 4C; 5B,C). Indeed, the three most highly anticorrelated RSN pairs demonstrated the greatest reduction in negative correlation with increasing AD severity. This result suggests that these anticorrelations reflect relationships predisposed to loss of functional connectivity via as yet not understood mechanism(s). Two of the three involved RSN pairs are members of the DMN, which is known to be a connectivity hub, both anatomically (Hagmann et al., 2008) and functionally (Buckner et al., 2009; Sperling et al., 2009; Zuo et al., 2011). Our results suggest that if one RSN of an RSN pair is abnormal, that dysfunction may then spread and cause synaptic dysfunction within the unaffected RSN of the pair (Drzezga et al., 2011).
Aβ is an early marker of AD, with the deposition of amyloid plaques and possibly oligomers playing an early and pivotal role in synaptic dysfunction. In addition, tau aggregation, which independently occurs during normal aging and in the early stages of AD, is further accelerated by the presence of concomitant amyloid pathology (Morris et al., 2001; Fagan et al., 2009). Furthermore, Aβ1–42 deposition preferentially occurs within the DMN (Buckner et al., 2005; Bero et al., 2011) and has been correlated with changes in rs-fcMRI (Sheline et al., 2010). The mechanism whereby pathology spreads from the DMN to other RSNs remains a question. One recently advanced hypothesis is based on the finding that misfolded tau can spread transsynaptically through neural networks, where it can induce tau misfolding in the postsynaptic neuron (de Calignon et al., 2012).
Another possibility is suggested by the present results. Proceeding with caution, as we are considering a fundamentally cellular–molecular question on the basis rs-fcMRI, we first note that loss of functional connectivity within the DMN is one of the earliest findings in AD (Greicius et al., 2004). We suggest that disordered neural communication may be a mechanism whereby AD pathology spreads from the DMN to the rest of the brain. Accordingly, loss of anticorrelations should be evident in the CDR 0 versus CDR 0.5 contrast, as presently observed (Figs. 2D, 4D, 5; Table 3). This model also is generally consistent with observed nonuniformity over space and CDR stage. Moreover, the model predicts that spread of pathology is self-reinforcing. This is consistent with the presently observed acceleration of change (Figs. 4, 5). This essentially informational view of pathology spread is entirely compatible with molecular mechanisms involving amyloid or tau or both (Fagan et al., 2009).
This study has limitations. First, all presented data are cross-sectional in nature. Additional longitudinal studies are needed to assess the progression of disease in the same participants. Longitudinal studies would enable investigation of which network properties predict AD progression. Second, our results reflect the particular selection of seeds chosen for investigation. Some details in the presently reported results might be different with another selection of a seeds or different analysis strategy [e.g., dual-regression (Zuo et al., 2010)]. The set of ROIs used in our analyses represents a good faith effort to survey five major RSNs in a principled manner while keeping the total number manageable to minimize the multiple-comparisons burden. Third, our sampling of participants with more advanced AD is relatively limited. Finally, we did not perform partial volume correction of rs-fcMRI data; consequently, possible effect of regional atrophy on our results cannot be excluded.
Footnotes
This work was supported by Medical Scientist Training Program Grant to Washington University School of Medicine (5T32GM007200-37, to M.R.B.); Knight Alzheimer's Disease Research Center (ADRC) Pilot Grant (3255 ADRC 26, to B.M.A.); NIMH Grant K23MH081786 (to B.M.A.); National Institute of Nursing Research Grants R01NR012907 and R01NR012657 (to B.M.A.); Dana Foundation Grant DF10052 (to B.M.A.); Alene and Meyer Kopolov Fund for Geriatric Psychiatry and Neurology (to B.M.A.); National Institute of Aging Grants P01AG026276, P01AG026276, P01AG03991, and P50 AG05681 (to J.C.M.); National Institute of Neurological Disorders and Stroke Grant NS06833 (to M.E.R. and A.Z.S.); Washington University Center for Translational Neuroscience Grant P30NS057105 (to D.M.H.); NIMH Grant P30NS048056 (to A.Z.S.), and American Roentgen Ray Society Foundation (to T.L.B.). We thank Russ Hornbeck for his invaluable assistance with the figures in this manuscript and the Clinical Core of the ADRC for participant assessments.
B.M.A. serves on the advisory board to Lily and Medscape and participates in a clinical trial of anti-dementia drugs for Pfizer. T.L.B. consults for Biomedical Systems and ICON Medical Imaging, and receives research support from Avid Radiopharmaceuticals. D.M.H. reports consulting for Pfizer, Bristol-Myers Squibb, and Innogenetics and is on the scientific advisory boards of En Vivo, Satori, and C2N Diagnostics. J.C.M. is currently participating in clinical trials of anti-dementia drugs sponsored by Janssen Alzheimer Immunotherapy, Eli Lilly, and Pfizer. He reports consulting for AstraZeneca, Bristol-Myers Squibb, Eisai, Elan/Janssen Alzheimer Immunotherapy Program, Genentech, Lilly, Merck, Novartis, Otsuka Pharmaceuticals, Pfizer/Wyeth, and Schering Plough. M.R.B., J.B.T., D.Z., A.Z.S., and M.E.R. have no financial conflicts of interest.
References
- Agosta F, Pievani M, Geroldi C, Copetti M, Frisoni GB, Filippi M. Resting state fMRI in Alzheimer's disease: beyond the default mode network. Neurobiol Aging. 2011 doi: 10.1016/j.neurobiolaging.2011.06.007. [DOI] [PubMed] [Google Scholar]
- Alexander GE, Chen K, Pietrini P, Rapoport SI, Reiman EM. Longitudinal PET evaluation of cerebral metabolic decline in dementia: a potential outcome measure in Alzheimer's disease treatment studies. Am J Psychiatry. 2002;159:738–745. doi: 10.1176/appi.ajp.159.5.738. [DOI] [PubMed] [Google Scholar]
- Beckmann CF, DeLuca M, Devlin JT, Smith SM. Investigations into resting-state connectivity using independent component analysis. Philos Trans R Soc Lond, B, Biol Sci. 2005;360:1001–1013. doi: 10.1098/rstb.2005.1634. [DOI] [PMC free article] [PubMed] [Google Scholar]
- Bero AW, Yan P, Roh JH, Cirrito JR, Stewart FR, Raichle ME, Lee JM, Holtzman DM. Neuronal activity regulates the regional vulnerability to amyloid-β deposition. Nat Neurosci. 2011;14:750–756. doi: 10.1038/nn.2801. [DOI] [PMC free article] [PubMed] [Google Scholar]
- Biswal B, Yetkin FZ, Haughton VM, Hyde JS. Functional connectivity in the motor cortex of resting human brain using echo-planar MRI. Magn Reson Med. 1995;34:537–541. doi: 10.1002/mrm.1910340409. [DOI] [PubMed] [Google Scholar]
- Blennow K, de Leon MJ, Zetterberg H. Alzheimer's disease. Lancet. 2006;368:387–403. doi: 10.1016/S0140-6736(06)69113-7. [DOI] [PubMed] [Google Scholar]
- Braak H, Braak E. Neuropathological stageing of Alzheimer-related changes. Acta Neuropathol. 1991;82:239–259. doi: 10.1007/BF00308809. [DOI] [PubMed] [Google Scholar]
- Büchel C, Josephs O, Rees G, Turner R, Frith CD, Friston KJ. The functional anatomy of attention to visual motion: a functional MRI study. Brain. 1998;121:1281–1294. doi: 10.1093/brain/121.7.1281. [DOI] [PubMed] [Google Scholar]
- Buckner RL. Memory and executive function in aging and AD: multiple factors that cause decline and reserve factors that compensate. Neuron. 2004;44:195–208. doi: 10.1016/j.neuron.2004.09.006. [DOI] [PubMed] [Google Scholar]
- Buckner RL, Snyder AZ, Shannon BJ, LaRossa G, Sachs R, Fotenos AF, Sheline YI, Klunk WE, Mathis CA, Morris JC, Mintun MA. Molecular, structural, and functional characterization of Alzheimer's disease: evidence for a relationship between default activity, amyloid, and memory. J Neurosci. 2005;25:7709–7717. doi: 10.1523/JNEUROSCI.2177-05.2005. [DOI] [PMC free article] [PubMed] [Google Scholar]
- Buckner RL, Andrews-Hanna JR, Schacter DL. The brain's default network: anatomy, function, and relevance to disease. Ann N Y Acad Sci. 2008;1124:1–38. doi: 10.1196/annals.1440.011. [DOI] [PubMed] [Google Scholar]
- Buckner RL, Sepulcre J, Talukdar T, Krienen FM, Liu H, Hedden T, Andrews-Hanna JR, Sperling RA, Johnson KA. Cortical hubs revealed by intrinsic functional connectivity: mapping, assessment of stability, and relation to Alzheimer's disease. J Neurosci. 2009;29:1860–1873. doi: 10.1523/JNEUROSCI.5062-08.2009. [DOI] [PMC free article] [PubMed] [Google Scholar]
- Calhoun VD, Adali T, Pearlson GD, Pekar JJ. A method for making group inferences from functional MRI data using independent component analysis. Hum Brain Mapp. 2001;14:140–151. doi: 10.1002/hbm.1048. [DOI] [PMC free article] [PubMed] [Google Scholar]
- Casey BJ, Cohen JD, O'Craven K, Davidson RJ, Irwin W, Nelson CA, Noll DC, Hu X, Lowe MJ, Rosen BR, Truwitt CL, Turski PA. Reproducibility of fMRI results across four institutions using a spatial working memory task. Neuroimage. 1998;8:249–261. doi: 10.1006/nimg.1998.0360. [DOI] [PubMed] [Google Scholar]
- Cole MW, Pathak S, Schneider W. Identifying the brain's most globally connected regions. Neuroimage. 2010;49:3132–3148. doi: 10.1016/j.neuroimage.2009.11.001. [DOI] [PubMed] [Google Scholar]
- Damoiseaux JS, Rombouts SA, Barkhof F, Scheltens P, Stam CJ, Smith SM, Beckmann CF. Consistent resting-state networks across healthy subjects. Proc Natl Acad Sci U S A. 2006;103:13848–13853. doi: 10.1073/pnas.0601417103. [DOI] [PMC free article] [PubMed] [Google Scholar]
- de Calignon A, Polydoro M, Suárez-Calvet M, William C, Adamowicz DH, Kopeikina KJ, Pitstick R, Sahara N, Ashe KH, Carlson GA, Spires-Jones TL, Hyman BT. Propagation of tau pathology in a model of early Alzheimer's disease. Neuron. 2012;73:685–697. doi: 10.1016/j.neuron.2011.11.033. [DOI] [PMC free article] [PubMed] [Google Scholar]
- de Zubicaray GI, McMahon K, Wilson SJ, Muthiah S. Brain activity during the encoding, retention, and retrieval of stimulus representations. Learn Mem. 2001;8:243–251. doi: 10.1101/lm.40301. [DOI] [PMC free article] [PubMed] [Google Scholar]
- Dosenbach NU, Fair DA, Miezin FM, Cohen AL, Wenger KK, Dosenbach RA, Fox MD, Snyder AZ, Vincent JL, Raichle ME, Schlaggar BL, Petersen SE. Distinct brain networks for adaptive and stable task control in humans. Proc Natl Acad Sci U S A. 2007;104:11073–11078. doi: 10.1073/pnas.0704320104. [DOI] [PMC free article] [PubMed] [Google Scholar]
- Drzezga A, Becker JA, Van Dijk KR, Sreenivasan A, Talukdar T, Sullivan C, Schultz AP, Sepulcre J, Putcha D, Greve D, Johnson KA, Sperling RA. Neuronal dysfunction and disconnection of cortical hubs in non-demented subjects with elevated amyloid burden. Brain. 2011;134:1635–1646. doi: 10.1093/brain/awr066. [DOI] [PMC free article] [PubMed] [Google Scholar]
- Ellermann JM, Siegal JD, Strupp JP, Ebner TJ, Ugurbil K. Activation of visuomotor systems during visually guided movements: a functional MRI study. J Magn Reson. 1998;131:272–285. doi: 10.1006/jmre.1998.1379. [DOI] [PubMed] [Google Scholar]
- Ewers M, Sperling RA, Klunk WE, Weiner MW, Hampel H. Neuroimaging markers for the prediction and early diagnosis of Alzheimer's disease dementia. Trends Neurosci. 2011;34:430–442. doi: 10.1016/j.tins.2011.05.005. [DOI] [PMC free article] [PubMed] [Google Scholar]
- Fagan AM, Head D, Shah AR, Marcus D, Mintun M, Morris JC, Holtzman DM. Decreased cerebrospinal fluid Abeta(42) correlates with brain atrophy in cognitively normal elderly. Ann Neurol. 2009;65:176–183. doi: 10.1002/ana.21559. [DOI] [PMC free article] [PubMed] [Google Scholar]
- Fox MD, Raichle ME. Spontaneous fluctuations in brain activity observed with functional magnetic resonance imaging. Nat Rev Neurosci. 2007;8:700–711. doi: 10.1038/nrn2201. [DOI] [PubMed] [Google Scholar]
- Fox MD, Snyder AZ, Vincent JL, Corbetta M, Van Essen DC, Raichle ME. The human brain is intrinsically organized into dynamic, anticorrelated functional networks. Proc Natl Acad Sci U S A. 2005;102:9673–9678. doi: 10.1073/pnas.0504136102. [DOI] [PMC free article] [PubMed] [Google Scholar]
- Fox MD, Corbetta M, Snyder AZ, Vincent JL, Raichle ME. Spontaneous neuronal activity distinguishes human dorsal and ventral attention systems. Proc Natl Acad Sci U S A. 2006;103:10046–10051. doi: 10.1073/pnas.0604187103. [DOI] [PMC free article] [PubMed] [Google Scholar]
- Fox MD, Zhang D, Snyder AZ, Raichle ME. The global signal and observed anticorrelated resting state brain networks. J Neurophysiol. 2009;101:3270–3283. doi: 10.1152/jn.90777.2008. [DOI] [PMC free article] [PubMed] [Google Scholar]
- Greicius MD, Krasnow B, Reiss AL, Menon V. Functional connectivity in the resting brain: a network analysis of the default mode hypothesis. Proc Natl Acad Sci U S A. 2003;100:253–258. doi: 10.1073/pnas.0135058100. [DOI] [PMC free article] [PubMed] [Google Scholar]
- Greicius MD, Srivastava G, Reiss AL, Menon V. Default-mode network activity distinguishes Alzheimer's disease from healthy aging: evidence from functional MRI. Proc Natl Acad Sci U S A. 2004;101:4637–4642. doi: 10.1073/pnas.0308627101. [DOI] [PMC free article] [PubMed] [Google Scholar]
- Hagmann P, Cammoun L, Gigandet X, Meuli R, Honey CJ, Wedeen VJ, Sporns O. Mapping the structural core of human cerebral cortex. PLoS Biol. 2008;6:e159. doi: 10.1371/journal.pbio.0060159. [DOI] [PMC free article] [PubMed] [Google Scholar]
- Hampson M, Driesen N, Roth JK, Gore JC, Constable RT. Functional connectivity between task-positive and task-negative brain areas and its relation to working memory performance. Magn Reson Imaging. 2010;28:1051–1057. doi: 10.1016/j.mri.2010.03.021. [DOI] [PMC free article] [PubMed] [Google Scholar]
- Hedden T, Van Dijk KR, Becker JA, Mehta A, Sperling RA, Johnson KA, Buckner RL. Disruption of functional connectivity in clinically normal older adults harboring amyloid burden. J Neurosci. 2009;29:12686–12694. doi: 10.1523/JNEUROSCI.3189-09.2009. [DOI] [PMC free article] [PubMed] [Google Scholar]
- Henke K, Mondadori CR, Treyer V, Nitsch RM, Buck A, Hock C. Nonconscious formation and reactivation of semantic associations by way of the medial temporal lobe. Neuropsychologia. 2003;41:863–876. doi: 10.1016/s0028-3932(03)00035-6. [DOI] [PubMed] [Google Scholar]
- Holtzman DM, Morris JC, Goate AM. Alzheimer's disease: the challenge of the second century. Sci Transl Med. 2011;3:77sr1. doi: 10.1126/scitranslmed.3002369. [DOI] [PMC free article] [PubMed] [Google Scholar]
- Hyvärinen A. Fast and robust fixed-point algorithms for independent component analysis. IEEE Trans Neural Netw. 1999;10:626–634. doi: 10.1109/72.761722. [DOI] [PubMed] [Google Scholar]
- Johnson SC, Baxter LC, Wilder LS, Pipe JG, Heiserman JE, Prigatano GP. Neural correlates of self-reflection. Brain. 2002;125:1808–1814. doi: 10.1093/brain/awf181. [DOI] [PubMed] [Google Scholar]
- Jones DT, Machulda MM, Vemuri P, McDade EM, Zeng G, Senjem ML, Gunter JL, Przybelski SA, Avula RT, Knopman DS, Boeve BF, Petersen RC, Jack CR., Jr Age-related changes in the default mode network are more advanced in Alzheimer disease. Neurology. 2011;77:1524–1531. doi: 10.1212/WNL.0b013e318233b33d. [DOI] [PMC free article] [PubMed] [Google Scholar]
- Kjaer TW, Nowak M, Lou HC. Reflective self-awareness and conscious states: PET evidence for a common midline parietofrontal core. Neuroimage. 2002;17:1080–1086. [PubMed] [Google Scholar]
- Macey PM, Macey KE, Kumar R, Harper RM. A method for removal of global effects from fMRI time series. Neuroimage. 2004;22:360–366. doi: 10.1016/j.neuroimage.2003.12.042. [DOI] [PubMed] [Google Scholar]
- Mazoyer B, Zago L, Mellet E, Bricogne S, Etard O, Houdé O, Crivello F, Joliot M, Petit L, Tzourio-Mazoyer N. Cortical networks for working memory and executive functions sustain the conscious resting state in man. Brain Res Bull. 2001;54:287–298. doi: 10.1016/s0361-9230(00)00437-8. [DOI] [PubMed] [Google Scholar]
- McKhann G, Drachman D, Folstein M, Katzman R, Price D, Stadlan EM. Clinical diagnosis of Alzheimer's disease. Neurology. 1984;34:939–944. doi: 10.1212/wnl.34.7.939. [DOI] [PubMed] [Google Scholar]
- Morris JC. The Clinical Dementia Rating (CDR): current version and scoring rules. Neurology. 1993;43:2412–2414. doi: 10.1212/wnl.43.11.2412-a. [DOI] [PubMed] [Google Scholar]
- Morris JC, Storandt M, Miller JP, McKeel DW, Price JL, Rubin EH, Berg L. Mild cognitive impairment represents early-stage Alzheimer disease. Arch Neurol. 2001;58:397–405. doi: 10.1001/archneur.58.3.397. [DOI] [PubMed] [Google Scholar]
- Murphy K, Birn RM, Handwerker DA, Jones TB, Bandettini PA. The impact of global signal regression on resting state correlations: are anti-correlated networks introduced? Neuroimage. 2009;44:893–905. doi: 10.1016/j.neuroimage.2008.09.036. [DOI] [PMC free article] [PubMed] [Google Scholar]
- Ojemann JG, Buckner RL, Corbetta M, Raichle ME. Imaging studies of memory and attention. Neurosurg Clin N Am. 1997;8:307–319. [PubMed] [Google Scholar]
- Petrella JR, Sheldon FC, Prince SE, Calhoun VD, Doraiswamy PM. Default mode network connectivity in stable vs progressive mild cognitive impairment. Neurology. 2011;76:511–517. doi: 10.1212/WNL.0b013e31820af94e. [DOI] [PMC free article] [PubMed] [Google Scholar]
- Power JD, Barnes KA, Snyder AZ, Schlaggar BL, Petersen SE. Spurious but systematic correlations in functional connectivity MRI networks arise from subject motion. Neuroimage. 2012;59:2142–2154. doi: 10.1016/j.neuroimage.2011.10.018. [DOI] [PMC free article] [PubMed] [Google Scholar]
- Raichle ME, MacLeod AM, Snyder AZ, Powers WJ, Gusnard DA, Shulman GL. A default mode of brain function. Proc Natl Acad Sci U S A. 2001;98:676–682. doi: 10.1073/pnas.98.2.676. [DOI] [PMC free article] [PubMed] [Google Scholar]
- Rombouts SA, Barkhof F, Goekoop R, Stam CJ, Scheltens P. Altered resting state networks in mild cognitive impairment and mild Alzheimer's disease: an fMRI study. Hum Brain Mapp. 2005;26:231–239. doi: 10.1002/hbm.20160. [DOI] [PMC free article] [PubMed] [Google Scholar]
- Sanz-Arigita EJ, Schoonheim MM, Damoiseaux JS, Rombouts SA, Maris E, Barkhof F, Scheltens P, Stam CJ. Loss of ‘small-world’ networks in Alzheimer's disease: graph analysis of FMRI resting-state functional connectivity. PLoS One. 2010;5:e13788. doi: 10.1371/journal.pone.0013788. [DOI] [PMC free article] [PubMed] [Google Scholar]
- Seeley WW, Menon V, Schatzberg AF, Keller J, Glover GH, Kenna H, Reiss AL, Greicius MD. Dissociable intrinsic connectivity networks for salience processing and executive control. J Neurosci. 2007;27:2349–2356. doi: 10.1523/JNEUROSCI.5587-06.2007. [DOI] [PMC free article] [PubMed] [Google Scholar]
- Seeley WW, Crawford RK, Zhou J, Miller BL, Greicius MD. Neurodegenerative diseases target large-scale human brain networks. Neuron. 2009;62:42–52. doi: 10.1016/j.neuron.2009.03.024. [DOI] [PMC free article] [PubMed] [Google Scholar]
- Sestieri C, Corbetta M, Romani GL, Shulman GL. Episodic memory retrieval, parietal cortex, and the default mode network: functional and topographic analyses. J Neurosci. 2011;31:4407–4420. doi: 10.1523/JNEUROSCI.3335-10.2011. [DOI] [PMC free article] [PubMed] [Google Scholar]
- Shehzad Z, Kelly AM, Reiss PT, Gee DG, Gotimer K, Uddin LQ, Lee SH, Margulies DS, Roy AK, Biswal BB, Petkova E, Castellanos FX, Milham MP. The resting brain: unconstrained yet reliable. Cereb Cortex. 2009;19:2209–2229. doi: 10.1093/cercor/bhn256. [DOI] [PMC free article] [PubMed] [Google Scholar]
- Sheline YI, Raichle ME, Snyder AZ, Morris JC, Head D, Wang S, Mintun MA. Amyloid plaques disrupt resting state default mode network connectivity in cognitively normal elderly. Biol Psychiatry. 2010;67:584–587. doi: 10.1016/j.biopsych.2009.08.024. [DOI] [PMC free article] [PubMed] [Google Scholar]
- Shulman GL, Corbetta M, Buckner RL, Fiez JA, Miezin FM, Raichle ME, Petersen SE. Common blood flow changes across visual tasks. I. increases in subcortical structures and cerebellum but not in nonvisual cortex. J Cogn Neurosci. 1997;9:624–647. doi: 10.1162/jocn.1997.9.5.624. [DOI] [PubMed] [Google Scholar]
- Shulman GL, Pope DL, Astafiev SV, McAvoy MP, Snyder AZ, Corbetta M. Right hemisphere dominance during spatial selective attention and target detection occurs outside the dorsal frontoparietal network. J Neurosci. 2010;30:3640–3651. doi: 10.1523/JNEUROSCI.4085-09.2010. [DOI] [PMC free article] [PubMed] [Google Scholar]
- Smith SM, Fox PT, Miller KL, Glahn DC, Fox PM, Mackay CE, Filippini N, Watkins KE, Toro R, Laird AR, Beckmann CF. Correspondence of the brain's functional architecture during activation and rest. Proc Natl Acad Sci U S A. 2009;106:13040–13045. doi: 10.1073/pnas.0905267106. [DOI] [PMC free article] [PubMed] [Google Scholar]
- Smyser CD, Inder TE, Shimony JS, Hill JE, Degnan AJ, Snyder AZ, Neil JJ. Longitudinal analysis of neural network development in preterm infants. Cereb Cortex. 2010;20:2852–2862. doi: 10.1093/cercor/bhq035. [DOI] [PMC free article] [PubMed] [Google Scholar]
- Sorg C, Riedl V, Mühlau M, Calhoun VD, Eichele T, Läer L, Drzezga A, Förstl H, Kurz A, Zimmer C, Wohlschläger AM. Selective changes of resting-state networks in individuals at risk for Alzheimer's disease. Proc Natl Acad Sci U S A. 2007;104:18760–18765. doi: 10.1073/pnas.0708803104. [DOI] [PMC free article] [PubMed] [Google Scholar]
- Sperling RA, Laviolette PS, O'Keefe K, O'Brien J, Rentz DM, Pihlajamaki M, Marshall G, Hyman BT, Selkoe DJ, Hedden T, Buckner RL, Becker JA, Johnson KA. Amyloid deposition is associated with impaired default network function in older persons without dementia. Neuron. 2009;63:178–188. doi: 10.1016/j.neuron.2009.07.003. [DOI] [PMC free article] [PubMed] [Google Scholar]
- Supekar K, Menon V, Rubin D, Musen M, Greicius MD. Network analysis of intrinsic functional brain connectivity in Alzheimer's disease. PLoS Comput Biol. 2008;4:e1000100. doi: 10.1371/journal.pcbi.1000100. [DOI] [PMC free article] [PubMed] [Google Scholar]
- Sylvester CM, Shulman GL, Jack AI, Corbetta M. Asymmetry of anticipatory activity in visual cortex predicts the locus of attention and perception. J Neurosci. 2007;27:14424–14433. doi: 10.1523/JNEUROSCI.3759-07.2007. [DOI] [PMC free article] [PubMed] [Google Scholar]
- Sylvester CM, Shulman GL, Jack AI, Corbetta M. Anticipatory and stimulus-evoked blood oxygenation level-dependent modulations related to spatial attention reflect a common additive signal. J Neurosci. 2009;29:10671–10682. doi: 10.1523/JNEUROSCI.1141-09.2009. [DOI] [PMC free article] [PubMed] [Google Scholar]
- Van Dijk KR, Sabuncu MR, Buckner RL. The influence of head motion on intrinsic functional connectivity MRI. Neuroimage. 2012;59:431–438. doi: 10.1016/j.neuroimage.2011.07.044. [DOI] [PMC free article] [PubMed] [Google Scholar]
- Wang K, Liang M, Wang L, Tian L, Zhang X, Li K, Jiang T. Altered functional connectivity in early Alzheimer's disease: a resting-state fMRI study. Hum Brain Mapp. 2007;28:967–978. doi: 10.1002/hbm.20324. [DOI] [PMC free article] [PubMed] [Google Scholar]
- Weissenbacher A, Kasess C, Gerstl F, Lanzenberger R, Moser E, Windischberger C. Correlations and anticorrelations in resting-state functional connectivity MRI: a quantitative comparison of preprocessing strategies. Neuroimage. 2009;47:1408–1416. doi: 10.1016/j.neuroimage.2009.05.005. [DOI] [PubMed] [Google Scholar]
- Zhang D, Raichle ME. Disease and the brain's dark energy. Nat Rev Neurol. 2010;6:15–28. doi: 10.1038/nrneurol.2009.198. [DOI] [PubMed] [Google Scholar]
- Zhang D, Snyder AZ, Shimony JS, Fox MD, Raichle ME. Noninvasive functional and structural connectivity mapping of the human thalamocortical system. Cereb Cortex. 2010;20:1187–1194. doi: 10.1093/cercor/bhp182. [DOI] [PMC free article] [PubMed] [Google Scholar]
- Zhou J, Greicius MD, Gennatas ED, Growdon ME, Jang JY, Rabinovici GD, Kramer JH, Weiner M, Miller BL, Seeley WW. Divergent network connectivity changes in behavioural variant frontotemporal dementia and Alzheimer's disease. Brain. 2010;133:1352–1367. doi: 10.1093/brain/awq075. [DOI] [PMC free article] [PubMed] [Google Scholar]
- Zhou Y, Dougherty JH, Jr, Hubner KF, Bai B, Cannon RL, Hutson RK. Abnormal connectivity in the posterior cingulate and hippocampus in early Alzheimer's disease and mild cognitive impairment. Alzheimers Dement. 2008;4:265–270. doi: 10.1016/j.jalz.2008.04.006. [DOI] [PubMed] [Google Scholar]
- Zielinski BA, Gennatas ED, Zhou J, Seeley WW. Network-level structural covariance in the developing brain. Proc Natl Acad Sci U S A. 2010;107:18191–18196. doi: 10.1073/pnas.1003109107. [DOI] [PMC free article] [PubMed] [Google Scholar]
- Zuo XN, Di Martino A, Kelly C, Shehzad ZE, Gee DG, Klein DF, Castellanos FX, Biswal BB, Milham MP. The oscillating brain: complex and reliable. Neuroimage. 2010;49:1432–1445. doi: 10.1016/j.neuroimage.2009.09.037. [DOI] [PMC free article] [PubMed] [Google Scholar]
- Zuo XN, Ehmke R, Mennes M, Imperati D, Castellanos FX, Sporns O, Milham MP. Network centrality in the human functional connectome. Cereb Cortex. 2011 doi: 10.1093/cercor/bhr269. [DOI] [PubMed] [Google Scholar]