


Abstract
We describe here a novel method for integrating gene and miRNA expression profiles in cancer using feed-forward loops (FFLs) consisting of transcription factors (TFs), miRNAs and their common target genes. The dChip-GemiNI (Gene and miRNA Network-based Integration) method statistically ranks computationally predicted FFLs by their explanatory power to account for differential gene and miRNA expression between two biological conditions such as normal and cancer. GemiNI integrates not only gene and miRNA expression data but also computationally derived information about TF–target gene and miRNA–mRNA interactions. Literature validation shows that the integrated modeling of expression data and FFLs better identifies cancer-related TFs and miRNAs compared to existing approaches. We have utilized GemiNI for analyzing six data sets of solid cancers (liver, kidney, prostate, lung and germ cell) and found that top-ranked FFLs account for ∼20% of transcriptome changes between normal and cancer. We have identified common FFL regulators across multiple cancer types, such as known FFLs consisting of MYC and miR-15/miR-17 families, and novel FFLs consisting of ARNT, CREB1 and their miRNA partners. The results and analysis web server are available at http://www.canevolve.org/dChip-GemiNi.
INTRODUCTION
A fundamental challenge in cancer systems biology is to identify the regulators of transcriptomic changes during disease progression. These transcriptomic changes are regulated by many different mechanisms including genetic and epigenetic modifications (1). Transcription factors (TFs) and microRNAs (miRNAs) are important regulators at the transcriptional and post-transcriptional levels that modulate transcriptome changes and therefore gene expression in response to cellular environment and signals. Both TFs and miRNAs are known to act as oncogenes or tumor suppressors in human cancers (2–4). Therefore, understanding and utilizing regulatory network information for TFs and miRNAs and their target genes could shed light on altered regulatory genes and pathways in human cancers and suggest novel therapeutic targets. Integrative analysis of both data types is underscored by a recent study showing that destabilization of target mRNAs by miRNA is the predominant mechanism to reduce gene expression, highlighting an essential role of miRNAs in gene regulation (5).
The miRNA-mediated feed-forward loops (FFLs) consisting of TFs and miRNAs are recurrent and important network motifs that form functional modules in the larger regulatory network (6,7). These FFL network motifs consist of a TF, a miRNA and their common target genes (defined as FFL target genes), where the TF regulates the transcription of the miRNA and both the TF and the miRNA regulate a common set of target genes (6–10). The FFLs govern many aspects of normal cell functions and diseases: creating bistable switches of gene expression in developing tissues for spatial avoidance; controlling the time sequence of gene expression to create temporal avoidance; and minimizing expression fluctuation against noise (11). For example, the FFL consisting of c-Myc, miR-17 cluster and E2F1 modulates cellular proliferation in cancer (3,8); the FFL formed by p53 and miR-34a-c promotes cell cycle procession (9); and several FFLs involving miR-7 buffer gene expression against environmental fluctuation during development (10). There are several databases of FFLs for development and cancer (12,13). However, large-scale experimental identification of FFLs and their roles in cancer has not been carried out.
A large amount of genome-wide gene expression and miRNA expression profiles for the same set of samples and covering multiple cancer types are now available from focused efforts of individual laboratories as well as large projects, such as TCGA (14) and ICGC (15). A common theme among currently available integrative analysis approaches is to first identify differentially expressed genes and miRNAs and then look for enriched gene ontology (GO) groups and pathways or miRNA–target gene pairs that are negatively correlated in expression level (16,17). While these methods can generate biological hypotheses that involve single genes or pathways, they do not fully use the genetic network architecture implied by the TF and miRNA regulation. Although researchers have studied FFLs in specific diseases or computationally discover them using genome scans (18–20), the network structures of TF, miRNA and regulated genes have not been used in integrative analysis of gene and miRNA expression data in a systematic manner.
We hypothesized that dysregulation of TF–miRNA FFLs could account for a large proportion of transcriptome changes between normal and disease states such as cancer. Therefore, we investigated the transcriptome changes by looking at gene, TF and miRNA expression profiles in the context of FFL networks. We developed a novel integrative analysis method dChip-GemiNI (Gene and miRNA Network-based Integration), which not only combines gene and miRNA expression profiles available for a disease process, but also incorporates regulatory network structure in the form of computationally identified TF–miRNA FFLs. The utilization of FFLs also provides a principled way to integrate these expression profiles. GemiNI statistically ranks predicted FFLs by their explanatory power to account for differential gene and miRNA expression between two biological conditions such as normal and cancer and assesses their significance using permutation.
We applied dChip-GemiNI to six paired gene and miRNA data sets of human cancers. We identified common miRNAs, TFs and FFLs across cancer types and quantified the proportion of transcriptome changes in cancer, which can be explained by top-ranking FFLs. Validation with systematic literature mining suggested that integrative analysis of expression and FFLs can better predict cancer-related TFs and miRNAs compared with using gene expression data alone, modeling FFLs better identifies cancer-related regulators and FFL-based integrative analysis is more robust. We identified well-known as well as novel FFLs that are common across multiple cancer types or cancer-specific. These top ranked, novel FFLs form experimentally testable hypotheses that regulatory interactions of the involved TFs, miRNAs and their target genes are driving regulators and effectors in one or multiple cancer types.
METHODS
We developed the dChip-GemiNI analysis method to integrate the regulatory network structure with the combined gene and miRNA expression profiling data generated for two biological states, such as normal and cancer. At present, dChip-GemiNI focuses on TF–miRNA FFLs where a miRNA mediates the effect of a TF on their common downstream target genes. The multistep process leading to data integration is outlined in Figure 1.
Figure 1.

dChip-GemiNI workflow for integrated network and expression analysis. We construct candidate TF–miRNA–gene network using different databases (Step 1), obtain gene and miRNA expression profiles from different studies (Step 2), select significant FFL motifs through integration of network motifs and expression data (Step 3) and further validate the results (Step 4). See Materials and Methods section for details. Step 3 shows a typical TF–miRNA–gene FFL. bs: binding score; rp: enrichment P-value; ep: differential expression P-value.
The first step identifies candidate FFLs from the regulatory relationships between TFs, miRNAs and target genes based on computational prediction of gene targets. In the second step, appropriate cancer data sets with both miRNA and mRNA expression profiles are identified and pre-processed. In the third step, we compute the network motif score (NMS) and the false discovery rate (FDR) for each candidate TF–miRNA FFL. The NMS is a function of multiple scores, including TF and miRNA binding scores to their target sequences, differential expression P-values of the FFL components between normal and cancer tissues, and TF and miRNA’s target enrichment in differentially expressed genes and miRNAs. The significance of NMS is assessed by their P-values based on null distributions obtained by permuting sample group labels and by FDR based on network permutation. Each step is described in detail below.
Construction of candidate TF–miRNA FFL networks
Using the TF–target and the miRNA-target information from motif scanning and prediction databases, we curated candidate TF–gene, TF–miRNA and miRNA–gene regulatory pairs. See Supplementary Figure S1 for the data set statistics. Based on these pairs, we further constructed TF–miRNA–gene networks using matrix representation of regulation targets. The scores of binding affinity were also used in advanced analysis with matrices containing these scores.
TF–target gene relation
We used the tfbsConsSites and tfbsConsFactors data tables from the UCSC Genome Browser that contain the location and score of TF binding sites (TFBSs) conserved in the human/mouse/rat whole genome alignments. The tfbsConsFactors table contains position frequency matrix (PFM) of TFBS motifs from TRANSFAC. We searched for TFBS in the 5-kb promoter region upstream of the transcription start site (TSS) of RefSeq genes. In addition, we performed a human-only TFBS search using TRANSFAC matrices v7.0 and UCSC hg18 genome assembly with the Perl TFBS module (21). The TF matrix accessions were linked to SWISS-PROT IDs and mapped to NCBI gene IDs using BioMart.
TF–target miRNA relation
We downloaded the miRBase (22) pre-miRNA genomic locations from UCSC table browser to locate miRNA promoter regions on the genome. We searched for TFBS in 5-kb upstream of pre-miRNAs, assuming TFs regulate miRNAs in a similar way as they regulate genes (23,24). We considered miRNA clusters and miRNA host genes when making TF–target miRNA predictions. miRNAs tend to form clusters as polycistrons on chromosome and are transcribed together. Moreover, many miRNAs are located within the introns of other genes and are often transcribed together with the host genes. To predict TFBS in these cases, we used the promoter of the first miRNA in 5′ for the miRNAs in a cluster and the promoter of the host gene for the miRNAs in genes.
miR–target gene relation
There are several major miRNA–target gene prediction databases including TargetScan, PicTar and miRanda (25). These predictions have different strengths and weaknesses in terms of specificity and sensitivity (26,27). Analysis of protein-level changes after miRNA knockout and transfection shows that TargetScan and PicTar are more accurate (28,29). We used TargetScan Release 5.1 as the primary database for miRNA target gene prediction, since TargetScan considers sequence conservation and is constantly updated, and PicTar as the supporting database. This is also comparable to the use of tfbsConsSites as the primary database for TF–target gene and target miRNA prediction. We then used matrices to store binary regulatory relationships between TF, miRNA and genes and used matrix operations for efficient search of candidate FFLs and calculation of other statistics such as the number of TF binding sites and total binding affinity scores.
Gene and miRNA expression data sets
We downloaded data sets with both mRNA and miRNA expression profiles with normal and cancer samples for the same cancer type from GEO (30) and ArrayExpress (31). We utilized mRNA and miRNA expression profiles that were either from the same samples (paired) or different samples (unpaired). The data set include liver cancer (hepatocellular carcinoma), kidney cancer (renal cell carcinoma), prostate cancer, testicular cancer (germ cell tumors) and two independent non-small cell lung cancer (NSCLC) cohorts (32–38). See Supplementary Table S1 for details on the data set, including sources, platforms and sample sizes.
Computing differential expression and gene set enrichment
We wrote modules in R-programming language to handle both miRNA and gene expression data with control and disease samples. We first normalized expression data and filtered out low-expression gene or miRNA probes by a specific low-expression cutoff value, so that >50% of the probes were kept, whose expression values are larger than the cutoff value in >50% samples. We followed standard analysis methods to identify differentially expressed miRNAs and genes as well as regulating TFs or miRNAs whose target miRNAs or genes are enriched in differentially expressed gene lists with P < 0.05. The t-tests or paired t-tests were used to identify a gene or miRNA’s differential expression between two sample groups (e.g. normal versus cancer), and the nominal P-values were stored as NMS factors for subsequent permutation analysis. We used Fisher’s exact test on the frequency tables of TF or miRNA target genes versus up/down/no change genes to compute P-values for the enrichment of target genes in differentially expressed genes or miRNAs. Our methods are applicable to any type of miRNA and gene expression data with appropriately formatted data files, sample information and gene information files.
Defining the significance of FFLs altered in cancer
NMS and FDR
We integrated the statistics from expression data analysis with network structure information into a NMS for candidate FFLs. For each candidate, FFL consisting of a TF, a miRNA (miR below) regulated by the TF and their common target genes, we computed its NMS as a product of bs, the binding affinity score from target prediction; ep, the differential expression P-value from the t-test of two group of samples; and rp, the enrichment P-value from the Fisher’s exact test to assess a target gene set’s enrichment in differentially expressed genes or another target gene set (Figure 2). The TF–gene, miR-gene and TF–miR links in an FFL are represented by both the binding score bs and target enrichment score rp in the NMS calculation. We used subscripts to indicate the node, link or other information for each scoring factor (Figure 2), e.g. rpTFgene|diffgene refers to the enrichment P-value of TF-targeted genes (TFgene) in differentially expressed genes (diffgene) (epgene < 0.05). Other relations, such as TF to miR (TFmiR) and miR to gene (miRgene) are represented in similar way as shown in Figure 2. A variation of bs (binding score), rbs (relative binding score), was defined as the ratio between the median binding score of the differentially expressed targets of a TF or miRNA and the median binding scores of all the targets of the TF or miRNA, and it weights more in the total score if differentially expressed targets also have higher sequence binding score. The P-value components ep and rp are converted from P-values linearly as 2 − P-value, which ranges between 1 and 2 and gives linear weights to TF and miRNA enrichment or differential expression.
Figure 2.

Computation of NMS and FDR with multiple scoring factors. (a) Computing NMS for the FFL of MYC and miR-17 using different scoring factors. (b) The list of scoring factors and example values and results. The ± signs indicate up/down-regulation of single or enriched genes. (c) Left: the distribution of NP (1000) maximal permutated NMS statistics (PNMS); right: the distribution of the observed NMS from all FFLs involving MYC (ONMS). With 1000 permutations, there are 45 PNMS larger than the observed NMS of MYC-miR-17 FFL, resulting in a permutation P = 0.045. The P-values for all TF–miRNA FFLs can be computed similarly. The NMS P-values are combined with common target enrichment P-values during network permutation to further compute FDR. See Materials and Methods section for details.
Finally, the NMS of a FFL is defined as the product of two components:
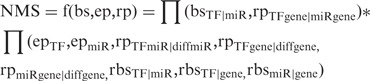 |
The first component is based on the candidate FFL network and does not change for different expression data set. It is computed using the TF–miRNA binding score (bsTF|miR), as well as the enrichment P-value for TF and miRNA common target genes (rpTFgene|miRgene), which checks whether the TF and miRNA share significant number of target genes by Fisher’s exact test. Such enrichment indicates that they are more likely to interact to regulate a set of common genes in specific pathways. The second component of NMS is based on both expression data and the candidate FFL network. It is computed using ep, rp, bs and rbs associated with nodes (genes and miRNAs) and edges (regulatory relationship) in the FFL network.
Assessing the NMS significance by permutation
With the NMS statistics for all candidate FFLs, we then estimated their significance by comparing them with the null distributions formed by randomly permuting the sample group labels of expression data set and the regulatory network structure. We first computed NMS permutation P-values by permuting sample group labels. For each TF (MYC as an example in Figure 2c), we computed the distribution of the maximal NMS statistic among all the FFLs involving the TF using the permuted data sets and used this distribution as the MaxT null distribution. The permutation P-value for the NMS of a FFL involving this TF and a miRNA is defined as the proportion of permutated maximal NMS statistics (PMNS) for this TF larger than the observed NMS (ONMS): NMS P-value = (NPNMS > ONMS)/Np, where Np is the number of permutations. We then computed empirical median FDR values at different P-value cutoffs by comparing the number of filtered FFLs in the original and in the permuted regulatory network. Supplementary Figure S2b shows the relationship between FDR and cutoff of the S score, defined as Max(TF–miRNA common target enrichment P-value, NMS P-value) to filter for significant FFLs. The figure shows that FDR decreases as S cutoff decreases. We then converted S scores to FDR for all FFLs using data set-specific relation between S and FDR.
RESULTS
dChip-GemiNI identifies significant TF–miRNA FFLs altered in human cancers
A detailed example of computing NMS and FDR for a well-known FFL consisting of MYC and miR-17 (8), in kidney cancer, is shown in Figure 2. It obtains a significant NMS P < 0.05 and FDR <0.05 for the kidney cancer data set. We visualize significant FFLs identified by the GemiNI analysis in a summary plot (Figure 3). The plot highlights top TFs STAT1, MYC and USF1 (Figure 3a) and top miRNAs miR-15a, miR-16 and miR-20b (Figure 3d) as the regulators forming FFLs that account for a large proportion of transcriptome changes in kidney cancer. The plot also allows for a quick identification of other significant FFLs as well as involved TFs and miRNAs (Figure 3c), helping construct specific biological hypotheses on their expression changes and roles in a cancer type. Other examples of significant FFLs are available in the summary plots of Supplementary File S1.
Figure 3.

The summary bubble-bar plot from dChip-GemiNI analysis of the kidney cancer data, highlighting the amount of differentially expressed genes explained by FFLs, TFs and miRNAs. TFs on the top (a) and miRNAs on the right (d) are ranked by the percentage of differentially expressed genes explained by all the significant FFLs involving a TF or miRNA (the height of bars). The top 20 TFs and miRNAs are displayed (for complete plots, see Supplementary File S1). The bubbles in the lower left panel (c) correspond to TF–miRNA FFLs with FDR <0.1 from the kidney cancer data. The bubble size indicates the number of differentially expressed FFL target genes, and color indicates the FFL significance. The cumulative percentage of differentially expressed genes explained by TFs and miRNAs is also shown in the barplots (a and d). The parenthesis around a TF or miRNA name indicates that its differential expression is not used in NMS due to missing data or low-expression filtering (other scoring factors are still used). TF and miRNA name color: red, expression is upregulated in cancer; blue, downregulated; black, no change. The following target enrichment analyses are called at Fisher’s exact test P < 0.05. enr_up (enr_down): TF and miRNA common target genes are enriched in upregulated (downregulated) genes; TF_gene_enr_up (TF_gene_enr_down): TF target genes are enriched in upregulated (downregulated) genes; TF_miR_enr_up (TF_miR_enr_down): TF target miRNAs are enriched in upregulated (downregulated) miRNAs; miR_gene_enr_up (miR_gene_enr_down): miRNA target genes are enriched in upregulated (downregulated) genes; Mut_enr: TF target genes and miRNA target genes are enriched in each other; enr_canpath: TF and miRNA common and differentially expressed target genes are enriched in KEGG cancer pathways.
Both NMS P-value and TF–miRNA common target enrichment P-value are essential in selecting significant FFLs altered between normal and cancer. Venn diagrams (Supplementary Figure 7a and b) show that thresholding TF–miRNA common target enrichment P-value alone gives rise to more than 4000 significant FFLs (enrichment P < 0.05, FDR < 0.1 compared to network permutation). In contrast, thresholding NMS P-value gives much focused FFLs (approximately 200). Using NMS P-value and TF–miRNA common enrichment P-value together (as S score = max of the two P-values) will call significant FFLs as their intersection: around two-third of the FFLs from the NMS P-value cutoff and a very small portion of FFLs from the enrichment P-value cutoff. Although FFLs with significant enrichment of TF–miRNA common targets are independent of expression data set, the S-filtered FFLs depend on expression data and cancer-specific alteration of FFLs (Table 1).
Table 1.
The top-ranked TFs and miRNAs involved in TF–miRNA FFLs across six cancer data sets
| liver_cancer GSE22058 | kidney_cancer GSE16441 | prostate_cancer GSE21032 | germ_cell_tumor GSE18155 | lung_cancer GSE18805 | lung_cancer GSE2088_ E-TABM-22 | Average rank | Number of presence | |
|---|---|---|---|---|---|---|---|---|
| TFs | ||||||||
| USF1 | 2 | 3 | 5 | 9 | 8 | 2 | 4.83 | 6 |
| ARNT | 3 | 5 | 6 | 9 | 6 | 1 | 5.00 | 6 |
| MYC | 4 | 2 | 3 | 9 | 21 | 7 | 7.67 | 5 |
| MAX | 18 | 8 | 8 | 9 | 14 | 6 | 10.50 | 6 |
| AHR | 6 | 4 | 14 | 9 | 5 | 41 | 13.17 | 5 |
| CREB1 | 5 | 71 | 2 | 1 | 1 | 5 | 14.17 | 5 |
| IKZF1 | 9 | 29 | 21 | 9 | 14 | 3 | 14.17 | 4 |
| MYCN | 41 | 10 | 11 | 9 | 20 | 19 | 18.33 | 4 |
| TFAP2C | 29 | 25 | 11 | 9 | 20 | 20 | 19.00 | 2 |
| SREBF1 | 16 | 9 | 52 | 9 | 26 | 8 | 20.00 | 4 |
| MYCN | 39 | 8 | 15 | 43 | 32 | 8 | 24.17 | 3 |
| FOSB | 17 | 39 | 27 | 42 | 18 | 21 | 27.33 | 2 |
| TFAP2C | 43 | 38 | 16 | 7 | 29 | 38 | 28.50 | 2 |
| NR3C1 | 24 | 26 | 51 | 5 | 39 | 26 | 28.50 | 1 |
| SREBF1 | 15 | 17 | 62 | 47 | 20 | 12 | 28.83 | 3 |
| TFAP2B | 26 | 35 | 17 | 10 | 40 | 48 | 29.33 | 2 |
| PPARG | 19 | 37 | 62 | 42 | 12 | 6 | 29.67 | 3 |
| MYB | 12 | 21 | 58 | 47 | 10 | 32 | 30.00 | 2 |
| MZF1 | 70 | 43 | 13 | 29 | 10 | 15 | 30.00 | 3 |
| JUND | 17 | 33 | 50 | 42 | 18 | 21 | 30.17 | 2 |
| miRNAs | ||||||||
| hsa-miR-17 | 3 | 5 | 5 | 1 | 4 | 3 | 3.50 | 6 |
| hsa-miR-16 | 3 | 1 | 5 | 9 | 3 | 1 | 3.67 | 6 |
| hsa-miR-195 | 2 | 3 | 2 | 9 | 2 | 4 | 3.67 | 6 |
| hsa-miR-15a | 1 | 1 | 3 | 9 | 1 | 8 | 3.83 | 6 |
| hsa-miR-20a | 3 | 5 | 5 | 9 | 4 | 6 | 5.33 | 6 |
| hsa-miR-130a | 10 | 13 | 14 | 3 | 15 | 7 | 10.33 | 6 |
| hsa-miR-27a | 5 | 9 | 9 | 9 | 8 | 26 | 11.00 | 5 |
| hsa-miR-19a | 11 | 6 | 6 | 9 | 6 | 33 | 11.83 | 5 |
| hsa-miR-497 | 24 | 4 | 1 | 9 | 2 | 33 | 12.17 | 4 |
| hsa-miR-106b | 6 | 8 | 11 | 9 | 16 | 33 | 13.83 | 5 |
| hsa-miR-106a | 4 | 35 | 6 | 38 | 7 | 1 | 15.17 | 4 |
| hsa-miR-19a | 8 | 7 | 4 | 38 | 6 | 28 | 15.17 | 4 |
| hsa-miR-20b | 36 | 2 | 6 | 38 | 7 | 8 | 16.17 | 4 |
| hsa-miR-23a | 33 | 8 | 9 | 26 | 10 | 29 | 19.17 | 3 |
| hsa-miR-106b | 7 | 9 | 12 | 38 | 14 | 51 | 21.83 | 4 |
| hsa-miR-93 | 7 | 9 | 12 | 38 | 14 | 51 | 21.83 | 4 |
| hsa-miR-124 | 12 | 18 | 31 | 38 | 23 | 10 | 22.00 | 3 |
| hsa-miR-424 | 6 | 19 | 52 | 17 | 11 | 31 | 22.67 | 4 |
| hsa-miR-92a | 10 | 14 | 7 | 4 | 68 | 34 | 22.83 | 4 |
| hsa-miR-15b | 19 | 15 | 11 | 38 | 13 | 51 | 24.50 | 4 |
In each cancer data set, TFs and miRNAs are ranked by the percentage of differentially expressed (DE) genes explained by all the significant FFLs (FDR < 0.1) involving a TF or miRNA (similar to Figure 3). The tables order TFs and miRNAs by their average ranks in the six cancer data sets. In a data set, the TFs or miRNAs with the same percentage of FFL-explained DE genes are ranked the same. Analysis of germ cell tumor results in only a few TFs and miRNAs associated with significant FFLs, and we rank the rest TFs and miRNAs at the same low rank order. Number of presence: the number of times that a TF or miRNA is present in the top 20 of individual data sets. See Supplementary File S4 for more information.
We applied dChip-GemiNI to six cancer data sets with both gene and miRNA expression data in normal and cancer samples and identified significant FFLs. They include data sets for liver, kidney, prostate, germ cell tumors and two independent data sets of non-small cell lung cancer (Supplementary Table S1). We also included tables of significant FFLs and their common target genes in Supplementary File S2 for the kidney cancer data. The FFLs with significant FDR were used in the downstream analysis and literature and computational validation.
Validation of significant FFLs for their roles in cancer
Our literature search identified only six experimentally validated miRNA-mediated FFLs in human cancers (Supplementary Table S6), of which dChip-GemiNI identifies one FFL (E2F1 with miRNA-106a/93/25) as significant (FDR < 0.1) in lung and liver cancers. Our procedure missed some validated FFLs due to the lack of known TF motifs in our data set. Since very few experimentally validated FFLs are known in cancer, we validated the significant FFLs in several innovative ways in the absence of any gold standard set of FFLs in cancer.
We utilized the TransmiR database (39) that curates TF -miRNA regulation information from the literature as partial evidence for FFLs. We found evidence supporting multiple significant FFLs (FDR < 0.1) formed by TFs MYC, MYCN, E2F1, E2F3, SP1, EGR1 and STAT3 with several miRNAs (see Supplementary Table S2).
Next, we hypothesized that even when the functional role of a particular FFL is not known in a given cancer type, both the involved TF and miRNA could have been studied together, or functional roles of the constituent TF and miRNA may have been characterized extensively, if the involved TFs and miRNAs play important roles in multiple cancer types. Therefore, we performed automatic literature mining of PubMed abstracts for combined keywords of a TF or miRNA gene name or aliases and cancer-related terms (‘neoplasms’, ‘cancer’, ‘tumor’, ‘carcinoma’, ‘oncogenes’). The general cancer terms instead of specific cancer type names were used in the search to relate the literature results to top-ranked TFs and miRNAs across multiple cancer types. We found that 3.2% of all significant FFLs (FDR < 0.1) from kidney cancer co-mentioned in at least one publication, compared to only 1.2% of all TF–miRNA pairs co-mentioned. Thus, there is a 2.67-fold enrichment in literature co-occurrence for significant FFLs. We also found that there is a 1.51-fold enrichment in literature co-occurrence for significant FFLs identified by TF–miRNA common target enrichment P-value only without using expression data, compared to a 2.17-fold enrichment for FFLs identified using NMS P-value only. This supports the value of using expression data through NMS in selecting cancer-specific FFLs.
We also counted the number of cancer-related papers for each TF and miRNA (Figure 4a and Supplementary File S3). We found several TFs and miRNAs which have been studied in a large number of cancer publications due to their important and diverse roles in cancer: TP53 (more than 50 000 papers), NFKB1 (more than 30 000), ESR1 and MYC (approximately 20 000), miR-21 (more than 300 papers), miR-17 (approximately 200) and miR-16 (more than 100). The median value of the cancer-related papers is 233 for all the TFs and 9 for all the miRNAs.
Figure 4.

Validation of top TFs and miRNAs ranked by different analysis methods. (a) The top 10 miRNAs based on the number of cancer-related papers from literature mining. Asterisks indicate oncomiRs summarized in reviews (2,3,40,41); Hash indicate oncomiRs from the SBI OncomiR collection (http://www.systembio.com/services/microrna/oncomir-collection). See Supplementary Files S3 and S7 for details. (b) The top 10 miRNAs by the average rank of differential expression P-values from the six cancer data sets. See Supplementary File S4 for the complete list. (c) The scatter plot between the number of cancer-related papers and the average rank of miRNAs by differential expression. Higher rank (lower rank number) is correlated with more papers, so the correlation is negative. The red circles are known oncomiRs from SBI. The top-ranked miRNAs could also suggest novel oncomiR candidates, such as the three leftmost black points corresponding to miR-142-5p, miR-130a and miR-96 (indicated in the large circle). (d) The miRNAs are first ordered by their average ranks in the six cancer data sets using each analysis method and then divided into four quarters (X-axis). Then, the median number of cancer-related papers of the miRNAs in each quarter is plotted (Y-axis) for different methods. The gray horizontal line is the median number of papers for all miRNAs. (e) The similar plot as (d) for TFs.
We expected that the involvement of miRNAs and TFs in cancer would be reflected by both the number of cancer studies in the literature and their ranking in expression data analysis. We first assessed the correlation between TFs and miRNAs’ differential expression ranking and their occurrence in cancer-related PubMed abstracts. We ranked miRNAs and TFs by their differential expression P-values in each cancer data set and computed their average ranks in the six cancer data sets (Figure 4b and Supplementary File 4). We found a strong correlation between the number of cancer-related papers and the average rank of each miRNA (correlation = −0.72, Figure 4c; higher rank is associated with more papers) and a moderate correlation for TFs (−0.30). The correlations are smaller when using the ranks in individual cancer data sets compared to using the average ranks across the six cancer data sets. The high correlation for miRNAs suggests that the miRNA’s differential expression ranks averaged across cancer types can identify miRNAs important in cancer.
Next, we compared different analysis methods of ranking cancer-related TFs and miRNAs based on expression data, including differential expression analysis, target enrichment of differentially expressed genes and miRNAs and the FFL model. For differential expression and target enrichment analysis, we ranked TFs and miRNAs by P-values. For the FFL model, TFs and miRNAs were ranked by the number of differentially expressed FFL target genes in their associated FFLs with FDR < 0.1. We divided the miRNAs and TFs into four quarters based on their average ranks in each method (lower quarters for high-ranked miRNAs and TFs) and then plotted the median number of papers in each quarter. All the methods are able to associate high-ranked miRNAs and TFs with more cancer-related papers (Figure 4d and e). Although the miRNA differential expression method (triangles) better distinguishes the first quarter from the other quarters, the FFL model performs slightly better in selecting cancer-related miRNAs in the first quarter of ranked miRNAs (Figure 4d). Moreover, the FFL model performs significantly better than the other methods in ranking cancer-related TFs in the first quarter (Figure 4e). In summary, the FFL model performs comparably or better in identifying top cancer-related miRNAs or TFs compared to existing approaches.
FFL-based integrative analysis is more robust
We found that for the same biological process or disease, results from the FFL model are more comparable between data sets than those from traditional methods such as differential expression or TF/miRNA target enrichment. For example, the correlation between TF or miRNA ranks of the two lung cancer data sets is the highest using the FFL model (Supplementary Table S3). In addition, the FFL analysis identifies the involvement of the miR-15/miR-17 families in both lung cancer data sets (Supplementary Figure S3), which is less prominent from traditional analysis. The results described here and in the previous section confirm the robustness of integrative analysis of gene and miRNA expression data with network motifs.
This is important as the number of differentially expressed genes, target-enriched TFs or miRNAs vary across the cancer expression data sets, possibly due to their cancer type, sample size and platform characteristics (Supplementary Table S4 and Supplementary File S4). The different data sets for the same cancer type can also result in differences. For instance, the gene and miRNA expression data are paired in lung cancer data set 1 (GSE18805), while they are from two studies (GSE2088 and E-TABM-22) in lung cancer data set 2. The lung cancer data set 2 has more samples, fewer differentially expressed genes/TFs and miRNAs, but more miRNAs with enriched target genes than the lung cancer data set 1 (Supplementary Tables S1 and S4). For some genes or miRNAs, such as the TF ARNT, the direction of expression change is opposite between the two lung cancer data sets (Supplementary File S4). In general, more differentially expressed or target-enriched genes and miRNAs lead to more TFs and miRNAs identified by significant FFLs (Supplementary Table S4 and Supplementary Figure S4).
Significant TF–miRNA FFLs explain ∼20% of transcriptome changes in human cancers
To estimate transcriptome changes between normal and cancer that are likely caused by significant FFLs, we identified the target genes of all the significant FFLs in a data set and computed the ratio of differentially expressed FFL target genes to all differentially expressed genes. In the kidney cancer data, the FDR cutoffs of 0.05 and 0.1, respectively, identify approximately 230 and approximately 430 significant FFLs, which likely cause 18 and 23% of expression changes (Figure 3b). In addition, the FFL target genes of the top 20 TFs and top 20 miRNAs, ranked by the percentage of expression changes explained by all the significant FFLs associated with a TF or miRNA, account for ∼17% of the differentially expressed genes in the kidney cancer data (the cumulative blue curves in Figure 3a and d).
For all the cancer data sets, there are on average 130 and 270 significant FFLs at the FDR cutoffs of 0.05 and 0.1, respectively, which explain on average 13 and 19% of expression changes in a data set. The FFL target genes of the top 20 TFs and top 20 miRNAs account for ∼15% of the differentially expressed genes on average across the data sets. Interestingly, FFLs with FDR <0.1 can explain 20–23% of the expression changes for most of the cancers, but only 3% of expression changes for germ cell tumor, possibly because the small sample size of this data set leads to much fewer significant FFLs (Supplementary Table S1).
In comparison, we found that on average significant TFs or miRNAs explain 50–70% of the expression changes when using TF–target gene or miRNA–target gene enrichment analysis. This can be due to the fact that each TF or miRNA usually has hundreds of target genes, but the number of target genes of an FFL (defined as the common targets of the involved TF and miRNA) is usually less than 100. In effect, the FFL model narrows down the list of potential target genes of candidate regulators for further validation.
Meta-analysis of multiple cancer types identifies common and cancer-specific FFLs
We identified significant FFLs and involved TFs and miRNAs that are common and distinct across multiple cancer types at the FDR threshold of 0.1. Top-ranked FFLs that are common across the six cancer data sets consist of TFs USF1, ARNT, MYC, MAX, AHR, CREB1 and miRNAs mir-15a, miR-16, miR-17, miR-20a and miR-195 (Table1; see Supplementary File S4 for the complete list). Most of the top miRNAs belong to two families of miRNA clusters, the miR-15/16/195/424/497 family and miR-17-5p/20/93.mr/106/519.d family, located on chromosomes 3, 7, 13, 17 and X (see Supplementary Table S5 for details). These miRNA clusters are potentially co-regulated by dozens of TFs including ARNT, MYC and CREB1. Supplementary Figure S5 shows the regulatory relationships among them.
The miR-15 and miR-17 families have been experimentally verified to be oncomiRs and have tumor suppressor or oncogene functions in cancer [Supplementary Figure S6 (2,3,40,41)]. In our analysis, the expression levels of most miR-15 and miR-17 family members increase in most cancer types relative to normal, and there is clear expression correlation in the miRNA clusters (Supplementary File S5). miRNA clusters and miRNA families are widely distributed in the genome: there are over 200 miRNAs forming over 60 physical clusters on chromosomes and over 200 miRNAs belonging to approximately 100 miRNA families. Therefore, in our view, the identification of miR-15/17 cluster family is likely not due to the bias introduced by computational methods for target identification (e.g. the entire miRNA family sharing largely overlapping target genes).
The target gene functions of top-ranked FFLs are diverse and often enriched of cancer-related GO terms and pathways. For example, significant GO terms in the differentially expressed target genes of the MYC/miR-17 FFL in kidney cancer include transcriptional regulation, apoptosis, cell cycle arrest, RAS signaling and cytokine production (Table 2). Significant GO terms for other selected FFLs involving MYC, CREB1, SP1 and mir-15/17 in several cancer types are listed in Supplementary File S6.
Table 2.
Significantly enriched GO terms in the differentially expressed target genes of the MYC and miR-17 FFL in kidney cancer
| Category | Term | Count | P-value | FDR % |
|---|---|---|---|---|
| GOTERM_BP_FAT | GO:0006350∼transcription | 20 | 6.75E-05 | 0.098527 |
| GOTERM_BP_FAT | GO:0045449∼regulation of transcription | 20 | 0.0011513 | 1.667907 |
| GOTERM_BP_FAT | GO:0016265∼death | 9 | 0.0041554 | 5.898623 |
| GOTERM_BP_FAT | GO:0006917∼induction of apoptosis | 6 | 0.0058396 | 8.195772 |
| GOTERM_BP_FAT | GO:0012502∼induction of programmed cell death | 6 | 0.005916 | 8.298779 |
| GOTERM_BP_FAT | GO:0007050∼cell cycle arrest | 4 | 0.0061271 | 8.582609 |
| GOTERM_BP_FAT | GO:0046578∼regulation of Ras protein signal transduction | 5 | 0.0069286 | 9.653135 |
| GOTERM_BP_FAT | GO:0001816∼cytokine production | 3 | 0.0120185 | 16.18359 |
| GOTERM_BP_FAT | GO:0051056∼regulation of small GTPase-mediated signal transduction | 5 | 0.0129273 | 17.30217 |
| GOTERM_BP_FAT | GO:0008219∼cell death | 8 | 0.0142681 | 18.92731 |
| GOTERM_BP_FAT | GO:0006357∼regulation of transcription from RNA polymerase II promoter | 8 | 0.0150876 | 19.90583 |
| GOTERM_MF_FAT | GO:0005083∼small GTPase regulator activity | 6 | 0.0036058 | 4.2172 |
| GOTERM_MF_FAT | GO:0030695∼GTPase regulator activity | 7 | 0.0039461 | 4.606721 |
| GOTERM_MF_FAT | GO:0060589∼nucleoside–triphosphatase regulator activity | 7 | 0.0043937 | 5.116735 |
| GOTERM_MF_FAT | GO:0030528∼transcription regulator activity | 13 | 0.0090264 | 10.25106 |
| GOTERM_MF_FAT | GO:0003677∼DNA binding | 17 | 0.0094193 | 10.67461 |
| GOTERM_MF_FAT | GO:0003700∼transcription factor activity | 10 | 0.0098228 | 11.10768 |
| INTERPRO | IPR003070:Orphan nuclear receptor | 2 | 0.0096936 | 11.07411 |
| INTERPRO | IPR001331:Guanine–nucleotide dissociation stimulator, CDC24, conserved site | 3 | 0.0177529 | 19.4124 |
| KEGG_PATHWAY | hsa05214:Glioma | 3 | 0.0142992 | 12.54349 |
| PIR_SUPERFAMILY | PIRSF002524:nerve growth factor IB-like nuclear receptor | 2 | 0.0052646 | 3.816163 |
| SP_PIR_KEYWORDS | Transcription regulation | 20 | 9.40E-06 | 0.010708 |
| SP_PIR_KEYWORDS | Transcription | 20 | 1.29E-05 | 0.014701 |
| SP_PIR_KEYWORDS | Phosphoprotein | 37 | 0.0006004 | 0.681797 |
| SP_PIR_KEYWORDS | Nucleus | 26 | 0.0007915 | 0.897858 |
| SP_PIR_KEYWORDS | DNA binding | 15 | 0.0017858 | 2.015405 |
| SP_PIR_KEYWORDS | Guanine–nucleotide releasing factor | 4 | 0.0067022 | 7.373974 |
| SP_PIR_KEYWORDS | transcription factor | 3 | 0.0181031 | 18.78729 |
| SP_PIR_KEYWORDS | Zinc finger | 12 | 0.0181405 | 18.82247 |
| UP_SEQ_FEATURE | Compositionally biased region:Ser-rich | 8 | 0.0003965 | 0.50712 |
GO terms are filtered by FDR < 0.2 and GO analysis are performed by the DAVID functional annotation Web server.
We also identified cancer type-specific FFLs and associated top TFs and miRNAs (Table 1 and Supplementary File S4). For example, OCT1/POU2F1 ranks as number 4 in lung cancer data 1 but ranks lower in other cancers; STAT1 ranks as number 1 in kidney cancer, while its average rank across the data sets is not high. For miRNAs, miR-548d-3p ranks within top three in germ cell tumor but lower in other cancers. These results generate novel hypotheses to study cancer type-specific functions of top-ranked FFLs, TFs and miRNAs and can be queried at http://www.canevolve.org/dChip-GemiNi.
DISCUSSION
Transcriptome changes are an important mediator in complex diseases such as cancers, which have multiple biological hallmarks (42). Among many genetic regulators, TFs and miRNAs frequently form FFLs and other network motifs to regulate gene expression in a combinatorial manner. Such regulation may be disrupted in cancer due to mutations and chromosome abnormalities. Success in treating cancer patients calls for better understanding of common and cancer type-specific regulatory processes in cancer cells.
Here, we have developed dChip-GemiNI, a novel analysis approach integrating FFL network structures with gene and miRNA expression data, and identified significant TF–miRNA FFLs that likely cause ∼20% of the transcriptome changes. Conventional analysis methods focus on differentially expressed genes and miRNAs between biological processes or disease states, but expression changes may not be detectable for many TFs and miRNAs, whose expression level can be low and their effects can be exerted by other means such as protein phosphorylation or localization. However, these effects may be probed through changes in the network of the regulated genes. Gene set and pathway enrichment analyses method partially utilize such information via TF or miRNA target gene sets. dChip-GemiNI overcomes limitations from traditional analysis methods by combining multiple data sources to rank network motifs such as FFLs by their explanatory power to account for transcriptomic changes. We have shown that this FFL-based modeling can identify TF and miRNA regulatory pathways commonly altered across cancer types and do so more consistently than existing analysis approaches. Our results confirm the roles of miRNA-mediated pathways in human cancers and generate novel biological hypotheses on specific TF–miRNA FFLs as altered regulators.
TF–miRNA FFLs may be common drivers of pathogenesis across multiple cancer types
We have identified common TFs and miRNAs associated with significant FFLs across cancer types. For example, MYC, ARNT and USF1 are ranked within the top 20 TFs in all the cancer types except the germ cell tumor (Table1). MYC has multiple roles in cancer and is known to involve in miRNA regulation (3,41,43–45). MYC mutation or dysregulation can cause a cascade of expression changes of miRNAs and genes and lead to abnormal cell cycle and apoptosis functions (Supplementary Figure S6). Our study confirms that FFL networks involving MYC and the miR-15 and miR-17 families are potential common drivers of malignant progression across cancer types. We show that MYC regulates multiple top-ranked miRNAs associated with significant FFLs, including the miRNA clusters in the miR-15/16/195/424/497 and miR-17-5p/20/93.mr/106/519.d families (Supplementary Figure S5).
In addition, our analysis ranks ARNT (aryl hydrocarbon receptor nuclear translocator) as number 2 in prostate cancer and number 4 in liver cancer (Table 1). ARNT has recently been shown to associate with tumor growth and progression of liver cancer (46). Our analysis ranks CREB1 (cAMP responsive element binding protein 1) as one of the top TFs by average rank and number 1 in the lung cancer data set 1 and germ cell tumor. Recent studies have shown that CREB is involved in tumor initiation, progression and metastasis (47), and it has growth suppression or cancer inhibition function in lung and prostate cancers (48,49). However, CREB’s regulation of miRNAs in cancer has not been well studied and our results provide a new hypothesis of CREB-miRNA network’s alteration in cancer and potential miRNA partners.
Modeling FFLs better identifies potential cancer regulatory network
We have shown that modeling TF–miRNA FFLs helps to better identify cancer-related TFs, as suggested by the higher number of cancer-related papers in top-ranked TFs compared with the methods of differential expression and target enrichment. TFs’ mRNA expression level is usually low, their functions are frequently altered at the protein interaction or modification level and they often form regulatory modules. These factors hinder simpler approaches to study TF functions in cancer using gene expression data. In evaluating TFs, the FFL model integrates information from both mRNA and miRNA expression through the network structure of target genes and improves the cancer relevance of the TF ranking. For example, MYC and CREB1 are not among the top TFs according to differential expression or target enrichment analysis (Supplementary File S4), but through FFLs they are connected to oncomiRs in the miR-15 and miR-17 families, many of which are top-ranked miRNAs by differential expression or miRNA target gene enrichment across cancer data sets. Therefore, in the FFL model, MYC and CREB1 are ranked high as common cancer-related TFs because their associated significant FFLs can explain a high percentage of expression changes.
Future improvement of network and expression data integration
Although the analysis results from dChip-GemiNI shows consistency and specificity across multiple data sets, there are areas of improvement in follow-up work. First, we can improve the target prediction and candidate regulatory network by including gene targets identified from genome-wide profiling of TFs using chromatin immunoprecipitation followed by microarray hybridization or next-generation sequencing. Second, the proposed methodology is not limited to one type of network motifs, such as FFL. We can study other common network motifs, such as feedback loops consisting of one miRNA and one TF, which often form bistable switches in development and differentiation. Third, we may consider correlations between TF, miRNA and gene expression when each sample has both miRNA and gene expression data. If such correlations are available for both control and disease samples, correlation changes between control and disease can be incorporated into the scoring of network motif models to identify altered regulatory network. As genomics studies of cancer generate more large data sets of multiple data types, integrative analysis methods will play ever-growing roles in understanding the causes of cancer and revealing novel drug targets.
SUPPLEMENTARY DATA
Supplementary Data are available at NAR Online: Supplementary Tables 1–6, Supplementary Figures 1–7 and Supplementary Files 1–8.
FUNDING
National Institutes of Health [R01 GM077122 to Z.Y., P.K.S. and C.L., DP1 DA28994 to D.G. and V.M.]; Dana Foundation (to Z.Y.). Claudia Adams Barr Program in Innovative Basic Cancer Research and the Multiple Myeloma Career Development award (to P.K.S.); Claudia Adams Barr Program in Innovative Basic Cancer Research (to D.G. and V.M.); H.J. is a scholar of the Hundred Talents Program of the Chinese Academy of Sciences. Funding for open access charge: NIH [R01 GM077122].
Conflict of interest statement. None declared.
Supplementary Material
ACKNOWLEDGEMENTS
We thank Curtis Huttenhower, Nikhil C. Munshi, Tao Lu, Bruce Yankner, Yu Zhang, Andrea Richardson, Yong Zhang, Meng Wang, Zhen Zhou and members of Cheng Li Lab for constructive discussion. Finally, we are grateful to the anonymous reviewers for their critical insights that have improved the quality of this work. Z.Y., P.K.S. and C.L. designed the study and wrote the manuscript. Z.Y. carried out the data collection and analysis and prepared the figures. M.K.S. constructed the web server. S.B.A., N.H. and X.W. contributed to data collection. V.M., D.G. and H.J. contributed to the biological interpretation. All authors discussed the methods and results and approved the manuscript.
REFERENCES
- 1.Barabasi AL, Oltvai ZN. Network biology: understanding the cell’s functional organization. Nat. Rev. Genet. 2004;5:101–113. doi: 10.1038/nrg1272. [DOI] [PubMed] [Google Scholar]
- 2.Croce CM. Causes and consequences of microRNA dysregulation in cancer. Nat. Rev. Genet. 2009;10:704–714. doi: 10.1038/nrg2634. [DOI] [PMC free article] [PubMed] [Google Scholar]
- 3.Esquela-Kerscher A, Slack FJ. Oncomirs—microRNAs with a role in cancer. Nat. Rev. Cancer. 2006;6:259–269. doi: 10.1038/nrc1840. [DOI] [PubMed] [Google Scholar]
- 4.Calin GA, Sevignani C, Dumitru CD, Hyslop T, Noch E, Yendamuri S, Shimizu M, Rattan S, Bullrich F, Negrini M, et al. Human microRNA genes are frequently located at fragile sites and genomic regions involved in cancers. Proc. Natl Acad. Sci. USA. 2004;101:2999–3004. doi: 10.1073/pnas.0307323101. [DOI] [PMC free article] [PubMed] [Google Scholar]
- 5.Guo H, Ingolia NT, Weissman JS, Bartel DP. Mammalian microRNAs predominantly act to decrease target mRNA levels. Nature. 466:835–840. doi: 10.1038/nature09267. [DOI] [PMC free article] [PubMed] [Google Scholar]
- 6.Mangan S, Alon U. Structure and function of the feed-forward loop network motif. Proc. Natl Acad. Sci. USA. 2003;100:11980–11985. doi: 10.1073/pnas.2133841100. [DOI] [PMC free article] [PubMed] [Google Scholar]
- 7.Tsang J, Zhu J, van Oudenaarden A. MicroRNA-mediated feedback and feedforward loops are recurrent network motifs in mammals. Mol. Cell. 2007;26:753–767. doi: 10.1016/j.molcel.2007.05.018. [DOI] [PMC free article] [PubMed] [Google Scholar]
- 8.O’Donnell KA, Wentzel EA, Zeller KI, Dang CV, Mendell JT. c-Myc-regulated microRNAs modulate E2F1 expression. Nature. 2005;435:839–843. doi: 10.1038/nature03677. [DOI] [PubMed] [Google Scholar]
- 9.He L, He X, Lim LP, de Stanchina E, Xuan Z, Liang Y, Xue W, Zender L, Magnus J, Ridzon D, et al. A microRNA component of the p53 tumour suppressor network. Nature. 2007;447:1130–1134. doi: 10.1038/nature05939. [DOI] [PMC free article] [PubMed] [Google Scholar]
- 10.Li X, Cassidy JJ, Reinke CA, Fischboeck S, Carthew RW. A microRNA imparts robustness against environmental fluctuation during development. Cell. 2009;137:273–282. doi: 10.1016/j.cell.2009.01.058. [DOI] [PMC free article] [PubMed] [Google Scholar]
- 11.Shalgi R, Brosh R, Oren M, Pilpel Y, Rotter V. Coupling transcriptional and post-transcriptional miRNA regulation in the control of cell fate. Aging. 2009;1:762–770. doi: 10.18632/aging.100085. [DOI] [PMC free article] [PubMed] [Google Scholar]
- 12.El Baroudi M, Cora D, Bosia C, Osella M, Caselle M. A curated database of miRNA mediated feed-forward loops involving MYC as master regulator. PLoS One. 2011;6:e14742. doi: 10.1371/journal.pone.0014742. [DOI] [PMC free article] [PubMed] [Google Scholar]
- 13.Friard O, Re A, Taverna D, De Bortoli M, Cora D. CircuitsDB: a database of mixed microRNA/transcription factor feed-forward regulatory circuits in human and mouse. BMC Bioinformatics. 2010;11:435. doi: 10.1186/1471-2105-11-435. [DOI] [PMC free article] [PubMed] [Google Scholar]
- 14.McLendon R, Friedman A, Bigner D, Van Meir EG, Brat DJ, Mastrogianakis GM, Olson JJ, Mikkelsen T, Lehman N, Aldape K, et al. Comprehensive genomic characterization defines human glioblastoma genes and core pathways. Nature. 2008;455:1061–1068. doi: 10.1038/nature07385. [DOI] [PMC free article] [PubMed] [Google Scholar]
- 15.Hudson TJ, Anderson W, Artez A, Barker AD, Bell C, Bernabe RR, Bhan MK, Calvo F, Eerola I, Gerhard DS, et al. International network of cancer genome projects. Nature. 2010;464:993–998. doi: 10.1038/nature08987. [DOI] [PMC free article] [PubMed] [Google Scholar]
- 16.Fulci V, Colombo T, Chiaretti S, Messina M, Citarella F, Tavolaro S, Guarini A, Foa R, Macino G. Characterization of B- and T-lineage acute lymphoblastic leukemia by integrated analysis of MicroRNA and mRNA expression profiles. Genes Chromosomes Cancer. 2009;48:1069–1082. doi: 10.1002/gcc.20709. [DOI] [PubMed] [Google Scholar]
- 17.Qin LX. An integrative analysis of microRNA and mRNA expression—a case study. Cancer Inform. 2008;6:369–379. doi: 10.4137/cin.s633. [DOI] [PMC free article] [PubMed] [Google Scholar]
- 18.Guo AY, Sun J, Jia P, Zhao Z. A novel microRNA and transcription factor mediated regulatory network in schizophrenia. BMC Syst. Biol. 4:10. doi: 10.1186/1752-0509-4-10. [DOI] [PMC free article] [PubMed] [Google Scholar]
- 19.Shalgi R, Lieber D, Oren M, Pilpel Y. Global and local architecture of the mammalian microRNA-transcription factor regulatory network. PLoS Comput. Biol. 2007;3:e131. doi: 10.1371/journal.pcbi.0030131. [DOI] [PMC free article] [PubMed] [Google Scholar]
- 20.Re A, Cora D, Taverna D, Caselle M. Genome-wide survey of microRNA-transcription factor feed-forward regulatory circuits in human. Mol. Biosyst. 2009;5:854–867. doi: 10.1039/b900177h. [DOI] [PMC free article] [PubMed] [Google Scholar]
- 21.Lenhard B, Wasserman WW. TFBS: computational framework for transcription factor binding site analysis. Bioinformatics. 2002;18:1135–1136. doi: 10.1093/bioinformatics/18.8.1135. [DOI] [PubMed] [Google Scholar]
- 22.Kozomara A, Griffiths-Jones S. miRBase: integrating microRNA annotation and deep-sequencing data. Nucleic Acids Res. 2011;39:D152–D157. doi: 10.1093/nar/gkq1027. [DOI] [PMC free article] [PubMed] [Google Scholar]
- 23.Kim YK, Kim VN. Processing of intronic microRNAs. EMBO J. 2007;26:775–783. doi: 10.1038/sj.emboj.7601512. [DOI] [PMC free article] [PubMed] [Google Scholar]
- 24.Lagos-Quintana M, Rauhut R, Lendeckel W, Tuschl T. Identification of novel genes coding for small expressed RNAs. Science. 2001;294:853–858. doi: 10.1126/science.1064921. [DOI] [PubMed] [Google Scholar]
- 25.Rajewsky N. microRNA target predictions in animals. Nat. Genet. 2006;38(Suppl.):S8–S13. doi: 10.1038/ng1798. [DOI] [PubMed] [Google Scholar]
- 26.Kertesz M, Iovino N, Unnerstall U, Gaul U, Segal E. The role of site accessibility in microRNA target recognition. Nat. Genet. 2007;39:1278–1284. doi: 10.1038/ng2135. [DOI] [PubMed] [Google Scholar]
- 27.Sethupathy P, Megraw M, Hatzigeorgiou AG. A guide through present computational approaches for the identification of mammalian microRNA targets. Nat. Methods. 2006;3:881–886. doi: 10.1038/nmeth954. [DOI] [PubMed] [Google Scholar]
- 28.Selbach M, Schwanhausser B, Thierfelder N, Fang Z, Khanin R, Rajewsky N. Widespread changes in protein synthesis induced by microRNAs. Nature. 2008;455:58–63. doi: 10.1038/nature07228. [DOI] [PubMed] [Google Scholar]
- 29.Baek D, Villen J, Shin C, Camargo FD, Gygi SP, Bartel DP. The impact of microRNAs on protein output. Nature. 2008;455:64–71. doi: 10.1038/nature07242. [DOI] [PMC free article] [PubMed] [Google Scholar]
- 30.Barrett T, Troup DB, Wilhite SE, Ledoux P, Evangelista C, Kim IF, Tomashevsky M, Marshall KA, Phillippy KH, Sherman PM, et al. NCBI GEO: archive for functional genomics data sets—10 years on. Nucleic Acids Res. 2011;39:D1005–D1010. doi: 10.1093/nar/gkq1184. [DOI] [PMC free article] [PubMed] [Google Scholar]
- 31.Parkinson H, Sarkans U, Kolesnikov N, Abeygunawardena N, Burdett T, Dylag M, Emam I, Farne A, Hastings E, Holloway E, et al. ArrayExpress update—an archive of microarray and high-throughput sequencing-based functional genomics experiments. Nucleic Acids Res. 2011;39:D1002–D1004. doi: 10.1093/nar/gkq1040. [DOI] [PMC free article] [PubMed] [Google Scholar]
- 32.Burchard J, Zhang C, Liu AM, Poon RT, Lee NP, Wong KF, Sham PC, Lam BY, Ferguson MD, Tokiwa G, et al. microRNA-122 as a regulator of mitochondrial metabolic gene network in hepatocellular carcinoma. Mol. Syst. Biol. 2010;6:402. doi: 10.1038/msb.2010.58. [DOI] [PMC free article] [PubMed] [Google Scholar]
- 33.Liu H, Brannon AR, Reddy AR, Alexe G, Seiler MW, Arreola A, Oza JH, Yao M, Juan D, Liou LS, et al. Identifying mRNA targets of microRNA dysregulated in cancer: with application to clear cell Renal Cell Carcinoma. BMC Syst. Biol. 2010;4:51. doi: 10.1186/1752-0509-4-51. [DOI] [PMC free article] [PubMed] [Google Scholar]
- 34.Taylor BS, Schultz N, Hieronymus H, Gopalan A, Xiao Y, Carver BS, Arora VK, Kaushik P, Cerami E, Reva B, et al. Integrative genomic profiling of human prostate cancer. Cancer Cell. 2010;18:11–22. doi: 10.1016/j.ccr.2010.05.026. [DOI] [PMC free article] [PubMed] [Google Scholar]
- 35.Palmer RD, Murray MJ, Saini HK, van Dongen S, Abreu-Goodger C, Muralidhar B, Pett MR, Thornton CM, Nicholson JC, Enright AJ, et al. Malignant germ cell tumors display common microRNA profiles resulting in global changes in expression of messenger RNA targets. Cancer Res. 2010;70:2911–2923. doi: 10.1158/0008-5472.CAN-09-3301. [DOI] [PMC free article] [PubMed] [Google Scholar]
- 36.Puissegur MP, Mazure NM, Bertero T, Pradelli L, Grosso S, Robbe-Sermesant K, Maurin T, Lebrigand K, Cardinaud B, Hofman V, et al. miR-210 is overexpressed in late stages of lung cancer and mediates mitochondrial alterations associated with modulation of HIF-1 activity. Cell Death Differ. 2011;18:465–478. doi: 10.1038/cdd.2010.119. [DOI] [PMC free article] [PubMed] [Google Scholar]
- 37.Yanaihara N, Caplen N, Bowman E, Seike M, Kumamoto K, Yi M, Stephens RM, Okamoto A, Yokota J, Tanaka T, et al. Unique microRNA molecular profiles in lung cancer diagnosis and prognosis. Cancer Cell. 2006;9:189–198. doi: 10.1016/j.ccr.2006.01.025. [DOI] [PubMed] [Google Scholar]
- 38.Fujiwara T, Hiramatsu M, Isagawa T, Ninomiya H, Inamura K, Ishikawa S, Ushijima M, Matsuura M, Jones MH, Shimane M, et al. ASCL1-coexpression profiling but not single gene expression profiling defines lung adenocarcinomas of neuroendocrine nature with poor prognosis. Lung Cancer. 2012;75:119–125. doi: 10.1016/j.lungcan.2011.05.028. [DOI] [PubMed] [Google Scholar]
- 39.Wang J, Lu M, Qiu C, Cui Q. TransmiR: a transcription factor-microRNA regulation database. Nucleic Acids Res. 2010;38:D119–D122. doi: 10.1093/nar/gkp803. [DOI] [PMC free article] [PubMed] [Google Scholar]
- 40.Cho WC. OncomiRs: the discovery and progress of microRNAs in cancers. Mol. Cancer. 2007;6:60. doi: 10.1186/1476-4598-6-60. [DOI] [PMC free article] [PubMed] [Google Scholar]
- 41.Garzon R, Marcucci G, Croce CM. Targeting microRNAs in cancer: rationale, strategies and challenges. Nat. Rev. Drug Discov. 9:775–789. doi: 10.1038/nrd3179. [DOI] [PMC free article] [PubMed] [Google Scholar]
- 42.Hanahan D, Weinberg RA. Hallmarks of cancer: the next generation. Cell. 144:646–674. doi: 10.1016/j.cell.2011.02.013. [DOI] [PubMed] [Google Scholar]
- 43.Meyer N, Penn LZ. Reflecting on 25 years with MYC. Nat. Rev. Cancer. 2008;8:976–990. doi: 10.1038/nrc2231. [DOI] [PubMed] [Google Scholar]
- 44.Dews M, Homayouni A, Yu D, Murphy D, Sevignani C, Wentzel E, Furth EE, Lee WM, Enders GH, Mendell JT, et al. Augmentation of tumor angiogenesis by a Myc-activated microRNA cluster. Nat. Genet. 2006;38:1060–1065. doi: 10.1038/ng1855. [DOI] [PMC free article] [PubMed] [Google Scholar]
- 45.Mestdagh P, Fredlund E, Pattyn F, Schulte JH, Muth D, Vermeulen J, Kumps C, Schlierf S, De Preter K, Van Roy N, et al. MYCN/c-MYC-induced microRNAs repress coding gene networks associated with poor outcome in MYCN/c-MYC-activated tumors. Oncogene. 29:1394–1404. doi: 10.1038/onc.2009.429. [DOI] [PubMed] [Google Scholar]
- 46.Liang Y, Li WW, Yang BW, Tao ZH, Sun HC, Wang L, Xia JL, Qin LX, Tang ZY, Fan J, et al. Aryl hydrocarbon receptor nuclear translocator is associated with tumor growth and progression of hepatocellular carcinoma. Int. J. Cancer. 2012;130:1745–1754. doi: 10.1002/ijc.26166. [DOI] [PubMed] [Google Scholar]
- 47.Xiao X, Li BX, Mitton B, Ikeda A, Sakamoto KM. Targeting CREB for cancer therapy: friend or foe. Curr. Cancer Drug Targets. 10:384–391. doi: 10.2174/156800910791208535. [DOI] [PMC free article] [PubMed] [Google Scholar]
- 48.Aggarwal S, Kim SW, Ryu SH, Chung WC, Koo JS. Growth suppression of lung cancer cells by targeting cyclic AMP response element-binding protein. Cancer Res. 2008;68:981–988. doi: 10.1158/0008-5472.CAN-06-0249. [DOI] [PMC free article] [PubMed] [Google Scholar]
- 49.Kumar AP, Bhaskaran S, Ganapathy M, Crosby K, Davis MD, Kochunov P, Schoolfield J, Yeh IT, Troyer DA, Ghosh R. Akt/cAMP-responsive element binding protein/cyclin D1 network: a novel target for prostate cancer inhibition in transgenic adenocarcinoma of mouse prostate model mediated by Nexrutine, a Phellodendron amurense bark extract. Clin. Cancer Res. 2007;13:2784–2794. doi: 10.1158/1078-0432.CCR-06-2974. [DOI] [PMC free article] [PubMed] [Google Scholar]
Associated Data
This section collects any data citations, data availability statements, or supplementary materials included in this article.