

Abstract
Some naturally competent bacteria exhibit both a strong preference for DNA fragments containing specific ‘uptake sequences’ and dramatic overrepresentation of these sequences in their genomes. Uptake sequences are often assumed to directly reflect the specificity of the DNA uptake machinery, but the actual specificity has not been well characterized for any bacterium. We produced a detailed analysis of Haemophilus influenzae’s uptake specificity, using Illumina sequencing of degenerate uptake sequences in fragments recovered from competent cells. This identified an uptake motif with the same consensus as the motif overrepresented in the genome, with a 9 bp core (AAGTGCGGT) and two short flanking T-rich tracts. Only four core bases (GCGG) were critical for uptake, suggesting that these make strong specific contacts with the uptake machinery. Other core bases had weaker roles when considered individually, as did the T-tracts, but interaction effects between these were also determinants of uptake. The properties of genomic uptake sequences are also constrained by mutational biases and selective forces acting on USSs with coding and termination functions. Our findings define constraints on gene transfer by natural transformation and suggest how the DNA uptake machinery overcomes the physical constraints imposed by stiff highly charged DNA molecules.
INTRODUCTION
DNA-protein interactions are fundamental to biology, and defining their sequence specificities has been essential to understanding their functions. Most DNA-protein interactions occur inside the cell, between chromosomal DNA and regulatory proteins, but in many bacteria they also occur at the cell surface during DNA uptake. Such naturally competent bacteria can transport environmental DNA across the cell envelope into the cytoplasm and, when sequence identity permits, incorporate this DNA into their chromosomes by homologous recombination (1,2). In some species the DNA uptake machinery has a remarkably strong bias for specific 9–12 bp sequences, and these uptake sequences have accumulated in the genome to high densities over evolutionary time (about 1/kb (3)). The function of uptake specificity remains poorly understood, although uptake sequences have been thoroughly characterized in the genomes of Neisseria and Haemophilus species and their accumulation over evolutionary time has been modelled by simulation (3–9).
Sequence specificity acts at the initial steps of DNA uptake by Gram-negative bacteria, when DNA fragments are bound and transported across the outer membrane, pulled through type II secretin pores by the retraction of type IV pseudopili (1,10) (Figure 1A). There is no evidence for sequence biases at the subsequent steps—translocation of single-stranded DNA across the inner membrane and degradation or recombination of this DNA in the cytoplasm. Uptake of fragments with consensus uptake sequences is at least 10–100 times more efficient than uptake of control fragments (11–14). Although specificity could be due to a dedicated DNA receptor on the cell surface, searches for a USS-binding protein in Haemophilus influenzae have not yet been successful, and specificity might instead arise from interactions between DNA and multiple components of the uptake machinery.
Figure 1.

DNA uptake and the H. influenzae USS. (A) Mechanism of DNA uptake: uptake initiates at USSs (pink) when type IV pseudopili retract to pull double-stranded DNA through type II secretin pores into the periplasm. Rec2/ComF then translocates a single DNA strand through the inner membrane into the cytoplasm, where DNA is either degraded and reused or recombined with the chromosome. (B) Diagram of the canonical USS consisting of a 9 bp core flanked by two helically phased T-rich tracts.
Uptake biases were initially discovered in H. influenzae and Neisseria gonorrhoeae as preferential uptake of their own DNA over that of unrelated species (10,15). This was followed by identification of specific 9 and 12 bp sequences preferred by their respective uptake machineries and common in their genomes (7,13,16–18). Once genome sequences became available, experimental studies of uptake biases were set aside in favour of analysis of sequences overrepresented in genomes (3,8,9,14,19,20). These revealed an H. influenzae uptake signal sequence (the USS) whose extended consensus includes two helically phased T-rich tracts flanking one side of the previously identified 9-bp core sequence (Figure 1B); the Neisseria equivalent (the DUS, or DNA uptake sequence) is a simpler 12 bp motif (8,9). Genomic uptake sequences are tolerated in many protein-coding genes, and many others have been co-opted to function in pairs as rho-independent transcription terminators (21,22).
A detailed understanding of uptake specificity matters for several reasons. First, natural transformation makes important contributions to bacterial genome evolution, and biases in DNA uptake complicate investigations of how sequence divergence and recombination hotspots affect horizontal gene transfer (23). These cannot be accounted for until the actual uptake specificity is known. Second, understanding the mechanism of DNA uptake requires understanding its sequence biases. DNA is the only macromolecule actively taken up by bacterial cells, but little is known about how cells overcome the physical obstacles this presents. DNA molecules are large and inflexible (24), and their strong negative charge is repelled by the cell surface and is a barrier to passage through hydrophobic membranes. The known uptake specificities of Pasteurellaceae and Neisseria may be extreme manifestations of more general mechanistic constraints on DNA uptake by naturally competent bacteria (e.g. in Helicobacter (25,26)). Third, uptake biases are often thought to have evolved to promote preferential uptake of same-species DNA, but the relative importance of selection for genetic exchange and mechanistic constraints on uptake cannot be resolved until the molecular basis of uptake specificity is understood (9,14,20,27–29).
In this context it is illuminating to compare uptake sequences to transcription factor binding sites. Though both originate by random mutations in chromosomal DNA, they accumulate by very different processes. Unlike transcription factor binding sites, uptake sequences have not evolved to optimize gene expression, but instead are thought to accumulate at least partly as an indirect consequence of uptake bias and homologous recombination, because variants that confer stronger uptake are transmitted to new cells more frequently than other variants (4–6,9). This accumulation in turn promotes uptake of homologous sequences and thus genetic exchange. One long-term goal of our work is to clarify the extent that selection for genetic exchange has contributed to uptake bias and the accumulation of preferred sequences in the genome.
The correspondence between the experimentally identified uptake sequence and the overrepresented genomic motif is much too strong to be a coincidence, and our previous work has confirmed that uptake bias alone can drive its preferred sequences to high frequency in the genome. Although this model predicts that the sequences accumulated in the genome should mirror the uptake bias, our previous experimental studies found that positions with equally strong consensuses in the genomic motif did not make comparable contributions to uptake (6,9). However, these studies only tested ten variants each differing from the consensus USS by a single base, and two differing by two bases. Below we report the use of deep sequencing experiments to provide a direct comprehensive characterization of H. influenzae’s uptake specificity. Our novel method will be directly applicable to measuring uptake biases in other organisms and provides a new approach to identifying the unknown cell surface factors responsible.
MATERIALS AND METHODS
Strains, DNA fragments and uptake assays
This work used the standard H. influenzae Rd strain KW20 (RR722) and a rec-2 mutant derivative (RR622) (30,31). Initial experiments used as input 222 bp PCR (Polymerase chain reaction) amplicons containing the consensus USS or derivatives, as previously described (9,32). Subsequent experiments used pools of 200 bp fragments containing the consensus USS and flanking Illumina priming sites; these were produced by annealing two long oligos, extending with Pfu, and performing 14 rounds of PCR. Oligonucleotides used for fragment construction are listed in Supplementary Table S1. DNA fragments were labelled by primer extension with 33P-dATP using exo- Klenow polymerase and were incubated with cultures that had been made competent by the standard MIV procedure (0.2–1 ml) for 5, 30 or 60 min (32,33). Cells were then pelleted, stringently washed twice in 1 volume ice-cold MIV and twice in 1 volume ice-cold 10 mM Tris pH 8 10 mM EDTA (T10E10) plus 1.5 M CsCl, and finally resuspended in 1 volume of either T10E10 (for total DNA extractions) or T10E10/1.5 CsCl (for periplasmic DNA purifications). The high salt washes dislodged most or all the DNA adsorbed to the cell surface (36,37). DNase I was omitted from the washes to avoid the risk that that DNase I carried over into the periplasmic DNA preparation would degrade periplasmic fragments. Uptake was calculated from pellet-associated radioactive counts per minute (CPM) compared with total input CPM (combined counts of pellet, supernatant and washes).
DNA purifications
Total DNA was purified by standard lysis, phenol/chloroform extraction and ethanol precipitation (34,35). To purify DNA from the periplasm, Kahn et al.’s organic extraction method was used (36,37). Cell pellets resuspended in T10E10/1.5 M CsCl were extracted with 1 volume phenol/acetone (1:1) (note that the aqueous phase is on the bottom). This partitions periplasmic DNA into the aqueous layer and chromosomal DNA along with bulk cell debris to the interface, whereas the organic phase has little to no DNA. Instead of using dialysis to recover the aqueous phase, it was extracted in 1 volume chloroform to remove residual phenol:acetone (which also switches the aqueous phase to the top layer). DNA was then further purified by RNase A treatment, standard phenol/chloroform extraction and ethanol precipitation, and a final silica column clean-up step (Qiagen). For detection of intact input DNA and labelled chromosomal DNA, samples were separated by electrophoresis on 0.6% agarose gels, which were dried under vacuum at 55°C before exposure to a phosphor screen. For re-uptake experiments and sequencing, 25 pg (∼1 × 10⁸ fragments) of recovered and input DNA were amplified by 10 stringent PCR cycles and purified by silica column.
DNA sequencing and data processing
The input and recovered samples were used directly for cluster synthesis and subsequent single-end sequencing with the Illumina GA2 (38). Raw data were processed through Cassava v1.6 using the phi179 control lane for phasing correction (Bustard option–control-lane) due to the extreme position-specific biases of the samples. The resulting FastQ files were converted to unmapped BAM files using Picard’s fastqToSam v1.48 (also changing the original Illumina 1.4 base quality encoding to version 1.5+) (http://picard.sourceforge.net/), and SAMtools v0.1.16 was used to work with the compressed files on a stream (39). Read filtering, base counts and mismatch counts were performed using standard UNIX utilities, especially awk. Subsequent analyses used R, including the add-on packages RColorBrewer (40) and a modification of seqLogo (41). The sequence reads are available as unmapped BAM files from the NCBI short-read archive under project accession SRP012938.
Position-specific scoring matrices
Position-specific scoring matrices normally assume a ‘background’ with identical base composition at all positions (42,43), but our input dataset failed to meet this criterion, both because the degenerate pool was designed to have 76% of the consensus base at each position, and because this intended degeneracy was not uniformly seen in the actual input pool. To account for these issues we instead developed a scaled position-weight matrix. The first step was to create a matrix giving the fraction of input fragments that had been taken up with each base i at each position j, using position-specific base counts in the input (B) and uptake (P) datasets. This was done by multiplying each pij/bij ratio by u = 0.062, the fraction of the total input pool that was taken up. Normalization for the base compositions of the two datasets at each position then gives the elements of the scaled position weight matrix S:
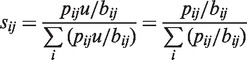 |
The resulting S matrix models the expected position-specific biases of recovered fragments as if they had been drawn from a fully randomized input pool.
Applying Shannon’s uncertainty then provides a scaled position-specific scoring matrix R with elements:
The subscript j for N is included for calculating the information content for subsets of the sequences, where certain positions are conditioned against having specific bases (for example in the subsets of the recovered and input sequence reads that have any non-consensus base at a particular position j, Nj = 3, instead of the usual 4.)
To test for dependencies between pairs of positions, subsets of reads with non-consensus bases at each focal position were extracted from the recovered and input datasets, and new R matrices were calculated. Changes in information content at non-focal positions compared the total dataset were taken to indicate pairwise positional dependencies.
Sequencing error and contamination
To check for underestimation of uptake biases due to sequencing error, we assumed that substitution errors arising during sequencing were randomly distributed. The relationship between position-specific base frequencies in the reads and those in the fragments can then be described as: yij = xij (1 − ej) + (1 − xij) ej/3; where yij is the observed frequency of a base i at a particular position j in the sequence reads, xij is the corrected frequency of that base in the DNA fragments that were sequenced, and ej is the position-specific error rate. Note that only ej ≤ 3ymin(i)j give realistic solutions. Solving for x then gives: xij = (3yij − ej)/(3 − 4ej).
Similar logic was used to account for the potential effect of contaminating input DNA fragments in the recovered pool. If a small fraction c of sequence reads from the recovered pool were contaminating input fragments, then: pij = (rij − bij c)/(1 − c); where rij is the observed frequency of base i at position j in the recovered fragments, pij is the true frequency for taken up fragments, and bij is the frequency for the input fragments. Only when c ≤ min(rij/bij) does this give realistic values.
For the 32 mismatch subsets used for the dependency/interaction analysis, different subsets were potentially affected by contamination to different degrees, depending on how small that mismatch subset was. To correct for variable degrees of contamination in sets of reads with specific mismatches, subset-specific contamination cj was calculated as: cj = (pmax(i) j − rmax(i) j)/(1 − rmax(i) j).
Scoring sequences with the motif models and Gibbs recursive sampling
Sequence reads and the H. influenzae Rd KW20 complete genome sequence (NCBI accession: NC_000907.1) were scored using the position-specific scoring matrices derived from the uptake experiment (the uptake bias motif model) and from Gibbs motif sampling the genome sequence (the genomic USS motif model, as in (9)). All 32 base sequences were scored on both strands, also accounting for the genome’s circularity. Scores were then normalized to between 0 and 100 based on the minimum and maximum possible bit scores for each motif, or 100 × (bits – minbits) / (maxbits – minbits). For scoring in non-standard alignments, the unsequenced portion each fragment was assumed to be error-free. For determining genomic sites that fit a given motif model, we selected the top 2000 sites. Coding and non-coding gene coordinates were obtained from the UCSC Table Browser (http://microbes.ucsc.edu/cgi-bin/hgTables), and the coordinates of high-confidence transcriptional terminators were obtained from the Supplementary Material of (21). The utility intersectBed (44) was used to identify genomic sites that overlapped with these genomic features. Gibbs recursive sampler searches were also performed as previously described (9,45).
RESULTS
Overview of experimental design
We dissected competent cells’ preference for the USS in a massively parallel experiment in which a complex pool of dsDNA fragments was incubated with a culture of competent cells. The fragments that these cells took up were recovered, sequenced and analyzed (Figure 2A–C).
Figure 2.

Uptake and re-uptake of a degenerate USS pool. (A–C) Experimental overview: a pool of ∼2.6 × 10¹¹ DNA fragments (A) with degenerate USSs was incubated (B) with ∼109 competent cells. DNA that had been taken up (C, ∼1.6 × 10¹⁰ fragments) was purified from the cells’ periplasm. Darker red fragments represent those containing more preferred sequences. (D) Uptake by rec-2 cultures (30 min incubation) of: blue circles, DNA fragments with the consensus USS; red squares, the input degenerate pool; and green diamonds and triangles, reuptake of DNA fragments purified from recovered periplasmic pools from cells incubated with 32 and 256 fragments/cell, respectively. (E) Autoradiogram showing total and periplasmic DNA recovered by organic extractions from wt and rec-2 cultures after 5 min uptake (128 USS fragments/cell). The aqueous fraction of periplasmic extractions retains intact fragments but not labelled chromosomal DNA. (F) The degenerate pool was made by annealing and extending two oligos, followed by PCR; green arrows indicate fixed sequences containing priming sites for single-end Illumina sequencing. (G) The 42-nt reads spanned the 32-nt degenerate USS (24%/position), as well as control flanking bases of 4- and 6-nt.
Uptake of DNA fragments by naturally competent cells and the recovery of periplasmic DNA
We used organic extractions from cells carrying a rec2 mutation to recover DNA fragments after uptake by competent cells. The rec2 mutation prevents degradation of dsDNA by blocking its translocation from the periplasm to the cytoplasm (36,37); competent cultures of both wild-type and rec2 cells efficiently took up 33P-labelled 222-bp test fragments containing a 32 bp sequence containing the 29 bp consensus USS (Figure 2D blue line, Supplementary Figure S1). As previously reported, test fragments remained intact in rec2 cells but were degraded in wild-type cells, with free nucleotides incorporated into the chromosome by DNA replication (Figure 2E lanes 2–3, Supplementary Figure S1) (37,46). The organic extraction method of Kahn et al. (36) successfully partitioned periplasmic DNA into the aqueous phase, while trapping cell debris and bulk chromosomal DNA at the interface (Figure 2E lanes 4–5, Supplementary Figure S1). Final post-purification recovery of periplasmic DNA from rec-2 cultures was typically 75–85% of total uptake.
Design and preparation of a complex pool containing USS variants
To provide a complex mixture of USS variants for a detailed characterization of specificity, we designed and synthesized a pool of 200 bp fragments containing degenerate versions of the consensus USS (Figure 2F–G, Supplementary Table S1). Adapter sequences included at fragment ends allowed direct DNA sequencing using an Illumina GA2 instrument, obviating later library construction steps and ensuring that chromosomal DNA would not be inadvertently sequenced (Figure 2F). The 24% degeneracy at each of the 32 consensus USS bases was chosen as a trade-off between practicality and sensitivity: lower degeneracy would give high recovery but reduce the complexity of the pool, whereas the high complexity of a fully random pool would come at the cost of low recovery and a consequent increased sensitivity to experimental artefacts.
Uptake and re-uptake of the degenerate USS pool
To confirm that uptake of the newly designed synthetic fragments depended on their USS, fragments containing non-degenerate versions of the USS were tested first. Substitution of the cytosine with adenine at position 8 of the USS (C8A) reduced uptake to 10.4% of consensus levels, whereas an A4G substitution reduced uptake to 51.4% of consensus levels, consistent with previous results (6,9). Randomization of the sequence reduced apparent uptake to 0.2% of consensus levels; this residual cell-associated DNA could be due to non-specific uptake by competent cells but also to carry-over contamination by input DNA fragments.
Dependence of uptake on the USS was further demonstrated by comparing uptake of the degenerate pool to uptake of fragments with the consensus sequence (Figure 2D red line). Uptake was 8- to 12-fold lower with the degenerate pool over a wide range of input DNA concentrations (16–320 input fragments per competent cell), confirming that uptake efficiency was reduced due to mismatches from consensus (4–9 mismatches expected for most fragments, confirmed below).
We showed that these cells had selectively taken up fragments with preferred USS variants, using experiments analyzing re-uptake of the degenerate periplasmic DNA recovered from rec-2 competent cultures. For re-uptake assays, periplasmic fragments were recovered from cells incubated with DNA at concentrations of 256 or 32 fragments per cell (Figure 2D, Supplementary Figure S1) and 33P-labelled. Competent cells took up recovered DNA fragments ∼4-fold more efficiently than the input fragments, demonstrating that uptake by the original cultures had indeed selected for preferred fragments (Figure 2D green and light green lines). However recovered fragments were taken up only half as efficiently as consensus fragments, demonstrating that the recovered pools still contained many fragments with suboptimal USSs. The control experiment, recovery and re-uptake of the consensus USS fragment, showed that uptake and recovery did not introduce modifications that altered fragments’ subsequent re-uptake (Figure 2D and Supplementary Figures S1 and S2).
Deep sequencing of the USS variants in the input and recovered DNA pools
The input pool and a periplasmic pool recovered from cells given 256 fragments/cell were sequenced to high depth, each on a single lane of an Illumina flow cell (38). Each lane yielded more than 1.3 × 10⁷ reads of 42 bases (Table 1), each read encompassing the 32 base degenerate USS and 10 non-degenerate control bases, 4 at the beginning and 6 at the end (Figure 2G). Two filters were applied to the raw reads. The first excluded all reads that contained ambiguous bases (Ns), whereas the second excluded those that had mismatches from consensus at any of the 10 control positions. Together these filters removed more than 20% of the reads from each dataset. More stringent base quality filters gave nearly identical results to those described below (not shown). In addition to eliminating low quality reads with base-call errors, the second filter also removed many misaligned reads caused by apparent insertions and deletions that shifted the target sequence to the left or right. These comprised ∼10% of the input reads and ∼7% of the recovered reads (Supplementary Table S2) and likely arose during synthesis of the input fragment pool and as phasing errors during sequencing.
Table 1.
Summary of sequencing and read filters
| Classification of sequenced fragments | Input | Recovered |
|---|---|---|
| Total estimated number of fragments | 3.2 × 10¹¹ | 2.0 × 10¹⁰ |
| Total sequence reads collected | 16 832 020 | 13 182 532 |
| Reads containing one or more ambiguous bases (Ns) | 155 685 | 1 377 090 |
| Reads lacking perfect matches to 10 control bases | 2 302 554 | 1 595 647 |
| Reads passing both filters | 14 373 781 | 10 209 795 |
| Reads in final sampled datasets | 10 000 000 | 10 000 000 |
Sequencing errors at degenerate positions could not be directly measured, so their impact was estimated indirectly from the substitution frequencies at the flanking non-degenerate control positions. For each of the 10 control positions, error was estimated from the frequency of base substitutions in reads where the other 9 control bases were correct. These position-specific error rates ranged from 0.04% to 1.50% errors/base with a median of 0.31% (Supplementary Figure S3), and agreed well with the unfiltered error rate of 0.44%/base determined from the control sequencing lane (PhiX genomic DNA) run in parallel on the same Illumina flow cell. The true sequencing error rate in the filtered datasets may have been lower than these estimates, since some base substitutions had likely been introduced during oligo synthesis and construction of the input pool. Finally, random sampling was used to reduce the size of each dataset to 107 reads (Table 1). The reads from the input pool were extremely diverse, containing 9.3 × 10⁶ distinct sequences, confirming that the steps generating the input pool contained no substantial bottlenecks (Supplementary Table S3).
Effects of USS mismatches on DNA uptake
Analysis of the sequence reads confirmed the high selectivity of competent cells for fragments well matched to the USS consensus. The recovered reads were enriched for variants with 0–5 mismatches from the consensus and depleted of those with more than 6, reducing the number of distinct sequences from 9.3 × 10⁶ to 5.5 × 10⁶ (Figure 3A, Supplementary Table S3). Reads perfectly matching the 32 bp consensus were enriched 8.4-fold (135 070 recovered versus 16 047 input). Since 6.2% of the input fragments had been taken up, this implies that ∼50% of all fragments with the consensus USS were taken up from the original input pool, whereas reads with increasing numbers of mismatches from consensus were taken up with decreasing efficiently (Figure 3B). These results show that the consensus USS was highly preferred even at its very low input frequency of 2 × 10⁻⁴/fragment.
Figure 3.

Effect of mismatches on uptake efficiency. (A) Histogram of input reads (grey) and recovered reads (green) with different numbers of mismatches from consensus. Inset shows the input in grey and the binomial expectation for 24% degeneracy as a black line. (B) Estimated % recovery of fragments with different numbers of mismatches; red line shows total uptake of 6.2%. (C) and (D) Frequency of reads with mismatches from consensus at each position in the input reads (C) and recovered reads (D). (E) Estimated % recovery of fragments with mismatches at the indicated position; red line shows total uptake.
We next analyzed the effects of individual bases on uptake. Figure 3C–E show that four positions form an inner core USS (5′-GCGG-3′, positions 7–10) especially crucial for efficient uptake, and that other core positions (the outer core) and two T-tracts make important but smaller contributions. Figure 3C shows the overall 24% degeneracy of the input reads and reveals a minor across-position skew in favour of Gs and against Cs; this was unintended and likely arose during oligo synthesis (Supplementary Figure S4). Figure 3D shows the same analysis for recovered reads, revealing a strong bias against mismatches at some positions, particularly the inner core. Figure 3E shows the relative importance of different positions by plotting the estimated fraction of fragments taken up that contained particular mismatches. Fragments with inner core mismatches were depleted 20–50-fold in the recovered reads, whereas those with outer core and T-tract mismatches were depleted ∼2 to 5-fold.
Figure 4A summarizes the above results using information content as a measure of how distinct recovered reads were from the input reads at each position (42,43). Before the standard information content calculation was done, the distributions of bases at each position of the recovered reads were normalized to those of the input DNA pool (see ‘Materials and Methods’ section). The product of this analysis provides a motif model of uptake specificity, which can be used to quantify the relative importance of each USS position to uptake and to score candidate sequences for their fit to uptake preferences. Such models make the simplifying assumption that each position contributes independently to uptake (see below). Because information content has a direct relationship with entropy, it can in principle also be used to predict the strengths of the physical interactions between DNA-binding proteins and specific candidate DNA sequences (47).
Figure 4.

USS motifs. (A) Logo diagram of the experimentally derived uptake bias motif, using position-specific normalization of base composition in the recovered reads to that of the input reads. (B) Logo diagram of the genomic USS motif derived from 2206 sites in the genome found by the Gibbs recursive sampler.
Effects of sequencing error, contamination and out-of-alignment uptake sequences
We next investigated three potential experimental artefacts that were not addressed by the initial quality filters, finding that each would cause the analysis to have underestimated the true strength of uptake biases, particularly at the four important inner-core positions:
Sequencing errors: At all positions, sequencing errors are expected to decrease the representation of the most common base and increase representation of the others. At positions without bias these errors would not confound the analysis, since errors would have similar distributions in both the input and recovered datasets. At positions with uptake bias, sequencing errors would disproportionately affect the preferred base in the recovered pool, thus causing the true bias to be underestimated. Figure 5A shows how the range of sequencing errors estimated above for control positions (0.04–1.5%) would affect our estimates of information content. At the five positions with highest uptake bias (positions 5, 7–10), the upper limit of error was further capped by the very low frequency of non-consensus bases in the recovered reads.
Figure 5.

Sources of artefact. In (A) and (B), grey bars show measured information content at each position, as in Figure 4A. (A) Vertical lines show the estimated ranges of information content, given random sequencing error ranging from 0.04–1.5% per position. Horizontal hatches show the medians, and red dots show the capped maximum error rates at highly biased positions. (B) Vertical lines show the ranges of information content, given carry-over contamination ranging from 0.2% (observed uptake of a randomized USS fragments) to 1.3% (the maximum possible contamination level). (C) Histogram of normalized scores of recovered (green) and input (grey) reads using the uptake bias motif model. (D) As in (C), but only for those reads with a normalized score in a non-standard alignment exceeding 84.2. In (C) and (D), the arrow shows the threshold score of 84.2.
Carry-over contamination: Although stringent washing conditions were used, the recovered fragment preparation may have included some fragments that had not been taken up into the periplasm. Such contamination would affect each position equally, but would cause uptake specificity to be underestimated, especially at strongly biased positions. The potential effect of contamination was estimated as 0.2% from independent uptake experiments using radiolabelled DNA with a randomized USS. A theoretical upper limit to contamination was set by the lowest observed frequency of recovered reads with non-consensus bases (1.3% for A at position 9). The potential impact of 0.2–1.3% carry-over contamination on information content is shown in Figure 5B.
Uptake signals in non-standard alignments: Because sequence reads were aligned using the fixed bases at the beginning of each read, fragments with many mismatches in the standard alignment frame may have had good uptake sequences in another alignment frame. Although the filtering on fixed bases described above eliminated most fragments whose misalignment was due to insertions or deletions that arose during DNA synthesis or sequencing, it would have missed any remaining changes that misaligned the USS but maintained correct alignment of the 10 fixed bases, and any that contained a de novo uptake sequence.
We identified such out-of-alignment (non-standard) uptake sequences by using the uptake bias motif model to score all reads in all alignments. It was first necessary to define a threshold score that predicted efficient uptake. When scored in the standard alignment, 98% of recovered reads scored >84.2 (scores were scaled from 0–100), whereas only 37% of input reads met this threshold (Figure 5C). We then examined those reads whose score in any non-standard alignment passed this same threshold (Figure 5D). Most of the resulting recovered reads (10 036 of 12 894, right-hand peak in Figure 5D) were found to have two high scoring sequences, one in the standard alignment and a second usually in the reverse orientation with its core positioned between the standard T-tracts. For the remaining 2858 reads, the only high-scoring sequence was in a non-standard alignment, typically shifted by 1–2 positions. Such sequences are enriched 3-fold over their frequency in the input pool, confirming that DNA uptake selected fragments independent of the exact location of their uptake sequence. Although reads with high scoring non-standard alignments were only a small fraction of the datasets, they were removed from both the input and recovered datasets when calculating position-specific base counts in the interaction analysis presented below.
Interaction effects between USS bases
Treating each position as contributing to uptake independently may have oversimplified the true uptake bias, so we next considered whether the bases at different positions in a fragment interacted to determine its probability of uptake, as has been found for some transcription factor binding sites (48–51). Pairwise interactions contributing to DNA uptake were detected by examining whether recovered reads with non-consensus bases at specific ‘focal’ positions had altered base compositions at other positions. This showed the extent to which uptake was promoted by interaction effects between bases at different positions in the USS (detected as ‘positional dependencies’ in the dataset). This analysis used the same measurements of scaled information content described above, and thus corrected for both base compositional biases in the input and the very different sizes of the recovered and input samples in the different mismatch subsets.
Figure 6A shows examples of this analysis for three focal positions that exemplify the types of effects seen, with the grey bars showing the baseline information content at each position for the whole dataset, and the coloured lines showing how the profile changes when each of three focal positions is mismatched. Figure 6B summarizes the same analysis at all positions, with each row of the grid representing the subset of sequences mismatched at a focal position, and the blocks in that row colour-coded to show how mismatched bases changed the information content at each non-focal position (purple indicates increased information content and orange decreased). The summary bar plot running down the right side of the grid (Figure 6C) shows the total remaining information content (the sum of the information contents, in bits) for that subset of mismatched reads, i.e. the distinctness of recovered and input subsets with the same mismatched focal position.
Figure 6.

Pairwise interaction effects between USS bases. (A) Effects of three mismatches on information content at other positions: grey bars indicate information content at each position in the total dataset. Yellow, blue and red lines indicate the information content in data subsets where positions 22, 8 and 11 were mismatched. (B) Effects of mismatches at individual focal positions on the information content of other positions. Each row shows the change in information content at non-focal positions (columns) for the subset of recovered and input reads. Purple indicates increased information content, and orange indicates decreased information content. (C) Total residual bits at the remaining positions when the indicated position is mismatched. Red line indicates total bits in the motif derived from the full dataset.
The yellow line in Figure 6A shows results for mismatches at focal position 22, which is typical of positions that do not contribute to uptake bias. It closely follows the grey bars, showing that mismatches at position 22 do not change the information content of other positions; i.e. they do not make cryptic contributions to uptake. Figure 6B shows the same effect for this and the other uninformative positions (rows 1–2, 12–14,19–25, 30–32).
The blue line in Figure 6A shows results for mismatches at focal position 8, which is typical of subsets with focal mismatches at the inner-core positions (Figure 6B, rows 7–10). In these small subsets the information content was drastically reduced at all other informative positions, indicating that the recovered fragments were very similar to input fragments containing the same focal mismatch (Figure 6C). These fragments must have entered the recovered pool by low levels of carry-over contamination or non-specific DNA uptake. However information content at non-focal positions was not restored even when we assumed a level of 1.3% for carry-over contamination by (or non-specific uptake of) input fragments, the highest value possible given the frequency of A at position 8 (Supplementary Figure S5). Sequencing errors at the focal position also cannot be responsible for the reduction in specificity at other positions. Since analysis of interaction effects between focal inner core positions and other positions was compromised by the relatively low numbers of recovered reads mismatched at these positions (<1% of reads at each inner core position), we can conclude only that these positions are especially critical for DNA uptake.
The red line in Figure 6A shows the results for mismatches at focal position 11, typical of the outer core and T-tract positions that made moderate contributions to uptake when considered singly. The differences between the red line and the grey bars show that this data subset had modestly decreased information content at inner-core positions but increased information content at all other outer-core positions and, less strongly, at T-tract positions. Figure 6B shows similar effects for rows 3–6; the purple blocks indicate that being mismatched at an outer-core position made the impacts of mismatches at other outer-core positions disproportionately worse. The reverse also applied; focal mismatches in the T-tracts (rows 16–18 and 26–29) also increased the disadvantage of mismatches in the outer core. However interactions were not seen within or between each T-tract. This pattern was consistent even when high levels of carry-over contamination/non-specific uptake were considered (Supplementary Figure S5).
Validation and higher-order interactions: Assays using non-degenerate constructs were used to confirm that fragments doubly mismatched at two outer-core positions are taken up less efficiently than predicted from the modest effects of either mismatch singly. Compared with perfect-consensus fragments, fragments with single mismatches at positions 6 and 11 (T6G and T11G) were taken up at 65% and 95%, respectively. However the double variant (T6G/T11G) was only taken up at 12% of the consensus level, a 5-fold decrease from the expected frequency of 62% based on uptake of the single variants. Analysis of the same sequences in the degenerate uptake experiment predicted 3-fold depletion. This value is derived from a very small sample (only 10 recovered reads seen with T6G/T11G perfect-consensus); analysis with more relaxed matching (Supplementary Table S4) predicted depletions of 3.1–4.6-fold. This validation experiment shows that the pairwise interaction effects observed in the degenerate uptake experiment were not artefacts of our analysis.
Accounting for pairwise interactions still neglects higher-order interactions involving three or more positions. A detailed position-specific evaluation of these was compromised by the small numbers of fragments with particular sequence combinations, so instead we considered the mean effects of single, double, and triple mismatches in the outer core on the efficiency of uptake of fragments with perfectly matched inner cores (Supplementary Table S5). On average, fragments with single mismatches in the outer core were taken up at 35.0% the efficiency of fragments with perfect cores. Fragments with two such mismatches were taken up at only 6.2%, rather than at the 12.2% predicted. Fragments with three such mismatches were taken up at only 0.9%, rather than the 4.3% predicted. This analysis suggests that higher-order interactions make a contribution to uptake beyond that predicted from pairwise interactions alone.
Accumulation of uptake sequences in the genome
If no other factors were acting, the pattern of overrepresented sequences in the genome would be expected to match that of the uptake bias (9). However many other processes could influence the accumulation of USSs in the genome, including post-uptake events leading to recombination of preferred sequences into the genome, mutational biases and selective forces acting on USS-containing sequences.
To detect the effects of these, we compared the logo representation of the uptake bias motif with the logo generated by Gibbs sampling of the H. influenzae genome (Figure 4A and B (9)). Although the absolute heights/information contents of these logos cannot be directly compared since they are derived from very different kinds of data, their distinct shapes indicate that the sequences accumulated in the genome do not accurately reflect the bias of the uptake machinery, despite their identical consensus sequences. The outer-core and T-tract positions in the genomic logo have much higher information content than they do in the uptake bias logo.
Since sequence logos depend only on the frequencies of the bases at each position in the dataset, the comparison of logos does not reveal whether the interaction effects identified above for uptake bias have been preserved in the genomic USSs. Maughan et al. (9) found only weak interactions between adjacent and near-neighbour positions in the T-tracts of genomic sites, but the number of sites with core mismatches was much too small to detect whether or not there are interaction effects involving core positions, precluding an analysis of genomic sites paralleling (Figure 6).
Scoring the genome with the uptake bias motif: The genomic USS motif in Figure 4C was derived using sequences identified by globally searching the H. influenzae genome with the Gibbs recursive sampler (9,45), and the algorithm and parameter settings this used could have introduced biases into the set of sites it identified. We thus tested whether the new uptake bias motif finds the same genomic sites as the Gibbs-based genomic USS motif by rescoring the H. influenzae genome sequence with the uptake bias motif in Figure 4A. Rescoring with the Gibbs-derived motif served as a control. As expected, each search assigned to almost all of the ∼3.7 × 10⁶ possible sites the low scores typical of random sequences with this base composition, but each showed a distinct peak of high-scoring sites (Figure 7A and B). The top-scoring 2000 sites identified by each motif model included all those in the small peak (shading in Figure 7A and B show the cut-offs), and 1807 top-scoring sites were shared between the two sets. The sites identified by each motif generated very similar logos that both strongly resemble the genomic motif (Figure 7C and D). Thus the differences between the uptake and genomic logos are not due to artefacts arising from the Gibbs motif sampler. Rather, the sequences accumulated in the genome show much stronger consensuses for outer-core and T-tract positions than predicted by uptake bias, indicating the action of uptake-independent processes.
Figure 7.

Analysis of genomic uptake sequences. (A) and (B) Histograms of normalized scores of all 32mer sites in the genome using the uptake (A) or genomic (B) motifs. Shading in zoomed versions (centre panels) indicates the set of 2000 sites used to construct the logos in (C) and (D) (thresholds 80.6 and 71.6, respectively). Grey lines show control histograms of the average of 100 random sequences with H. influenzae genome length and GC-content.
Disentangling the effects of such processes on uptake sequence accumulation is difficult, but the effects of selection for coding and termination functions can be distinguished by separately examining the genomic USS sites in these categories; both of these factors are known to strongly influence USS location (19,21,22). We thus compared the sequence logos for subsets of the 2000 sites identified by the uptake bias motif. The sites were first partitioned into those within coding sequences and those found in intergenic regions. Most of the sites (1302) were fully contained within genes, and their logo is very similar to that of the full set, with slightly weaker initial As and T-tracts. The 692 intergenic sites have correspondingly stronger biases at these positions (Figure 8A).
Figure 8.

Information content for USS sites in different genomic partitions. (A) Grey bars show information content in the total set of 2000 sites found by the uptake-bias motif. Blue line: information content in the 1302 sites fully within open reading frames (none were found in non-coding genes). Red line: information content in the 692 intergenic sites. (B) Grey bars: information content in the intergenic sites. Purple lines: information content in the 380 intergenic sites with no terminator function. Orange line: information content in the 312 intergenic terminators sites.
To find out how terminator function influences genomic USS, intergenic sites were further subdivided based on their intersection with the set of Rho-independent transcriptional terminators predicted by Kingsford et al. (21). The terminator and non-terminator subsets (312 and 380) were very similar, suggesting that terminator function imposes only weak constraints on USS sequences (Figure 8B). Subdividing these terminator sites into three classes based on the spacing of their oppositely oriented USS revealed that these classes are in fact subject to different constraints (Supplementary Figure S6), but the net effect of these is not very strong. We found no evidence that the directions of replication or transcription altered the composition of genomic USSs. Gibbs searches found indistinguishable motifs when separately applied to replicated-as-leading and replicated-as-lagging sequences (using the origin and terminator predictions of (52). Similarly, Gibbs searches gave indistinguishable motifs when coding sequences were compared with their reverse complements.
Summary
The DNA uptake machinery’s optimal sequence is identical to the consensus of the genomic motif’s consensus at all core and T-tract positions, but many variant sequences are also able to promote efficient uptake. The most important positions are the GCGG inner core, but all of the other positions identified in the genomic motif contribute to uptake directly, with interactions between bases at many different positions also making substantial contributions. The correspondence between uptake and genomic consensuses is fully consistent with the expected consequences of biased uptake and unselected recombination, but differences between the uptake and genomic motifs implicate additional uptake-independent mutational and selective forces that have yet to be identified.
DISCUSSION
Understanding DNA uptake specificity requires first defining both the biases of the uptake systems and the accumulation of preferred sequences in the corresponding genomes, and then disentangling their causes. We and others have already reported detailed analyses of genomic uptake sequences (3,6–9,20,22). This work dissects the contribution of USS bases to efficient DNA uptake by combining modern deep sequencing analysis with purification of taken up DNA from the periplasm, a strategy similar to those recently used to study transcription factor binding sites (53–55).
Using the consensus of the genomic USS motif as a starting point, we measured the uptake of millions of sequence variants in a single massively parallel experiment. This found that the consensus USS is indeed the sequence that is taken up most efficiently, with the preferred fragments enriched for consensus bases of both the core USS and its flanking helically phased T-tracts. However, when USS positions were treated independently, only the four inner core bases made critical contributions to efficient DNA uptake. Analysis of interaction effects indicated that interactions between bases at other positions also make strong contributions to uptake bias, with the net effect of these interactions potentially as strong as their individual position effects. The evidence supporting this is robust; sequencing errors and other artefacts could have caused underestimation but not overestimation of the biases.
We have also taken the first steps to connect uptake bias to accumulation of preferred sequences in the genome. A full model of how uptake bias can drive sequences into the genome has been developed (9); it predicts that, in the absence of other forces, the overrepresented sequences should match the uptake bias, but they do not. The differences cannot be due to the interaction effects in uptake bias, since both logos treat positions as acting independently; they must be due to forces that affect DNA sequences after uptake. However analysis of USS in different genomic locations detected only modest effects of coding and termination functions, and no effect of replication direction or transcription.
One strong force acting on the genomic USSs is the mutation bias responsible for the low G+C content of the H. influenzae genome (38%). Over the very long evolutionary period that USS have been accumulating in the genome (14), this mutation bias is expected to have decreased the frequencies of Gs and Cs in USSs and increased the frequencies of As and Ts, thus reducing the strengths of the inner core GCGG consensus and increasing the strengths of the T-tracts and all outer core positions except G5. Exactly these differences are seen when the uptake motif is compared with that of the non-coding non-terminator subset of genomic USSs. Position G5 is especially significant—it is not part of the inner core, but like those positions its information content has decreased relative to its A and T neighbours. The effects of base composition bias may have been further amplified by the bias towards short tracts of As, Ts and ATs that has been previously characterized in the H. influenzae genome, and these biases are even stronger in intergenic regions than in genes (56,57).
Future research can now focus on two issues. One is the role of sequence biases in the mechanism of DNA uptake. Little is presently known about how DNA uptake is initiated in Gram-negative bacteria. However, H. influenzae’s ability to efficiently take up closed circular DNAs precludes an uptake mechanism that threads one DNA end through the pore and instead requires a mechanism that initiates uptake internally on DNA fragments (37). We hypothesize that uptake initiates more efficiently at sequences that are readily kinked to fit through the narrow secretin pore (58), and that this kinking occurs mainly as a consequence of strong sequence-specific interactions between the inner core of the uptake sequence and the uptake machinery. The best candidate binding partners are the tip of the force-transducing type 4 pilus and the residues of other proteins that are exposed at the cell surface. In vitro attempts to identify sequence-specific USS-binding proteins have not been successful, so the best approach may be to combine our new deep sequencing approach with in vivo cross-complementation studies using H. influenzae and its relative Actinobacillus pleuropneumoniae, whose genomic USS has different consensus in both the outer core and the final T-tract (14).
Our study examined only a 32 bp segment in otherwise identical 200 bp fragments. Although the consensus strongly promotes uptake of fragments of all sizes, it is possible that longer and/or shorter fragments experience subtly different biases. Similarly, although there is no evidence that sequences outside the USS influence uptake, the availability of longer sequence reads permits the investigation of this using a longer degenerate segment. Unknown sequence biases might also affect the progress of the DNA uptake that follows USS-dependent initiation. These might best be investigated using long fragments of chromosomal DNA. Results with H. influenzae DNA might be difficult to interpret because of its high density of USSs, so a better approach might be to use Escherichia coli or other genomic DNA that has been cut with a restriction enzyme and ligated to a standard USS.
The success of our experimental approach allows its extension to other Gram-negative bacteria. Those species that show a preference for self-DNA but have no obvious uptake sequences accumulated in their genomes (25,26) may have uptake preferences that are simpler or less stringent than those of Haemophilus and Neisseria species, and defining these uptake biases will likely reveal important constraints on DNA uptake. It will also be important to investigate species with no apparent preference for taking up self-DNA (59,60). Such species have been generally assumed to have unbiased DNA uptake, but cryptic biases would not alter the genome if chromosomal recombination were limited by DNA degradation or lack of sequence homology. Finding uptake biases in such bacteria would show that biases can be intrinsic to the uptake mechanism and need not be due to direct selection for efficient genetic exchange.
The second important issue is the relationship between uptake bias and genome sequence evolution. Many distinct factors interact to determine the effects of transformation: the nature of the environmental DNA that cells encounter; uptake biases; other events that promote or limit the frequency of recombination and the properties of recombination tracts; selection for or against genetic variation brought in by recombination; the above-mentioned mutational and other transformation-independent selective biases. The recent availability of many genome sequences of clinical isolates of H. influenzae and Neisseria spp. provides the opportunity to discriminate between these processes by investigating the natural genetic variation at and around uptake sequences. We have also begun complementary experiments in H. influenzae that directly measure how strongly individual genomic fragments containing USSs promote uptake, and the correlation of this with transformation frequency. These will shed light on how forces within the genome enhance or limit the effect of uptake specificity on horizontal gene transfer.
ACCESSION NUMBERS
NCBI short read archive project accession: SRP012938.
SUPPLEMENTARY DATA
Supplementary Data are available at NAR Online: Supplementary Tables 1–5 and Supplementary Figures 1–6.
FUNDING
National Institutes of Health postdoctoral fellowship [5F32AI084427 to J.C.M.]; National Institutes of Health new innovator’s award [DP2OD006493 to I.M.H.]; Canadian Institute for Health Research operating grant [MOP-53263 to R.J.R.]. Funding for open access charge: Canadian Institute for Health Research.
Conflict of interest statement. None declared.
Supplementary Material
ACKNOWLEDGEMENTS
We thank to Sunita Sinha and an anonymous reviewer for helpful comments, Svetlana Shumilina for technical assistance and Alyson Prorock at the University of Virginia School of Medicine sequencing centre.
REFERENCES
- 1.Chen I, Dubnau D. DNA uptake during bacterial transformation. Nat. Rev. Microbiol. 2004;2:241–249. doi: 10.1038/nrmicro844. [DOI] [PubMed] [Google Scholar]
- 2.Maughan H, Sinha S, Wilson L, Redfield RJ. In: Pasteurellaceae: Biology, Genomics and Molecular Aspects. Kuhnert P, Christensen H, editors. Norfolk, UK: Caister Academic Press; 2008. [Google Scholar]
- 3.Smith HO, Gwinn ML, Salzberg SL. DNA uptake signal sequences in naturally transformable bacteria. Res. Microbiol. 1999;150:603–616. doi: 10.1016/s0923-2508(99)00130-8. [DOI] [PubMed] [Google Scholar]
- 4.Chu D, Lee HC, Lenaerts T. Evolution of DNA uptake signal sequences. Artif. Life. 2005;11:317–338. doi: 10.1162/1064546054407176. [DOI] [PubMed] [Google Scholar]
- 5.Chu D, Rowe J, Lee HC. Evaluation of the current models for the evolution of bacterial DNA uptake signal sequences. J. Theor. Biol. 2006;238:157–166. doi: 10.1016/j.jtbi.2005.05.024. [DOI] [PubMed] [Google Scholar]
- 6.Bakkali M. Genome dynamics of short oligonucleotides: the example of bacterial DNA uptake enhancing sequences. PLoS ONE. 2007;2:e741. doi: 10.1371/journal.pone.0000741. [DOI] [PMC free article] [PubMed] [Google Scholar]
- 7.Ambur OH, Frye SA, Tonjum T. New functional identity for the DNA uptake sequence in transformation and its presence in transcriptional terminators. J. Bacteriol. 2007;189:2077–2085. doi: 10.1128/JB.01408-06. [DOI] [PMC free article] [PubMed] [Google Scholar]
- 8.Treangen TJ, Ambur OH, Tonjum T, Rocha EP. The impact of the neisserial DNA uptake sequences on genome evolution and stability. Genome Biol. 2008;9:R60. doi: 10.1186/gb-2008-9-3-r60. [DOI] [PMC free article] [PubMed] [Google Scholar]
- 9.Maughan H, Wilson LA, Redfield RJ. Bacterial DNA uptake sequences can accumulate by molecular drive alone. Genetics. 2010;186:613–627. doi: 10.1534/genetics.110.119438. [DOI] [PMC free article] [PubMed] [Google Scholar]
- 10.Scocca JJ, Poland RL, Zoon KC. Specificity in deoxyribonucleic acid uptake by transformable Haemophilus influenzae. J. Bacteriol. 1974;118:369–373. doi: 10.1128/jb.118.2.369-373.1974. [DOI] [PMC free article] [PubMed] [Google Scholar]
- 11.Sisco KL, Smith HO. Sequence-specific DNA uptake in Haemophilus transformation. Proc. Natl Acad. Sci. USA. 1979;76:972–976. doi: 10.1073/pnas.76.2.972. [DOI] [PMC free article] [PubMed] [Google Scholar]
- 12.Chung BC, Goodgal SH. The specific uptake of cloned Haemophilus DNA. Biochem. Biophys. Res. Commun. 1979;88:208–214. doi: 10.1016/0006-291x(79)91717-0. [DOI] [PubMed] [Google Scholar]
- 13.Danner DB, Deich RA, Sisco KL, Smith HO. An eleven-base-pair sequence determines the specificity of DNA uptake in Haemophilus transformation. Gene. 1980;11:311–318. doi: 10.1016/0378-1119(80)90071-2. [DOI] [PubMed] [Google Scholar]
- 14.Redfield RJ, Findlay WA, Bosse J, Kroll JS, Cameron AD, Nash JH. Evolution of competence and DNA uptake specificity in the Pasteurellaceae. BMC Evol. Biol. 2006;6:82. doi: 10.1186/1471-2148-6-82. [DOI] [PMC free article] [PubMed] [Google Scholar]
- 15.Dougherty TJ, Asmus A, Tomasz A. Specificity of DNA uptake in genetic transformation of gonococci. Biochem. Biophys. Res. Commun. 1979;86:97–104. doi: 10.1016/0006-291x(79)90386-3. [DOI] [PubMed] [Google Scholar]
- 16.Goodman SD, Scocca JJ. Identification and arrangement of the DNA sequence recognized in specific transformation of Neisseria gonorrhoeae. Proc. Natl Acad. Sci. USA. 1988;85:6982–6986. doi: 10.1073/pnas.85.18.6982. [DOI] [PMC free article] [PubMed] [Google Scholar]
- 17.Goodgal SH, Mitchell MA. Sequence and uptake specificity of cloned sonicated fragments of Haemophilus influenzae DNA. J. Bacteriol. 1990;172:5924–5928. doi: 10.1128/jb.172.10.5924-5928.1990. [DOI] [PMC free article] [PubMed] [Google Scholar]
- 18.Elkins C, Thomas CE, Seifert HS, Sparling PF. Species-specific uptake of DNA by gonococci is mediated by a 10-base-pair sequence. J. Bacteriol. 1991;173:3911–3913. doi: 10.1128/jb.173.12.3911-3913.1991. [DOI] [PMC free article] [PubMed] [Google Scholar]
- 19.Smith HO, Tomb JF, Dougherty BA, Fleischmann RD, Venter JC. Frequency and distribution of DNA uptake signal sequences in the Haemophilus influenzae Rd genome. Science. 1995;269:538–540. doi: 10.1126/science.7542802. [DOI] [PubMed] [Google Scholar]
- 20.Bakkali M, Chen TY, Lee HC, Redfield RJ. Evolutionary stability of DNA uptake signal sequences in the Pasteurellaceae. Proc. Natl Acad. Sci. USA. 2004;101:4513–4518. doi: 10.1073/pnas.0306366101. [DOI] [PMC free article] [PubMed] [Google Scholar]
- 21.Kingsford CL, Ayanbule K, Salzberg SL. Rapid, accurate, computational discovery of Rho-independent transcription terminators illuminates their relationship to DNA uptake. Genome Biol. 2007;8:R22. doi: 10.1186/gb-2007-8-2-r22. [DOI] [PMC free article] [PubMed] [Google Scholar]
- 22.Findlay WA, Redfield RJ. Coevolution of uptake sequences and bacterial proteomes. Genome Biol. Evol. 2009;1:45–55. doi: 10.1093/gbe/evp005. [DOI] [PMC free article] [PubMed] [Google Scholar]
- 23.Feil EJ, Spratt BG. Recombination and the population structures of bacterial pathogens. Annu. Rev. Microbiol. 2001;55:561–590. doi: 10.1146/annurev.micro.55.1.561. [DOI] [PubMed] [Google Scholar]
- 24.Bates AD, Maxwell A. DNA Topology. Oxford: Oxford University Press; 2005. [Google Scholar]
- 25.Saunders NJ, Peden JF, Moxon ER. Absence in Helicobacter pylori of an uptake sequence for enhancing uptake of homospecific DNA during transformation. Microbiology. 1999;145:3523–3528. doi: 10.1099/00221287-145-12-3523. [DOI] [PubMed] [Google Scholar]
- 26.Levine SM, Lin EA, Emara W, Kang J, DiBenedetto M, Ando T, Falush D, Blaser MJ. Plastic cells and populations: DNA substrate characteristics in Helicobacter pylori transformation define a flexible but conservative system for genomic variation. FASEB J. 2007;21:3458–3467. doi: 10.1096/fj.07-8501com. [DOI] [PubMed] [Google Scholar]
- 27.Baltrus DA, Guillemin K, Phillips PC. Natural transformation increases the rate of adaptation in the human pathogen Helicobacter pylori. Evolution. 2008;62:39–49. doi: 10.1111/j.1558-5646.2007.00271.x. [DOI] [PubMed] [Google Scholar]
- 28.Levin BR, Cornejo OE. The population and evolutionary dynamics of homologous gene recombination in bacterial populations. PLoS Genet. 2009;5:e1000601. doi: 10.1371/journal.pgen.1000601. [DOI] [PMC free article] [PubMed] [Google Scholar]
- 29.Johnsen PJ, Dubnau D, Levin BR. Episodic selection and the maintenance of competence and natural transformation in Bacillus subtilis. Genetics. 2009;181:1521–1533. doi: 10.1534/genetics.108.099523. [DOI] [PMC free article] [PubMed] [Google Scholar]
- 30.Kupfer DM, McCarthy D. rec-2-dependent phage recombination in Haemophilus influenzae. J. Bacteriol. 1992;174:4960–4966. doi: 10.1128/jb.174.15.4960-4966.1992. [DOI] [PMC free article] [PubMed] [Google Scholar]
- 31.Fleischmann RD, Adams MD, White O, Clayton RA, Kirkness EF, Kerlavage AR, Bult CJ, Tomb JF, Dougherty BA, Merrick JM, et al. Whole-genome random sequencing and assembly of Haemophilus influenzae Rd. Science. 1995;269:496–512. doi: 10.1126/science.7542800. [DOI] [PubMed] [Google Scholar]
- 32.Maughan H, Redfield RJ. Extensive variation in natural competence in Haemophilus influenzae. Evolution. 2009;63:1852–1866. doi: 10.1111/j.1558-5646.2009.00658.x. [DOI] [PubMed] [Google Scholar]
- 33.Poje G, Redfield RJ. Transformation of Haemophilus influenzae. Methods Mol. Med. 2003;71:57–70. doi: 10.1385/1-59259-321-6:57. [DOI] [PubMed] [Google Scholar]
- 34.Poje G, Redfield RJ. General methods for culturing Haemophilus influenzae. Methods Mol. Med. 2003;71:51–56. doi: 10.1385/1-59259-321-6:51. [DOI] [PubMed] [Google Scholar]
- 35.Sambrook J, Russell DW. Molecular cloning: a laboratory manual. 3rd edn. Cold Spring Harbor, NY: Cold Spring Harbor Laboratory Press; 2001. [Google Scholar]
- 36.Kahn ME, Barany F, Smith HO. Transformasomes: specialized membranous structures that protect DNA during Haemophilus transformation. Proc. Natl Acad. Sci. USA. 1983;80:6927–6931. doi: 10.1073/pnas.80.22.6927. [DOI] [PMC free article] [PubMed] [Google Scholar]
- 37.Barouki R, Smith HO. Reexamination of phenotypic defects in rec-1 and rec-2 mutants of Haemophilus influenzae Rd. J. Bacteriol. 1985;163:629–634. doi: 10.1128/jb.163.2.629-634.1985. [DOI] [PMC free article] [PubMed] [Google Scholar]
- 38.Bentley DR, Balasubramanian S, Swerdlow HP, Smith GP, Milton J, Brown CG, Hall KP, Evers DJ, Barnes CL, Bignell HR, et al. Accurate whole human genome sequencing using reversible terminator chemistry. Nature. 2008;456:53–59. doi: 10.1038/nature07517. [DOI] [PMC free article] [PubMed] [Google Scholar]
- 39.Li H, Handsaker B, Wysoker A, Fennell T, Ruan J, Homer N, Marth G, Abecasis G, Durbin R. The Sequence Alignment/Map format and SAMtools. Bioinformatics. 2009;25:2078–2079. doi: 10.1093/bioinformatics/btp352. [DOI] [PMC free article] [PubMed] [Google Scholar]
- 40.Neuwirth E. RColorBrewer: ColorBrewer palettes. R package version 1.0-2. 2007 [Google Scholar]
- 41.Benbom O. seqLogo: Sequence logos for DNA sequence alignments. R package version 1.16.0 [Google Scholar]
- 42.Schneider TD, Stephens RM. Sequence logos: a new way to display consensus sequences. Nucleic Acids Res. 1990;18:6097–6100. doi: 10.1093/nar/18.20.6097. [DOI] [PMC free article] [PubMed] [Google Scholar]
- 43.Schneider TD, Stormo GD, Gold L, Ehrenfeucht A. Information content of binding sites on nucleotide sequences. J. Mol. Biol. 1986;188:415–431. doi: 10.1016/0022-2836(86)90165-8. [DOI] [PubMed] [Google Scholar]
- 44.Quinlan AR, Hall IM. BEDTools: a flexible suite of utilities for comparing genomic features. Bioinformatics. 2010;26:841–842. doi: 10.1093/bioinformatics/btq033. [DOI] [PMC free article] [PubMed] [Google Scholar]
- 45.Thompson W, Rouchka EC, Lawrence CE. Gibbs Recursive Sampler: finding transcription factor binding sites. Nucleic Acids Res. 2003;31:3580–3585. doi: 10.1093/nar/gkg608. [DOI] [PMC free article] [PubMed] [Google Scholar]
- 46.Pifer ML, Smith HO. Processing of donor DNA during Haemophilus influenzae transformation: analysis using a model plasmid system. Proc. Natl Acad. Sci. USA. 1985;82:3731–3735. doi: 10.1073/pnas.82.11.3731. [DOI] [PMC free article] [PubMed] [Google Scholar]
- 47.Stormo GD, Fields DS. Specificity, free energy and information content in protein-DNA interactions. Trends Biochem. Sci. 1998;23:109–113. doi: 10.1016/s0968-0004(98)01187-6. [DOI] [PubMed] [Google Scholar]
- 48.Naughton BT, Fratkin E, Batzoglou S, Brutlag DL. A graph-based motif detection algorithm models complex nucleotide dependencies in transcription factor binding sites. Nucleic Acids Res. 2006;34:5730–5739. doi: 10.1093/nar/gkl585. [DOI] [PMC free article] [PubMed] [Google Scholar]
- 49.Tomovic A, Oakeley EJ. Position dependencies in transcription factor binding sites. Bioinformatics. 2007;23:933–941. doi: 10.1093/bioinformatics/btm055. [DOI] [PubMed] [Google Scholar]
- 50.Sharon E, Lubliner S, Segal E. A feature-based approach to modeling protein-DNA interactions. PLoS Comput. Biol. 2008;4:e1000154. doi: 10.1371/journal.pcbi.1000154. [DOI] [PMC free article] [PubMed] [Google Scholar]
- 51.Stormo GD. Maximally efficient modeling of DNA sequence motifs at all levels of complexity. Genetics. 2011;187:1219–1224. doi: 10.1534/genetics.110.126052. [DOI] [PMC free article] [PubMed] [Google Scholar]
- 52.Freeman JM, Plasterer TN, Smith TF, Mohr SC. Patterns of genome organization in bacteria. Science. 1998;279:1827. [Google Scholar]
- 53.Shomer B, Yagil G. Long W tracts are over-represented in the Escherichia coli and Haemophilus influenzae genomes. Nucleic Acids Res. 1999;27:4491–4500. doi: 10.1093/nar/27.22.4491. [DOI] [PMC free article] [PubMed] [Google Scholar]
- 54.Orsi RH, Bowen BM, Wiedmann M. Homopolymeric tracts represent a general regulatory mechanism in prokaryotes. BMC Genomics. 2010;11:102. doi: 10.1186/1471-2164-11-102. [DOI] [PMC free article] [PubMed] [Google Scholar]
- 55.Zykovich A, Korf I, Segal DJ. Bind-n-Seq: high-throughput analysis of in vitro protein-DNA interactions using massively parallel sequencing. Nucleic Acids Res. 2009;37:e151. doi: 10.1093/nar/gkp802. [DOI] [PMC free article] [PubMed] [Google Scholar]
- 56.Kinney JB, Murugan A, Callan CG, Jr, Cox EC. Using deep sequencing to characterize the biophysical mechanism of a transcriptional regulatory sequence. Proc. Natl Acad. Sci. USA. 2010;107:9158–9163. doi: 10.1073/pnas.1004290107. [DOI] [PMC free article] [PubMed] [Google Scholar]
- 57.Wang J, Lu J, Gu G, Liu Y. In vitro DNA-binding profile of transcription factors: methods and new insights. J. Endocrinol. 2011;210:15–27. doi: 10.1530/JOE-11-0010. [DOI] [PubMed] [Google Scholar]
- 58.Burkhardt J, Vonck J, Averhoff B. Structure and function of PilQ, a secretin of the DNA transporter from the thermophilic bacterium Thermus thermophilus HB27. J. Biol. Chem. 2011;286:9977–9984. doi: 10.1074/jbc.M110.212688. [DOI] [PMC free article] [PubMed] [Google Scholar]
- 59.Palmen R, Vosman B, Buijsman P, Breek CK, Hellingwerf KJ. Physiological characterization of natural transformation in Acinetobacter calcoaceticus. J. Gen. Microbiol. 1993;139:295–305. doi: 10.1099/00221287-139-2-295. [DOI] [PubMed] [Google Scholar]
- 60.Rumszauer J, Schwarzenlander C, Averhoff B. Identification, subcellular localization and functional interactions of PilMNOWQ and PilA4 involved in transformation competency and pilus biogenesis in the thermophilic bacterium Thermus thermophilus HB27. FEBS J. 2006;273:3261–3272. doi: 10.1111/j.1742-4658.2006.05335.x. [DOI] [PubMed] [Google Scholar]
Associated Data
This section collects any data citations, data availability statements, or supplementary materials included in this article.