Abstract
Quantitative ultrasonic techniques using backscatter coefficients (BSCs) may fail to produce physically meaningful estimates of effective scatterer diameter (ESD) when the analysis media contains scatterers of different sizes. In this work, three different estimator algorithms were used to produce estimates of ESD. The performance of the three estimators was compared over different frequency bands using simulations and experiments with physical phantoms. All estimators produced ESD estimates by comparing the estimated BSCs with a scattering model based on the backscattering cross-section of a single spherical fluid scatterer. The first estimator consisted of minimizing the average square deviation of the ratio between the estimated BSCs and the scattering model with both expressed in decibels. The second and third estimators consisted of minimizing the mean square error between the estimated BSCs and a linear transformation of the scattering model with and without considering an intercept, respectively. Simulations were conducted over several analysis bandwidths between 1 and 40 MHz from populations of scatterers with either a uniform size distribution or a distribution based on the inverse cubic of the size. Diameters of the distributions ranged between [25, 100], [25, 50], [50, 100], and [50, 75] μm. Experimental results were obtained from two gelatin phantoms containing Sephadex spheres ranging in diameter from 28 to 130 μm and 70 to 130 μm, respectively, and 5, 7.5, 10, and 13 MHz focused transducers. Significant differences in the performances of the ESD estimator algorithms as a function of the analysis frequency were observed. Specifically, the third estimator exhibited potential to produce physically meaningful ESD estimates even for large ka values when using a single-size scattering model if sufficient analysis bandwidth was available.
Index Terms: Tissue characterization, scatterer size estimation, ultrasound backscatter, ultrasonic imaging
I. Introduction
The backscatter coefficient (BSC) is a fundamental ultrasonic property of a tissue material and is often linked to sub wavelength variations of tissue properties. Several theoretical frameworks for experimentally estimating BSCs have been proposed in the past [1]–[6]. For tissue characterization tasks, however, it is usually desired to reduce the information contained in BSC estimates as a function of frequency into a few quantitative markers of tissue microstructure. One approach is to perform a parametric fit of BSC estimates over a frequency range to a model in order to estimate the effective scatterer diameter (ESD) of a microstructural scattering unit [7]–[9]. The ESD corresponds to a characteristic size of individual scatterers for discrete scattering models, and the correlation length of acoustic impedance variations for continuous scattering models.
Typically, ESD estimates are obtained assuming that a size distribution can be described by a single scatterer size representing the volume-weighted mean of the distribution. However, using traditional ESD estimators it has been observed that ESD estimates may not correspond to the size of actual physical structures when the analysis medium contains scatterers whose sizes follow a continuous probability distribution function (PDF) [10]. In particular, it was found through simulations and experiments that for sufficiently high analysis frequencies ESD estimates obtained using a fluid sphere model depended only on the center frequency of the analysis band when analyzing samples with inhomogeneous scatterer sizes.
Although this behavior was related to the loss of correlation between estimated BSCs and single-size scattering models, the actual role of the ESD estimator algorithm on the frequency dependence of ESD estimates was not studied.
In this work, three different ESD estimators were examined in order to assess their impact on the meaningful convergence of ESD estimates from distributions of scatterers. The performances of these estimators were quantified through simulations and experiments.
II. Methods
A. BSC estimates
When ultrasound is scattered by an ensemble of υ scatterers per unit of volume distributed spatially at random in an otherwise homogeneous, fluid medium, and neglecting multiple and coherent scattering effects, the theoretical BSC η (k)th can be expressed as
| (1) |
where p(a) is the sphere radius PDF, i.e., the probability that the sphere radius takes the value a, k is the acoustic wave number, and σ (k, a) is the backscatter cross-section of the individual scatterer of radius a. In this work σ (k, a) was modeled considering the scatterers to be homogeneous fluid spheres under weak scattering assumptions [11], i.e.,
| (2) |
where and are the fractional changes in compressibility κ and density ρ, respectively. It should be stressed that these expressions are valid only for the case of low scatterer concentration (see further discussion in Section IV).
B. ESD estimator algorithms
In this work, three approaches for obtaining ESD estimates from BSC estimates η (k) were studied. All estimators provide ESD values by solving optimization problems of the form
| (3) |
| (4) |
where the wavenumbers ki correspond to a frequency band centered around a frequency f0 with Δf% useable fractional bandwidth, and N is the number of frequencies in the analysis band at which η is estimated. Each estimator uses a different combination of fitting model ηfit(k, a) and optimization cost function Δj, j = 1, 2, 3.
1) Estimator 1
The first estimator uses a fitting model equal to a scaled version of the scattering model, i.e., ηfit(k, a) = β(a)σ(k, a). This model is based on the assumption that the population of scatterers has a very narrow size distribution (i.e., p(a) ≈ δ(a − ESD/2) in (1)). The optimization strategy consisted of minimizing the variance of the log-ratio between η (k) and ηfit(k, a) [9], [11], [12]. This estimator was used to obtain ESD estimates in the previous study in [10]. The optimization cost function can be alternatively written as
| (5) |
From (3) and (5), the value of β (a) for a fixed a is given by
| (6) |
2) Estimator 2
The second estimator is also based on the fitting model ηfit(k, a) = β(a)σ(k, a). The optimization strategy consisted of minimizing the mean square error between η (k) and ηfit(k, a) [13]1,
| (7) |
From (3) and (7), the value of β(a) for a fixed a is given by
| (8) |
3) Estimator 3
The presence of scatterer size distributions causes η (k) to deviate from the simple model ηfit(k, a). An example is shown in Fig. 1 where simulated BSCs were calculated using (1) with γκ = −0.22, γρ = 0.22, and υ = 8.8 scatterers/mm3. It can be observed that the scatterer size distribution resulted in blurring of the BSC nulls when compared to the single-size distribution, a fact that has been documented in the past [14].
Fig. 1.
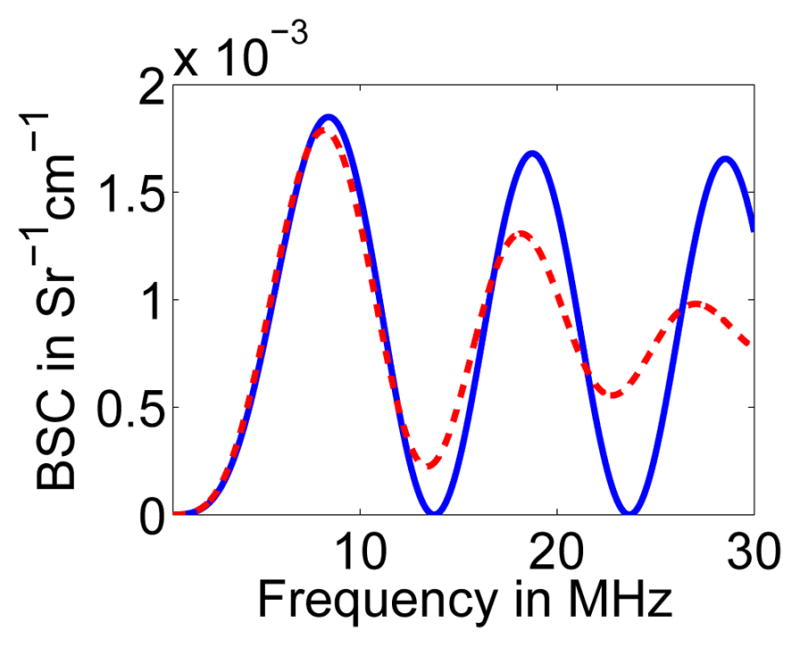
Simulated BSC curves using 8 with γκ = −0.22, γρ = 0.22, and υ = 8.8 scatterers/mm3. The curves correspond to scatterers of 80 μm in diameter (solid line) and scatterers with a uniform diameter distribution between 65 μm and 95 μm (dashed line).
In an effort to account for the BSC null blurring effect, the third estimator uses a slightly modified fitting model that considers a general linear transformation of the scattering model, i.e., ηfit(k, a) = β(a)σ(k, a) + γ (a). The optimization strategy consisted of minimizing the mean square error between η and ηfit,
| (9) |
subject to β (a) ≥ 0. From (3) and (9), the values of β (a) and γ (a) for a fixed a can be calculated using Lagrange multipliers, which results in
| (10) |
| (11) |
For both simulations and experiments and for all estimators, (3) was solved by performing an exhaustive search in the range between 1 and 250 μm with a step size of 0.5 μm.
C. Simulations
Simulations were performed by directly synthesizing in frequency domain BSCs corresponding to distributions of spherical targets of different sizes using (1) and (2). Arbitrary υ values were used as the scatterer concentration only increases the BSC amplitude using this simulation method. In contrast, the relative concentrations of scatterers of different sizes (i.e., the scatterer size distributions p(a)) affect the frequency dependence of the synthetic BSCs and therefore the output of the ESD estimators. As in [10], two scatterer size distribution PDF types, i.e., uniform and inverse cubic, were used in the simulations. As explained in [10], the rationale behind the inverse cubic distribution was that the number of spheres of radius a that could be fit into a fixed volume V decreases as 1/a3. ESD estimates at different center frequencies (f0) between 1 and 40 MHz were obtained by analyzing the synthetic BSCs between fmin = (1 − Δf/100)f0 and Δfmax = (1 + Δf/100)f0 with fractional bandwidths Δf % of 70% and 100%. For both PDF types, four different ranges of scatterer diameters were used in the simulations: [25, 100]μm, [25, 50]μm, [50, 100]μm, and [50, 75]μm. All three estimators described in Section II-B were used to obtain ESD estimates from the synthetic BSCs. It must be stressed that this simulation method produces data without a random coherent spectrum component or additive noise. Therefore, this choice reduces the complexity of the analysis of the results by eliminating sources of variance but is suitable only to assess the best achievable performance of the estimators.
D. Experiments
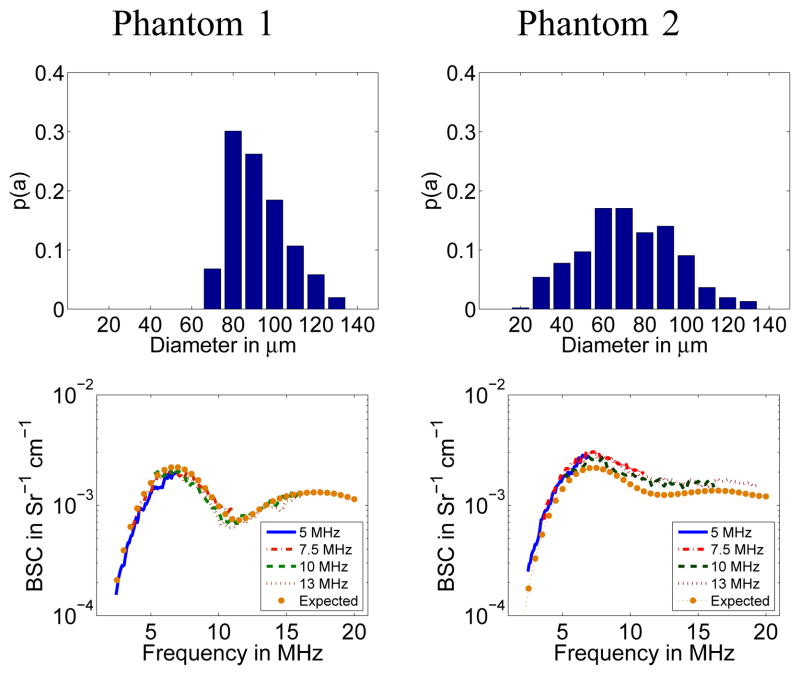
Experiments were conducted using the phantoms presented in [10]. Specifically, BSCs were estimated from two gelatin phantoms with Sephadex sphere inclusions. Both phantoms had a scatterer concentration that corresponded approximately to a volume fraction of 0.39%, which ensures the validity of the model in Section II-A and is comparable to the concentration in other phantom-based studies [15]. The scatterer size distributions were experimentally estimated from optical microscopy images and are presented in the top row of Fig. 2. BSCs were estimated using the method reported in [6] for diffraction correction and the method proposed in [16] for attenuation compensation. Experimental BSC estimates were obtained using four different focused transducers with nominal center frequencies of 5 MHz, 7.5 MHz, 10 MHz, and 13 MHz, respectively. The properties of the transducers used for the experiments are given in Table I. The analysis frequency bands for all transducers were selected such that Δf% = 85%.
Fig. 2.
Scatterer size PDF p(a) (top row) and experimental BSC curves obtained with the 5, 7.5, 10, and 13 MHz transducers (bottom) corresponding to phantoms 1 (left) and 2 (right). In the bottom row plots, the BSCs predicted by theory are also presented for comparison (taken from [10]).
TABLE I.
Properties of the transducers used for the experimental BSC estimates. For all cases, an analysis fractional bandwidth of 85% was chosen.
| Nominal center frequency (MHz) | Analysis center frequency (MHz) | f-number | Diameter (inches) |
|---|---|---|---|
|
| |||
| 5 | 5 | 3 | 0.75 |
| 7.5 | 7.5 | 4 | 0.75 |
| 10 | 10.5 | 4 | 0.5 |
| 13 | 14 | 3 | 0.5 |
For each transducer/phantom combination, a total of 441 scan lines were obtained by translating a transducer over an area of 4 cm2. Two strategies were employed to process the data using all three estimators. First, in order to experimentally validate the trends observed in simulations, the 441 lines were used to obtain a single BSC estimate from which a single ESD value was computed. Second, in order to assess the precision of each estimator, the 441 lines were split into 21 groups of 21 lines. ESD estimates were obtained from the BSCs derived from each group, and the statistics of the resulting 21 ESD estimates were computed.
III. Results
A. Simulations
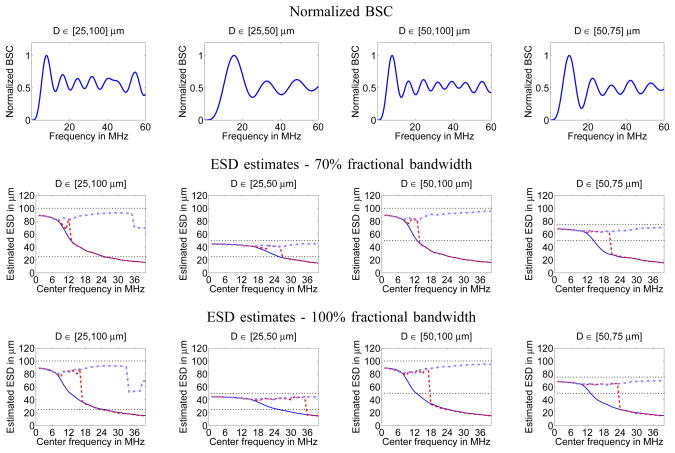
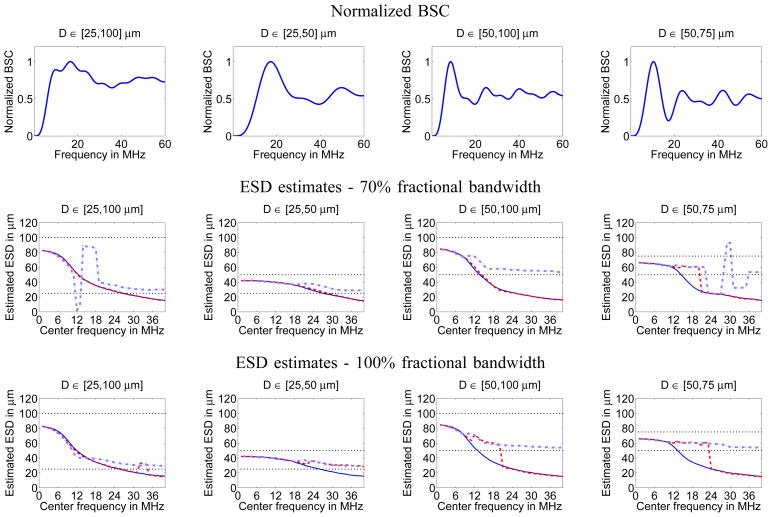
The estimated ESDs are presented in Figs. 3 and 4 when analyzing synthetic data corresponding to uniform and inverse cubic scatterer size PDFs, respectively. Two horizontal dotted lines have been included in the ESD vs. analysis frequency plots to indicate the lower and upper bounds of scatterer sizes present in the synthetic analysis media.
Fig. 3.
Simulation results using a uniform scatterer size distribution. Top row: normalized BSCs as predicted by (1). Center and bottom rows: ESD estimates obtained using methods 1 (solid lines), 2 (dashed lines), and 3 (dash-dotted lines) using 70% and 100% fractional bandwidths, respectively.
Fig. 4.
Simulation results using an inverse cubic scatterer size distribution. Top row: normalized BSCs as predicted by (1). Center and bottom rows: ESD estimates obtained using methods 1 (solid lines), 2 (dashed lines), and 3 (dash-dotted lines) using 70% and 100% fractional bandwidths, respectively.
From the figures, it can be observed that the ESD versus f0 curves had different behaviors for all different estimators. Estimator 1 produced smooth, continuous ESD curves which were inversely dependent on f0 for sufficiently high analysis frequencies as described in [10]. Convergence of estimator 1 was not significantly different when using 70% and 100% fractional bandwidths. As the frequency f0 increased, estimator 1 produced estimates of ESD that were outside of the range of scatterer sizes actually present.
Estimator 2 had good agreement with estimator 1 for all simulations at sufficiently low f0 values. More importantly, for all cases estimator 2 provided ESD estimates that fell within the underlying scatterer size range up to and beyond the f0 values where estimator 1 provided ESD estimates within the range of underlying scatterer sizes. However, for sufficiently high f0 values the ESD estimates fell outside the range of actual scatterer sizes used to simulate BSC data and overlapped with the ESDs obtained using estimator 1. The transition to the large f0 asymptotic behavior was abrupt and discontinuous in several cases. The results suggest estimator 2 converges for larger f0 ranges when using a broader analysis band, as evidenced by the reduced convergence range when using 70% fractional bandwidth instead of 100%.
Estimator 3 had good agreement with estimator 2 for low to moderate f0 values. More importantly, in all cases with 100% fractional bandwidth estimator 3 successfully produced ESD estimates that fell within the actual scatterer size ranges used in the simulations for all f0 values. However, and similar to the case of estimator 2, convergence was compromised for some cases when using a 70% fractional bandwidth as evidenced by the first and last columns of Fig. 4.
B. Experiments
1) Estimates from BSC derived from full dataset
ESD estimates obtained using the first and second experimental phantoms are presented in Figs. 5 and 6, respectively. The theoretical ESD vs. analysis frequency curves obtained by using (1) to produce synthetic BSC estimates using the PDFs reported in Fig. 2 are also shown for comparison. Two horizontal dotted lines have been included in the ESD vs. analysis frequency plots to indicate the lower and upper bounds of Sephadex sphere sizes present in the corresponding experimental phantoms.
Fig. 5.
Experimental and theoretical ESD estimates as a function of frequency f0 corresponding to the first Sephadex sphere phantom using ESD estimation methods 1 (left), 2 (center), and 3 (right). The theoretical curve was generated using BSC portions with 85% fractional bandwidth derived using (1) and the sphere diameter distribution reported in Fig. 2 as inputs to the estimators.
Fig. 6.
Experimental and theoretical ESD estimates as a function of frequency f0 corresponding to the second Sephadex sphere phantom using ESD estimation methods 1 (left), 2 (center), and 3 (right). The theoretical curve was generated using BSC portions with 85% fractional bandwidth derived using (1) and the sphere diameter distribution reported in Fig. 2 as inputs to the estimators.
In general, very good agreement was found between the expected and experimental ESD estimates using all three estimation algorithms. The results with phantom 1 in Fig. 5 show the same trend observed in the simulations, i.e., estimators 3 and 2 were the most and second to most likely ones to produce physically meaningful ESD estimates, respectively. The results with phantom 2 in Fig. 6 further demonstrate experimentally the convergence of both estimators 1 and 2 to the asymptotic curves characterized in [10] and the successful avoidance of such asymptotic convergence when using estimator 3.
2) Estimates from BSC derived from split dataset
The results obtained when processing BSCs derived from the split datasets are shown in Tables II and III. For all cases, the mean and standard deviation of the 21 estimated ESD values were calculated. The calculation was repeated after removing the six more significant outliers away from the median value per each set of 21 ESD estimates. It can be observed that there is very good agreement between the full dataset results and the split dataset results after outlier removal. Without outlier removal, estimator 1 still produced fairly precise ESD values (i.e., coefficient of variation less than 4% for all cases) whereas estimators 2 and 3 were capable of producing imprecise results (i.e., coefficients of variation between 20% and 60%) especially for larger ka values (i.e., the 13-MHz transducer dataset).
TABLE II.
Statistics of the ESD results produced with each estimator for experimental phantom 1.
| Without outlier removal
| ||||
|---|---|---|---|---|
| Estimator | 5 MHz | 7.5 MHz | 10 MHz | 13 MHz |
|
| ||||
| 1 | 96.4 ± 2.8 μm | 86.8 ± 1.4 μm | 61.9 ± 0.8 μm | 42.5 ± 0.9 μm |
| 2 | 93.2 ± 4.5 μm | 88.6 ± 2.2 μm | 93.3 ± 1.8 μm | 52.4 ± 21.4 μm |
| 3 | 88.5 ± 8.5 μm | 92.0 ± 3.6 μm | 92.3 ± 1.7 μm | 70.1 ± 41.1 μm |
|
| ||||
| With outlier removal (results from full dataset in parenthesis) | ||||
|
| ||||
| 1 | 95.4 ± 1.6 μm (96.5 μm) | 86.3 ± 0.7 μm (86.5 μm) | 62.0 ± 0.5 μm (62.0 μm) | 42.3 ± 0.6 μm (42.5 μm) |
| 2 | 93.7 ± 3.1 μm (93.5 μm) | 88.5 ± 1.1 μm (88.5 μm) | 94.0 ± 0.9 μm (93.0 μm) | 39.2 ± 1.8 μm (39.5 μm) |
| 3 | 91.1 ± 6.1 μm (90.0 μm) | 91.2 ± 2.1 μm (91.5 μm) | 93.0 ± 1.0 μm (92.0 μm) | 82.2 ± 2.7 μm (85.5 μm) |
TABLE III.
Statistics of the ESD results produced with each estimator for experimental phantom 1.
| Without outlier removal | ||||
|---|---|---|---|---|
| Estimator | 5 MHz | 7.5 MHz | 10 MHz | 13 MHz |
| 1 | 95.8 ± 3.7 μm | 83.4 ± 1.1 μm | 62.0 ± 0.7 μm | 45.6 ± 0.6 μm |
| 2 | 92.2 ± 5.7 μm | 83.9 ± 1.8 μm | 65.8 ± 5.8 μm | 50.6 ± 11.4 μm |
| 3 | 86.8 ± 10.1 μm | 85.2 ± 3.9 μm | 84.3 ± 3.1 μm | 95.0 ± 43.6 μm |
| With outlier removal (results from full dataset in parenthesis) | ||||
| 1 | 95.4 ± 1.6 μm (96.0 μm) | 83.4 ± 0.6 μm (83.5 μm) | 62.0 ± 0.4 μm (62.0 μm) | 45.4 ± 0.4 μm (45.5 μm) |
| 2 | 93.2 ± 3.4 μm (92.0 μm) | 84.5 ± 0.8 μm (84.0 μm) | 64.4 ± 1.2 μm (64.5 μm) | 45.8 ± 0.8 μm (46.0 μm) |
| 3 | 91.1 ± 6.1 μm (90.0 μm) | 91.2 ± 2.1 μm (91.5 μm) | 93.0 ± 1.0 μm (92.0 μm) | 82.2 ± 2.7 μm (85.5 μm) |
IV. Discussion
In this work ESD estimates were obtained, both through simulations and experiments, from media consisting of spatially random distributions of spheres of different sizes embedded in an otherwise homogeneous background. The results obtained in this work support the hypothesis from [10] that using a single-size scatterer model may yield non-meaningful ESD estimates, i.e., the ESD estimates may not correspond to the size of actual particles in the analysis medium. However, the results presented here also suggest the estimator algorithm has a large role in the proper convergence of ESD estimates even if a single-size scatterer model is used.
A. Analysis of error curves
The simulation and experimental results suggest that, in general, estimator 2 was able to produce ESD estimates that corresponded to the size of actual structures present in the analysis media for a larger frequency range than estimator 1. Also in general, estimator 3 produced meaningful ESD estimates for a broader range of f0 values than estimator 2. Insight into the convergence of the estimators can be obtained from the analysis of their corresponding error functions.
1) Estimator 1
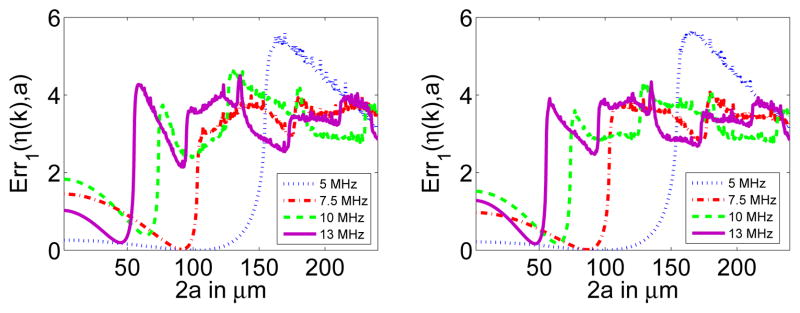
For illustration, the Err1(η (k), a) curves corresponding to the experimental Sephadex phantoms are shown in Fig. 7. The Err1(η (k), a) curves exhibited a global and several local minima. The global minimum of each curve corresponded always with the minimum associated with the lowest a value. In fact, the Err1(η (k), a) value at the global minima was always markedly lower than the local minima regardless of f0.
Fig. 7.
Experimental Err1(η (k), a) curves corresponding to the first (left) and second (right) Sephadex sphere phantoms. The error fitting curves correspond to the 5, 7.5, 10, and 13 MHz transducers.
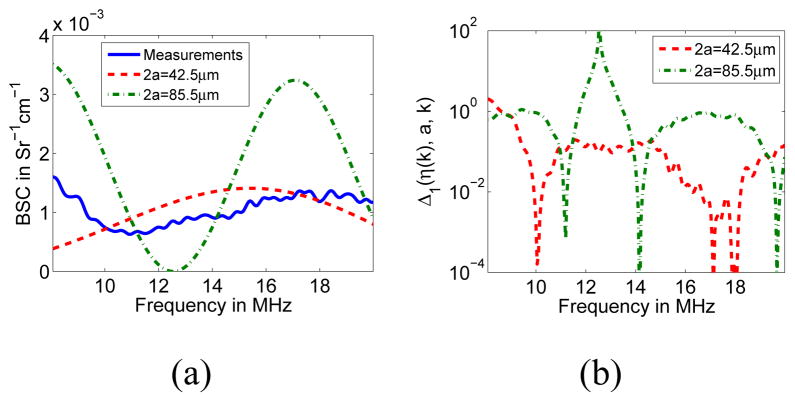
In order to better understand the convergence of estimator 1, Δ1(η (k), a, k) curves corresponding to the first Sephadex phantom are presented in Fig. 8. In particular, the curves were obtained using the 13-MHz transducer data and two values of the assumed scatterer radius a. The first chosen scatterer diameter value, 2a = 42.5 μm, minimized the expression in (5) but did not correspond to an actual sphere size present in the phantom. The second scatterer diameter value, 2a = 85.5 μm, minimized the expression in (9) and is contained within the range of sphere sizes present in the phantom.
Fig. 8.
(a) η curve (solid) and η fit curves corresponding to 2a = 42.5μm (dashed) and 2a = 85.5μm (dot-dashed) for estimator 1. (b) Error curves Δ1(η (k), a, k) corresponding to 2a = 42.5μm (dashed) and 2a = 85.5μm (dot-dashed).
It can be observed in Fig. 8(b) that the large error when fitting η (k) and is mainly due to the very large value of
in the vicinity of 12.6 MHz. From (5) and Fig. 8(a), this is due to having a null at that frequency whereas η (k) does not. In contrast, the absence of a null in resulted in moderate values of and an overall lower Err1(η (k), a) value.
As described in Section II-B3, BSCs corresponding to continuous scatterer size distributions tend not to exhibit the characteristic nulls of BSCs from single-sized scatterers. The nulls of σ (k, a) in (2) are very narrowband and their locations have a linear dependence with a. As a consequence, and as a result of the integral operator in (1), it is expected that η (k) will exhibit local minima that do not reach zero in the presence of a continuous distribution of sphere diameters. Therefore, the error metric in (5) becomes ill-conditioned at frequencies where σ (k, a) exhibits nulls which results in divergence of estimator 1.
2) Estimator 2
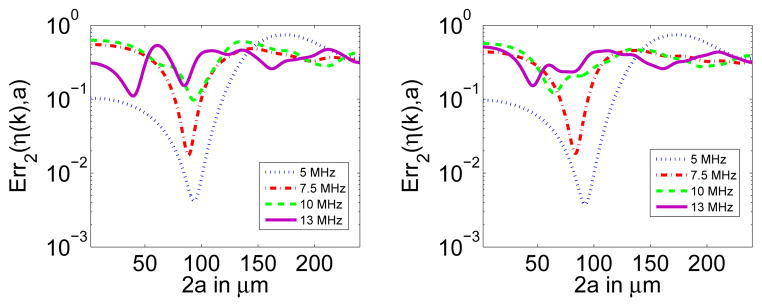
As in Section IV-A1, the Err2(η (k), a) curves corresponding to the experimental Sephadex phantoms are shown in Fig. 9. Of particular interest are the Err2(η (k), a)curves associated with the 13 MHz transducer, which exhibited several local minima. Unlike the case of estimator 1, several minima of the error function had comparable amplitudes. As the analysis center frequency keeps increasing, a local minimum may abruptly overcome the minimum corresponding to a physically meaningful solution. This results in discontinuities in the ESD vs. f0 curves, a not necessarily evident but significant effect observed in several instances in this study such as the simulation results in Fig. 3.
Fig. 9.
Experimental Err2(η (k), a)curves corresponding to the first (left) and second (right) Sephadex sphere phantoms. The error fitting curves correspond to the 5, 7.5, 10, and 13 MHz transducers.
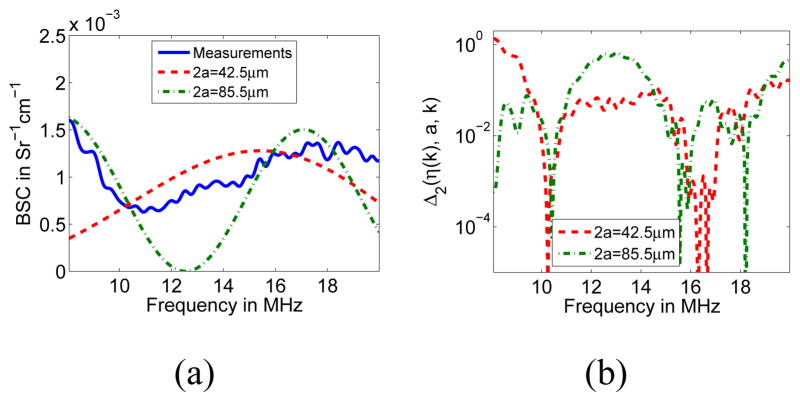
As in Section IV-A1, the Δ2(η (k), a, k) curves corresponding to the 13-MHz transducer data obtained from the first Sephadex phantom are presented in Fig. 10 for 2a = 42.5 μm and 2a = 85.5 μm.
Fig. 10.
(a) η curve (solid) and ηfit curves corresponding to 2a = 42.5μm (dashed) and 2a = 85.5μm (dot-dashed) for estimator 2. (b) Error curves Δ2(η (k), a, k) corresponding to 2a = 42.5μm (dashed) and 2a = 85.5μm (dot-dashed).
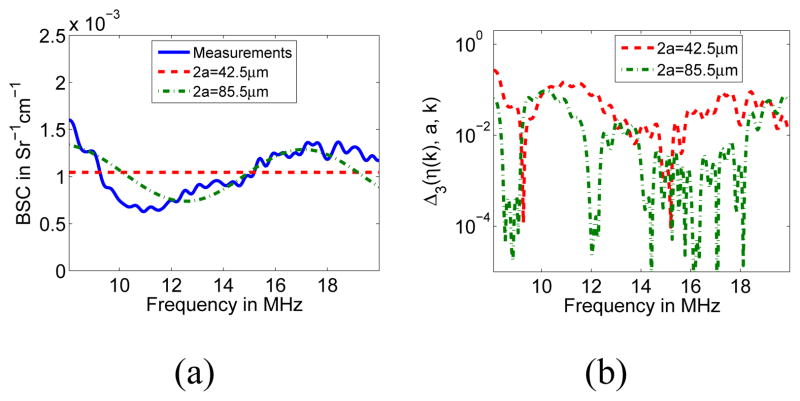
It can be observed in Fig. 10 that the fitted BSCs corresponding to both 2a = 42.5μm and 2a = 85.5μm properly matched the experimental BSC only over certain portions of the analysis band. The BSC corresponding to 2a = 42.5μm was a reasonably good fit only for frequencies above 10 MHz. On the other hand, the BSC corresponding to 2a = 85.5μm was a good fit to the experimental BSC only below 10 MHz and between 15 and 19 MHz. The rest of the analysis band corresponded to the vicinity of the nulls of which could not reproduce the non-zero minima of η (k). As a result, the overall Err2(η (k), a) values for both radii were very close (i.e., 0.123 for 2a = 42.5μm vs. 0.153 for 2a = 85.5μm) despite the fact that the sine-like behavior of the experimental BSC curve was better described by the fitted BSC corresponding to 2a = 85.5μm.
As in the case of estimator 1, estimator 2 is limited by its inability to describe non-zero minima of η (k) when using a single-size model. The reduced sensitivity to zeros in σ (k, a) of the expression in (7) instead of (5) is the main factor that helps in extending the convergence region of estimator 2 over estimator 1.
3) Estimator 3
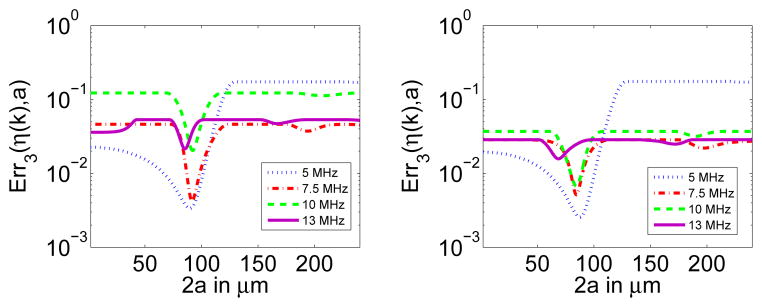
The Err3(η (k), a) curves corresponding to the experimental Sephadex phantoms are shown in Fig. 11, as in Sections IV-A1 and IV-A2. It can be observed that, unlike the case of estimator 2, there is a better distinction between the global minima and the eventual local minima in the error curves.
Fig. 11.
Experimental Err3(η (k), a) curves corresponding to the first (left) and second (right) Sephadex sphere phantoms. The error fitting curves correspond to the 5, 7.5, 10, and 13 MHz transducers.
As in Sections IV-A1 and IV-A2, the Δ3(η (k), a, k) curves corresponding to the 13-MHz transducer data from the first Sephadex phantom are presented in Fig. 12 for 2a = 42.5 μm and 2a = 85.5 μm. As expected from the use of a more general model, the mean square errors were lower than the errors corresponding to estimator 2 (i.e., 0.053 for 2a = 42.5 μm and 0.021 for 2a = 85.5 μm). The constraint β (a) ≥ 0 forced which resulted in being a horizontal line. Further, the introduction of the intercept γ (a) ameliorated the poor fit between the nulls of and the minima of η (k) and resulted in improved convergence in this case.
Fig. 12.
(a) η curve (solid) and ηfit curves corresponding to 2a = 42.5μm (dashed) and 2a = 85.5μm (dot-dashed) for estimator 3. (b) Error curves Δ3(η (k), a, k) corresponding to 2a = 42.5μm (dashed) and 2a = 85.5μm (dot-dashed).
For clarification, it must be stated that it is not suggested here that estimator 3 is guaranteed to converge regardless of the underlying scatterer size distribution. In fact, some results in Figs. 4 and 5 demonstrate that estimator 3 can produce physically meaningless results. However, the results presented in this work suggest that estimator 3 has a better potential to produce physically meaningful results when using the single-size scatterer model in (2) at a low volume concentration of independent scatterers.
B. Effects of the analysis bandwidth
The results in Section III-A suggest that the different estimators are affected differently by the extent of the analysis bandwidth. The convergence of estimator 1 was not significantly affected by Δf% for the values studied in this work. In contrast, the region of convergence of estimator 2 was noticeably reduced in several cases as the fractional bandwidth was reduced. The convergence region of estimator 3 was generally not reduced with reduced analysis bandwidth, but instead was disrupted in relatively narrow frequency bands where divergent estimates were produced. Therefore, these results suggest that the estimation bias of different estimators is affected differently by the analysis bandwidth. As a result, the choice of estimator algorithm may in practice be conditioned by the amount of bandwidth available in the imaging system.
C. Effects of coherent noise
The experimental results shown in Section III-B1 suggest that estimator 3 may be capable of extending the regions of convergence of estimators 1 and 2. However, in practical scenarios the rf data spectrum will contain a coherent scattering component that acts as noise for the purpose of ESD estimation. As a result, it is expected that the convergence of ESD estimation will degrade with increased coherent noise. This hypothesis is confirmed by the experimental results in Section III-B2.
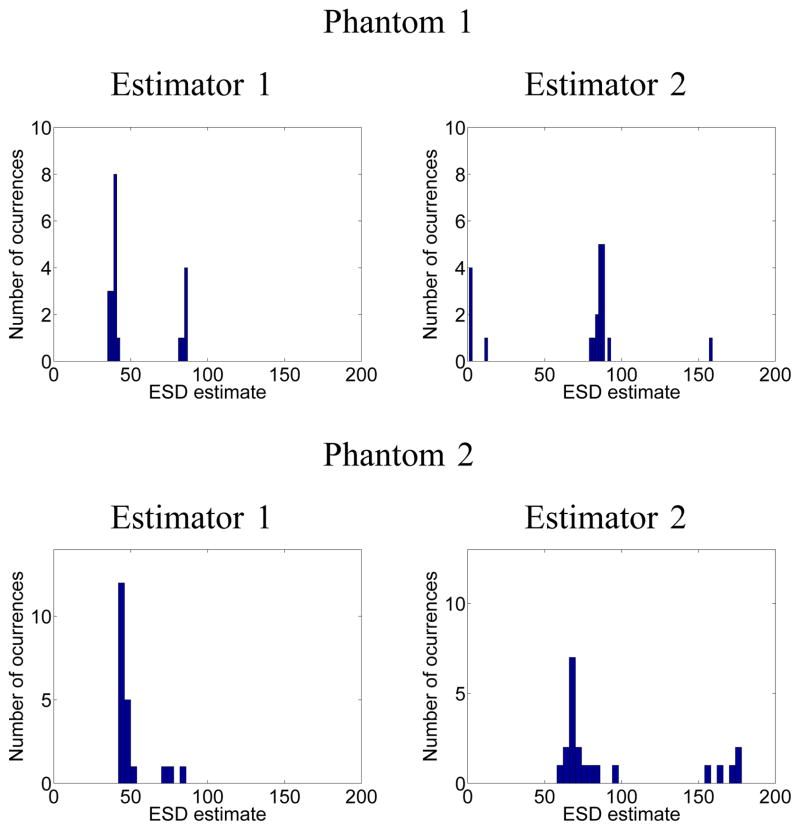
Of particular interest are the results obtained with the highest frequency transducer available, i.e., the 13-MHz transducer. The histograms of the ESD estimates obtained using the 13-MHz transducer for both experimental phantoms using estimators 2 and 3 are shown in Fig. 13. It can be observed that for both estimators the results were clustered. For both estimators, the dominant cluster (i.e., the cluster with the largest number of elements) corresponded to the one with its centroid closer to the estimate obtained from the 441 rf lines (see Section III-B1). Moreover, the dominant clusters contained most of the ESD estimates for all cases (i.e., 15 out of 21 and 3 out of 12 estimates for estimator 2 and phantoms 1 and 2, respectively, and 15 out of 21 and 4 out of 21 estimates for estimator 3 and phantoms 1 and 2, respectively). Therefore, when extracting estimates from a homogeneous region simple strategies such as outlier removal [17] and unsupervised clustering analysis [18], [19] may be used to reduce the effects of coherent noise. It must be stressed, however, that these techniques require a sufficient number of ESD estimates for robust outlier rejection and therefore may not be applicable to very small analysis regions.
Fig. 13.
Histograms of experimental ESD estimates obtained with the 13-MHz transducer using estimators 2 (left column) and 3 (right column).
Finally, an alternative mechanism to reduce the variance of ESD estimation may be to reduce the coherent component of the estimated BSCs. Classic techniques such as Welch’s method [20], [21] may be used towards this end.
D. Significance for ESD estimation
The results presented here raise the question of the proper choice of estimator algorithm together with a proper choice of scattering model. For example, estimator 1 has been previously used for ESD estimation assuming a Gaussian scattering model [20], [21], which does not exhibit nulls and therefore will not suffer from excessive Δ1 error amplification. Another example is the solid sphere scattering model for which convergence for moderately larger ka ranges than the ones reported in this study have been demonstrated using physical phantoms containing glass beads [22].
It should also be emphasized that it is not suggested here that the scattering model ηfit = (βσ(k, a)+ γ) used with estimator 3 is necessarily optimum for the task of material characterization. In particular, the parameter γ so far lacks a physical interpretation. More complex estimation approaches that explicitly consider the presence of a size distribution, such as the one in [23], may provide a more proper description of tissue microstructure. Also, using a scattering model based either on an assumed size distribution [24] or a scatterer with tapered edges [25] may produce better results in combination with estimators 1 and 2 as a result of the reduction of the severity of the nulls in the model. However, a key result derived from this work is that alternative ESD estimator algorithms may provide extended regions of convergence even if a single-size scattering model is used.
The results presented in this work still do not support the hypothesis of higher frequencies being more sensitive to smaller scatterer sizes if a continuous distribution of scatterer sizes exist in the scattering medium. In fact, the results provided here suggest such an observation could be a result of the choice of ESD estimation algorithm. For sufficiently high analysis bandwidths, both estimators 1 and 2 converged to values that monotonically decreased with increasing frequencies regardless of the underlying scatterer size distribution for both simulations and experiments. Estimator 3 provided physically meaningful estimates for all simulations and experiments conducted in this study but it did not converge to a unique, asymptotic value for sufficiently high analysis bandwidths. For example, in simulations and as evidenced in Figs. 3 and 4, estimator 3 produced ESD estimates that approached the upper and lower bounds of scatterer sizes when using uniform and inverse cubic size distributions, respectively. The bell-shaped scatterer size distributions corresponding to the experimental phantoms resulted in convergence to an intermediate value in between the minimum and maximum scatterer size bounds. Therefore, estimator 3 appears to converge to a scatterer size that is heavily dependent on the actual underlying scatterer size distribution. This property may result advantageous for material characterization tasks.
Finally, it is not clear that estimator 3 would necessarily provide better ESD estimates regardless of the underlying scattering sources. This issue is of paramount importance for applications to tissue characterization. Research is still being conducted to identify scattering sources in tissues [26]. Early reports in the literature suggest continuous models such as an exponential form factor may be better suited to characterize tissues [27]. Even for cases where a discrete scattering model may be applicable, such as scattering from blood and cell pellets, effects related to high scatterer volume density may cause deviations from the simple single-size scatterer model used in this work [14], [28]. Therefore, further work is required to clearly understand the symbiosis between scattering models and ESD estimators in the context of tissue characterization.
V. Conclusions
Three algorithms for ESD estimation were studied in this work when using a fluid sphere scattering model. Both simulations and experimental results suggest the choice of estimator algorithms may have a profound impact on the behavior of ESD estimates, with some algorithms being capable of producing physically meaningful ESD estimates for larger analysis frequency ranges.
Acknowledgments
The authors would like to thank Drs. Goutam Ghoushal and Michael Insana for useful discussions. This work was supported by NIH Grants CA139095 and EB008992 and PUCP Grant DGI2010-0105.
Footnotes
Although the work in [13] used a least mean square criterion for BSC fitting, the theoretical model in that work considered the effect of dense scatterer populations.
Contributor Information
Roberto Lavarello, Email: lavarello.rj@pucp.edu.pe, Sección Electricidad y Electrónica, Pontificia Universidad Católica del Perú, Lima, Perú.
Michael Oelze, Department of Electrical and Computer Engineering, University of Illinois at Urbana-Champaign, Urbana, IL 61801 USA.
References
- 1.Sigelmann RA, Reid JM. Analysis and measurement of ultrasound backscattering from an ensemble of scatterers excited by sine-wave bursts. Journal of the Acoustical Society of America. 1973 May;53(5):1351–1355. [Google Scholar]
- 2.Campbell JA, Waag RC. Normalization of ultrasonic scattering measurements to obtain average differential scattering cross sections for tissues. Journal of the Acoustical Society of America. 1983 Aug;74(2):393–399. doi: 10.1121/1.389832. [DOI] [PubMed] [Google Scholar]
- 3.Lizzi FL, Greenebaum M, Feleppa EJ, Elbaurn M. Theoretical framework for spectrum analysis in ultrasonic tissue characterization. Journal of the Acoustical Society of America. 1983 Apr;73(4):1366–1373. doi: 10.1121/1.389241. [DOI] [PubMed] [Google Scholar]
- 4.Madsen EL, Insana MF, Zagzebski JA. Method of data reduction for accurate determination of acoustic backscatter coefficients. Journal of the Acoustical Society of America. 1984 Sep;76(3):913–923. doi: 10.1121/1.391317. [DOI] [PubMed] [Google Scholar]
- 5.Ueda M, Ozawa Y. Spectral analysis of echoes for backscattering coefficient measurement. Journal of the Acoustical Society of America. 1985 Jan;77(1):38–47. [Google Scholar]
- 6.Chen X, Phillips D, Schwarz KQ, Mottley JG, Parker KJ. The measurement of backscatter coefficient from a broadband pulse-echo system: a new formulation. IEEE Transactions on Ultrasonics, Ferroelectrics, and Frequency Control. 1997 Mar;44(2):515–525. doi: 10.1109/58.585136. [DOI] [PubMed] [Google Scholar]
- 7.Insana MF, Wagner RF, Brown DG, Hall TJ. Describing small-scale structure in random media using pulse-echo ultrasound. Journal of the Acoustical Society of America. 1990 Jan;87(1):179–192. doi: 10.1121/1.399283. [DOI] [PMC free article] [PubMed] [Google Scholar]
- 8.Lizzi FL, Astor M, Liu T, Deng C, Coleman DJ, Silverman RH. Ultrasonic spectrum analysis for tissue assays and therapy evaluation. International Journal of Imaging Systems and Technology. 1997;8(1):3–10. [Google Scholar]
- 9.Oelze ML, Zachary JF, O’Brien WD., Jr Characterization of tissue microstructure using ultrasonic backscatter: Theory and technique for optimization using a Gaussian form factor. Journal of the Acoustical Society of America. 2002 Sep;112(3):1202–1211. doi: 10.1121/1.1501278. [DOI] [PubMed] [Google Scholar]
- 10.Lavarello R, Oelze M. Quantitative ultrasound estimates from populations of scatterers with continuous size distributions. IEEE Transactions on Ultrasonics, Ferroelectrics, and Frequency Control. 2011 Apr;58(4):744–753. doi: 10.1109/TUFFC.2011.1867. [DOI] [PubMed] [Google Scholar]
- 11.Insana MF, Hall TJ. Parametric ultrasound imaging from backscatter coefficient measurements: Image formation and interpretation. Ultrasonic Imaging. 1990 Oct;12(4):245–267. doi: 10.1177/016173469001200402. [DOI] [PubMed] [Google Scholar]
- 12.Gerig AL, Varghese T, Zagzebski JA. Improved parametric imaging of scatterer size estimates using angular compounding. IEEE Transactions on Ultrasonics, Ferroelectrics, and Frequency Control. 2004 Jun;51(6):708–715. [PubMed] [Google Scholar]
- 13.Franceschini E, Yu FTH, Destrempes F, Cloutier G. Ultrasound characterization of red blood cell aggregation with intervening attenuating tissue-mimicking phantoms. Journal of the Acoustical Society of America. 2010 Feb;127(2):1104–1115. doi: 10.1121/1.3277200. [DOI] [PMC free article] [PubMed] [Google Scholar]
- 14.Han A, Abuhabsah R, Blue JP, Jr, Sarwate S, O’Brien WD., Jr Ultrasonic backscatter coefficient quantitative estimates from high-concentration Chinese hamster ovary cell pellet biophantoms. Journal of the Acoustical Society of America. 2011 Dec;130(6):4139–4147. doi: 10.1121/1.3655879. [DOI] [PMC free article] [PubMed] [Google Scholar]
- 15.Anderson JJ, Herd MT, King MR, Haak A, Hafez ZT, Song J, Oelze ML, Madsen EL, Zagzebski JA, O’Brien WD, Jr, Hall TJ. Interlaboratory comparison of backscatter coefficient estimates for tissue-mimicking phantoms. Ultrasonic Imaging. 2010;32:48–64. doi: 10.1177/016173461003200104. [DOI] [PMC free article] [PubMed] [Google Scholar]
- 16.Oelze ML, O’Brien WD., Jr Frequency-dependent attenuation-compensation functions for ultrasonic signals backscattered from random media. Journal of the Acoustical Society of America. 2002 May;111(5):2308–2319. doi: 10.1121/1.1452743. [DOI] [PubMed] [Google Scholar]
- 17.Lavarello R, Berggren M, Johnson S, Orescanin M, Yapp R, Oelze M. Implementation of scatterer size imaging on an ultrasonic breast tomography scanner. Proceedings of the IEEE Ultrasonics Symposium. 2009:305–308. [Google Scholar]
- 18.McQueen J. Some methods for classification and analysis of multivariate observations. Proceedings of the Fifth Berkeley Symposium on Mathematical Statistics and Probability. 1967:281–297. [Google Scholar]
- 19.Dempster AP, Laird NM, Rubin DB. Maximum likelihood from incomplete data via the EM algorithm. Journal of the Royal Statistical Society, Series B (Methodological) 1977;39(1):1–38. [Google Scholar]
- 20.Ghoshal G, Oelze ML. Improved scatterer property estimates from ultrasound backscatter using gate-edge correction and a pseudo-Welch technique. IEEE Transactions on Ultrasonics, Ferroelectrics, and Frequency Control. 2010 Dec;57(12):2828–2832. doi: 10.1109/TUFFC.2010.1756. [DOI] [PMC free article] [PubMed] [Google Scholar]
- 21.Liu W, Zagzebski JA. Trade-offs in data acquisition and processing parameters for backscatter and scatterer size estimations. IEEE Transactions on Ultrasonics, Ferroelectrics, and Frequency Control. 2010 Feb;57(2):340–352. doi: 10.1109/TUFFC.2010.1414. [DOI] [PMC free article] [PubMed] [Google Scholar]
- 22.Lavarello R, Ghoshal G, Oelze M. On the estimation of backscatter coefficients using single-element focused transducers. Journal of the Acoustical Society of America. 2011 May;129(5):2903–2911. doi: 10.1121/1.3557036. [DOI] [PMC free article] [PubMed] [Google Scholar]
- 23.Mamou J, Oelze ML, O’Brien WD, Jr, Zachary JF. Extended three-dimensional impedance map methods for identifying ultrasonic scattering sites. Journal of the Acoustical Society of America. 2008 Feb;123(2):1195–1208. doi: 10.1121/1.2822658. [DOI] [PMC free article] [PubMed] [Google Scholar]
- 24.Teisseire M, Han A, Abuhabsah R, Blue JP, Jr, Sarwate S, O’Brien WD., Jr Ultrasonic backscatter coefficient quantitative estimates from Chinese hamster ovary cell pellet biophantoms. Journal of the Acoustical Society of America. 2010 Nov;128(5):3175–3180. doi: 10.1121/1.3483740. [DOI] [PMC free article] [PubMed] [Google Scholar]
- 25.Oelze ML, O’Brien WD., Jr Application of three scattering models to the characterization of solid tumors in mice. Ultrasonic Imaging. 2006 Apr;28(2):83–96. doi: 10.1177/016173460602800202. [DOI] [PubMed] [Google Scholar]
- 26.Dapore AJ, King MR, Harter J, Sarwate S, Oelze ML, Zagzebski JA, Do MN, Hall TJ, OBrien WD., Jr Analysis of human fibroadenomas using three-dimensional impedance maps. IEEE Transactions on Medical Imaging. 2011 Jun;30(6):1206–1213. doi: 10.1109/TMI.2011.2108308. [DOI] [PMC free article] [PubMed] [Google Scholar]
- 27.Nicholas D. Evaluation of backscattering coefficients for excised human tissues: results, interpretation, and associated measurements. Ultrasound in Medicine and Biology. 1982;8(1):17–28. [Google Scholar]
- 28.Franceschini E, Metzger B, Cloutier G. Forward problem study of an effective medium model for ultrasound blood characterization. IEEE Transactions on Ultrasonics, Ferroelectrics, and Frequency Control. 2011 Dec;58(12):2668–2679. doi: 10.1109/TUFFC.2011.2129. [DOI] [PubMed] [Google Scholar]


