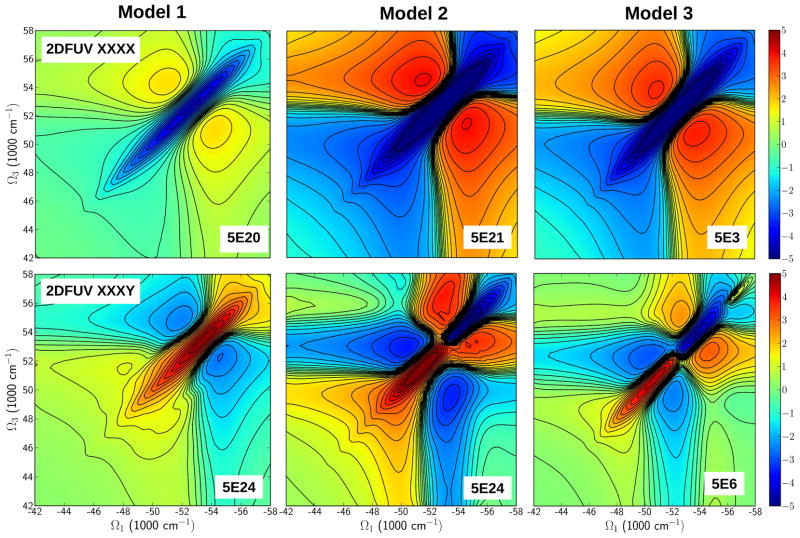
Figure 8.
Same as in Figure 5 but for the 2DFUV regime. Top row: The non-chiral (xxxx) polarization configuration. All models display similar pattern but different intensities. Bottom row: chirality induced (xxxy) polarization configuration. Model 1 displays a strong peak at 52000 cm−1 while in Models 2 and 3 display butterfly-like shapes with two peaks in the 50000 cm−1 to 54000 cm−1 regime. Model 3 shows a small additional peak at 57000 cm−1.

