Abstract
This study evaluated agreement among three generations of ActiGraph™ accelerometers in children and adolescents. Participants (N=29, mean age = 14.2 ± 3.0 y) completed two laboratory-based activity sessions, each lasting 60 minutes. During each session, participants concurrently wore three different models of the ActiGraph accelerometers (GT1M, GT3X, GT3X+). Agreement among the three models for vertical axis (VA) counts, vector magnitude (VM) counts, and time spent in MVPA was evaluated by calculating ICCs and Bland-Altman plots. The ICCs for total VA counts, total VM counts, and estimated MVPA were 0.994 (95% C.I. = 0.989 – 0.996), 0.981 (95% C.I.= 0.969 – 0.989), and 0.996 (95% C.I.= 0.989 – 0.998), respectively. Inter-monitor differences for total VA and VM counts ranged from 0.3% to 1.5%, while inter-monitor differences for estimated MVPA were equal to or close to zero. On the basis of these findings, we conclude that there is strong agreement between the GT1M, GT3X and GT3X+ activity monitors, thus making it acceptable for researchers and practitioners to use different ActiGraph™ models within a given study.
Keywords: Physical activity, assessment, objective measurement, accelerometer, youth
Introduction
Given the limitations associated with self-report measures (Troiano, 2007), and that objective measures such as indirect calorimetry and direct observation are not feasible in free-living physical activity studies (Corder, Brage, Ramachandran, Snehalatha, Wareham, & Ekelund, 2007), accelerometers have become the most widely used objective measure of physical activity (Chen & Bassett, 2005;Troiano, 2005; Trost, 2007). Currently, there are several commercially available accelerometer-based motion sensors (ActiGraph™, Actical™, RT3™); however, the ActiGraph™ line is the most commonly used accelerometer in physical activity research, particularly in studies involving children and adolescents (Trost, McIver, & Pate, 2005).
In response to feedback from research community and technological advances in the micro processing technology (e.g. the use of MEMS capacitance accelerometers and expanded on-board memory), ActiGraph™ has developed several models since 2005, including the GT1M, GT3X, and most recently, the GT3X+. These three models have multiple technological differences including: memory size, battery life, sampling frequency, epoch settings, and number of axes they can measure, among others. Despite these differences, the GT1M, GT3X, and GT3X+ are all currently used in physical activity research. Moreover, within a given study, researchers often collect data using a combination of the three models.
Although all three ActiGraph™ models (GT1M, GT3X, GT3X+) are concurrently used in the field, the agreement among these devices has yet to be adequately explored. Sasaki, John, and Freedson (2011) reported strong agreement in vertical axis counts recorded by the GT1M and the GT3X among adults during treadmill walking. However, the comparability of the count data recorded by the newer GT3X+ model has not been evaluated. Furthermore, the agreement among devices during free-living lifestyle activities still needs to be assessed; and to our knowledge, no previous study has evaluated inter-monitor agreement in an age-diverse sample of children and adolescents.
Therefore, the purpose of this study was to evaluate the agreement among three generations of ActiGraph activity monitors (GT1M, GT3X, GT3X+) with respect to total vertical axis (VA) counts, total vector magnitude (VM) counts, and time spent in MVPA in children and adolescents. We evaluated inter-monitor differences in predicted MVPA levels because accelerometer-based motion sensors are most commonly used to estimate time spent in MVPA and compliance with public health physical activity recommendations.
Methods
Participants
Twenty-nine children and adolescents (17 male, 12 female) aged 7- to 18-years participated in the study. The participants were a randomly selected subsample from a larger study examining the longitudinal validity of accelerometry in youth (Trost, Loprinzi, Moore, & Pfeiffer, 2011). The sample had an even distribution across the age range and a mean age of 14.2 ± 3.0 years. With the exception of two participants, all were in the “healthy weight” category according to the Center for Disease Control and Prevention (CDC) Body Mass Index (BMI) weight status categories (mean BMI percentile 53.3 ± 25.2; body mass 53.5 ± 12.6 kg; height 163.5cm ± 14.1). Prior to participation, parental written consent and child assent was obtained. The study was approved by the Oregon State University institutional review board.
Protocol
Participants completed a series of standardized activity trials during two laboratory-based activity sessions. The two activity sessions were completed within a two week window and were between 45 and 60 minutes in duration. During each session, participants concurrently wore three different models of the ActiGraph accelerometer-based activity monitor (GT1M, GT3X, GT3X+) and a Polar heart rate monitor. Prior to each activity session, the monitors were initialized according to manufacturer specifications and attached to a flexible elastic belt that was fastened snugly around the waist of the participant. The GT1M and GT3X models were initialized to collected data in 1-sec epochs. The GT3X+ was set to collect raw tri-axial acceleration signal at 30 Hz. These data were subsequently processed into 1-sec epochs post download. All data were processed using ActiGraph’s conventional band pass filtering algorithm. The monitors were positioned on the right hip at the anterior-, mid-and posterior-axillary lines. The placement of each ActiGraph™ model was rotated and counterbalanced in order to avoid any potential order or placement effects.
During the first activity session the following six activity trials were performed: lying down, hand writing, laundry task, throw and catch, comfortable overground walk, and aerobic dance. The session finished with a five minute treadmill familiarization trial. During the second activity session the following six activity trials were completed: computer game, floor sweeping, brisk overground walk, basketball, overground run/jog, and brisk treadmill walk. Each activity was performed for five minutes, except for lying down which was performed for 10 minutes. Participants rested between each trial until their heart rate values were within 20% of their resting level. A complete description of each activity trial is provided in Table 1
Table 1.
Description of the 12 activity trials
| Activity Type | Activity Trial | Intensity | Description of Activity Trial |
|---|---|---|---|
| Resting | Lying Down (LD) | Sedentary | Lie on floor mat or cot in supine position., awake with arms at side. Instructed to minimize all bodily movements. |
|
| |||
| Sitting | Hand writing (HW) | Sedentary | While sitting in a chair at a desk, use a ball point pen and a pad of paper to transcribe a standardized written script. |
| Computer game (CG) | Sedentary | Seated in a chair at a desk and playing a self- selected on-line computer game. Game is played by using keyboard and/or mouse | |
|
| |||
| Lifestyle | Sweeping Floor (SW) | Light | Within a 5′ × 10′ area, sweep confetti on floor continuously with a broom into a marked 1′ × 1′ box at both ends and repeating. |
| Throw and Catch (TC) | Light | Underarm throw and catch a ball while standing 5–10 ft from a research assistant at rate of 15 throws per min. Distance = 5 ft for ages 6–7 y, 8 ft for ages 8–11 y, and 10 ft for ≥ 12 y. | |
| Laundry Task (LT) | Light | Load a laundry basket with 5 towels and carry it 10 feet; then dump out the towels, fold them, load them back in the basket, carry it back to the original starting spot and repeat. | |
| Aerobics (AE) | Moderate | Follow a simple aerobics video. Routine included simple arm and leg movements. Marching in place and touch steps with bicep curls and upright rows. | |
| Basketball (BB) | Vigorous | Shoot a basketball using an 8 ft or regulation hoop. Shoot the ball, rebound and chase after the ball continuously. Participant instructed to keep the ball within 15′ × 15′ boundary. Given a new basketball if it leaves the boundary. | |
|
| |||
| Ambulatory | Comfortable walk (CW) | Light | Walk at a self-selected comfortable speed around the marked perimeter of an indoor gymnasium (1 lap = 63 m). |
| Brisk walk (BW) | Moderate | Walk at a self-selected brisk speed around the marked perimeter of an indoor gymnasium (1 lap = 63m) | |
| Brisk walk (TM) | Moderate | Walk on a treadmill at speed equal to that achieved during the brisk walking trial. | |
| Run (RU) | Vigorous | Run at a self-selected speed around the marked perimeter of an indoor gymnasium (1 lap = 63m) | |
Instrumentation
GT1M
The ActiGraph™ GT1M (ActiGraph, LLC, Pensacola, FL), released in February 2005, is a small, light weight motion sensor (3.8cm × 3.7cm × 1.8cm, 27g) that measures and records time varying accelerations in two axes (vertical and medio-lateral) ranging in magnitude from 0.05–2.0g. The acceleration output is digitized by a 12-bit analog-to-digital converter (ADC) at a rate of 30Hz. Once digitized, the output signal passes through a filter that band limits the device to a frequency range of 0.25–2.5Hz.
GT3X
The ActiGraph™ GT3X (ActiGraph, Pensacola, FL), released in February 2009, is similar in size to the GT1M; however, in addition to the vertical and medio-lateral axes, it includes a third measurement axis (antero-posterior). The GT3X measures and records time varying accelerations that range in magnitude from 0.05–2.5g which are subsequently digitized by a 12-bit analog-to-digital converter at a rate of 30Hz. Once digitized, the output signal passes through a filter that band limits the device to a frequency range of 0.25–2.5 Hz.
GT3X+
The ActiGraph™ GT3X+ (ActiGraph, Pensacola, FL), released in September 2010, has a slightly different shape and weight than the other two models at 4.6cm × 3.3cm × 1.5cm, 19g. The GT3X+ is a tri-axial accelerometer that measures and records time varying accelerations that range in magnitude from ± 6g. The acceleration output for the GT3X+ is digitized by a 12-bit analog-to-digital converter at a user specified rate ranging between 30 and 100Hz. The raw acceleration data from each axis are then stored in memory for future analysis. This raw acceleration data can be analyzed directly or further processed into counts per unit of time by the ActiGraph™ propriety software.
Data Reduction
After downloading the accelerometer data and creating a “dat” file using the ActiLife software, a customized EXCEL Macro was used to extract and sum the second-by-second count data recorded by each participant’s monitor across the duration of each laboratory visit. To evaluate time spent in moderate to vigorous physical activity (MVPA), VA counts per second data were reintegrated into 15s epochs and classified as MVPA using the count thresholds developed by Evenson, Catellier, Gill, Ondrak, and McMurray (2008). The Evenson cut-points were selected on the basis of our previous work showing them to be the best performing MVPA cut-point among children of different ages (Trost et al., 2011).
Statistical Analyses
All data were analyzed on an individual participant basis and inter-monitor agreement was calculated for the participant’s total VA counts score, total VM counts score, and predicted MVPA score for each lab visit. Agreement among the three models was evaluated by calculating intraclass correlation coefficients (ICCs). ICC’s were calculated using a two-way mixed model ANOVA with the assumption of absolute agreement. Additionally, Bland-Altman plots were created to evaluate mean bias and the limits of agreement between each monitor for both total counts and time spent in MVPA (Bland & Altman, 1986). All statistical analyses were performed using MedCalc software, Version 10.4.
Results
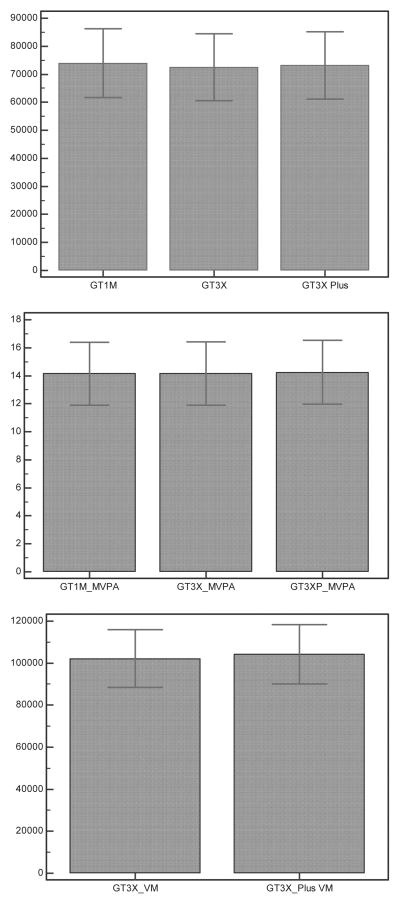
Means and 95% C.I.’s for total VA counts, total VM counts, and MVPA for the three models are presented in Figure 1. Following the agreement ratings suggested by Landis and Koch (1977) there was almost perfect agreement between the three ActiGraph models. The ICCs for total VA counts, total VM counts, and estimated MVPA were 0.994 (95% C.I. = 0.989 – 0.996), 0.981 (95% C.I.= 0.969 – 0.989), and 0.996 (95% C.I.= 0.989 – 0.998), respectively.
Figure 1.
Means and 95% C.I.’s for total vertical axis counts (A), total vector magnitude counts (B) and moderate to vigorous physical activity (MVPA) (C) for the GT1M, GT3X, and GT3X+ activity monitors.
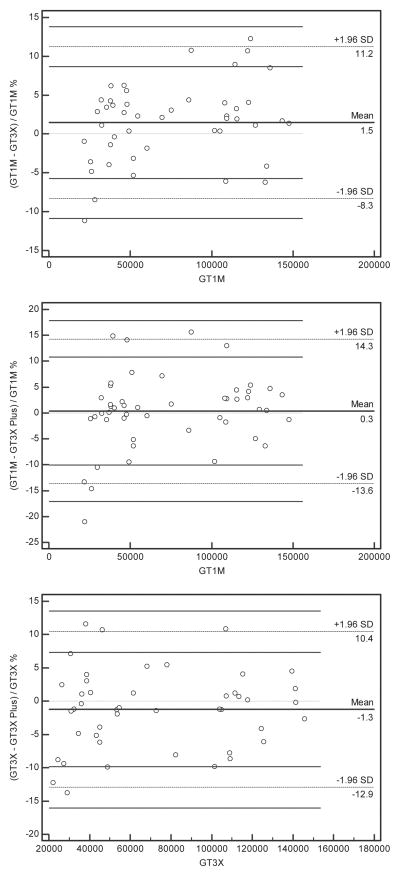
Bland-Altman plots depicting the mean bias and 95% limits of agreement for total VA counts recorded by the GT1M and GT3X, GT1M and GT3X+, and GT3X and GT3X+ are displayed in Figure 2. Because differences in total VA and VM counts exhibited strong evidence of heteroscedasticity, between-model differences were plotted as a percentage of the referent accelerometer model [100 × (Model A − Model B)/Model A]. Bias estimates for the GT3X and GT3X+ relative to the GT1M were 1.5% and 0.3%, respectively. Thus, on average, VA counts recorded by the GT3X were 1.5% lower than that recorded by GT1M. Bias for GT3X+ relative to the GT3X was −1.3%. Thus, on average, VA counts recorded by the GT3X+ were 1.3% higher than that recorded by GT3X. The corresponding 95% limits of agreement were −8.3% to 11.2% (GT3X vs. GT1M), −13.6% to 14.3% (GT3X+ vs. GT1M ), and −12.9% to 10.4% (GT3X+ vs. GT3X).
Figure 2.
Mean bias and 95% limits of agreement for total vertical axis counts recorded by the GT1M and GT3X (A), GT1M and GT3X+ (B), and GT3X and GT3X+ (C).
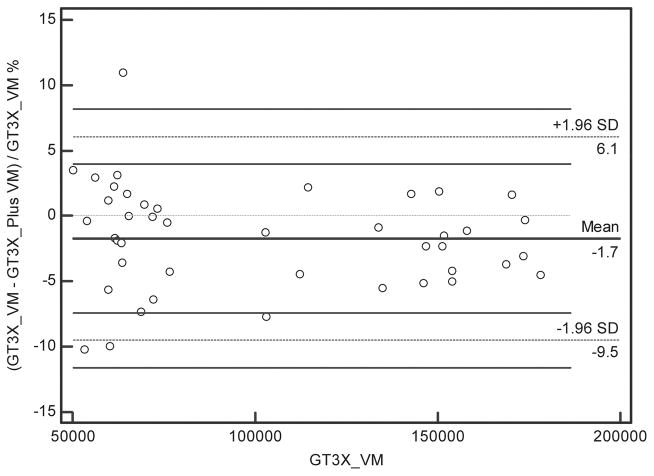
A Bland-Altman plot depicting mean bias and 95% limits of agreement for total VM counts recorded by the GT3X and GT3X+ is displayed in Figure 3. Bias for the GT3X+ relative to the GT3X was −1.7%. The corresponding 95% limits of agreement were −9.5% to 6.1%.
Figure 3.
Mean bias and 95% limits of agreement for total vector magnitude counts recorded by the GT3X and GT3X+.
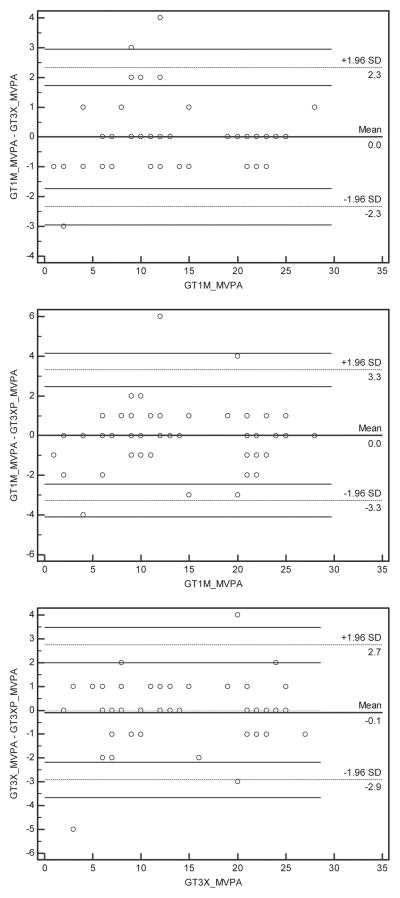
Bland-Altman plots depicting the mean bias and 95% limits of agreement for MVPA estimates provided by three generations of monitors are displayed in Figure 4. Zero systematic bias was observed for GT3X and GT3X+ relative to the GT1M, while bias for the GT3X+ relative to the GT3X was just −0.1 min. The corresponding 95% limits of agreement were −2.3 to 2.3 min (GT1M vs. GT3X), −3.3 to 3.3 min (GT1M vs. GT3X+), and −2.9 to 2.7 min (GT3X vs. GT3X+).
Figure 4.
Mean bias and 95% limits of agreement for MVPA estimates provided by the GT1M and GT3X (A), GT1M and GT3X+ (B), and GT3X and GT3X+ (C).
Discussion
In order to directly compare activity counts or estimated time spent in MVPA from different ActiGraph™ models, it is important to know how well they agree. To address this important methodological issue, the present study evaluated agreement among the three most recent ActiGraph models in children and adolescents performing a variety of lifestyle activities. The results demonstrated that vertical axis counts and the resultant MVPA estimates provided by the GT1M, GT3X, and GT3X+ models are highly comparable. In addition, vector magnitude counts recorded by the GT3X and GT3X+ were highly comparable. The ICC’s for total counts and estimated MVPA were 0.99 and 0.98, respectively. The ICC for total vector magnitude counts was 0.99. Inter-monitor differences for total and vector magnitude counts ranged from 0.6% to 1.6%, while inter-monitor differences for estimated MVPA were equal to or close to zero. On the basis of these findings, we conclude that there is strong agreement between the GT1M, GT3X and GT3X+ activity monitors, thus making it acceptable for researchers and practitioners to use different ActiGraph models within a given study. Moreover, researchers using the newer GT3X and GT3X+ models may use the vertical axis count thresholds established for earlier uniaxial ActiGraph models (7164 and GT1M) to estimate time spent in moderate to vigorous intensity physical activity.
Previous investigations have evaluated differences in activity counts among earlier generations of ActiGraph accelerometers (Corder et al., 2007; Rothney, Apker, Song, & Chen, 2008; John, Tyo, & Bassett, 2010; Kozey, Staudenmayer, Troiano, & Freedson, 2010; Sasaki et al., 2011). Of these studies, all but one compared activity counts from the original 7164 and the GT1M models. Most studies (Rothney et al., 2007; John et al., 2010; Kozey et al., 2010), but not all (Corder et al., 2007), concluded that vertical axis counts recorded by the 7164 and GT1M models were highly comparable. Most recently, Sasaki and colleagues (2011) compared activity counts recorded by the GT1M and GT3X in young adults performing treadmill exercise. Consistent with the results of the present study, there were no significant differences between vertical axis counts recorded by the GT1M and GT3X during walking and running. Additionally, the mean bias and 95% limits of agreement for counts per minute (cpm) reported in their study were similar in magnitude to those observed in the present study.
A novel aspect of this study was the comparison of the recently released GT3X+ with earlier ActiGraph™ models. Unlike earlier generations, the GT3X+ does not store processed count data in user-specified epochs. Instead, raw acceleration data (g’s) is collected at a user-specified sampling rate (30 – 100 Hz) and post-processed using propriety software. Importantly, the user is free to select any data configuration (number of axes, epoch length, steps, inclinometer function) after downloading and storing the data. Given this fundamental difference, the comparability of the data with earlier models has been a lingering question among physical activity researchers and practitioners. The results of the present study provide an independent confirmation of the manufacturers claim that the GT3X+ is fully backward compatible with earlier models; and that data collected by the GT3X+ can be accurately and reliably compared to data collected with the GT3X and GT1M models.
There are several limitations in the present study that warrant consideration. First, in light of the fact that existing algorithms and cut-points for MVPA are based exclusively on the vertical axis, we could not compare MVPA estimates based on the vector magnitude counts provided by the GT3X and GT3X+. Second, the 7164 model was not included in this study, so we can only indirectly infer from studies comparing the 7164 to the GT1M that vertical axis output from the GT3X and the GT3X+ are fully backward compatible with this model. Offsetting these limitations was a number of strengths. First, the study is the first to evaluate the backwards comparability of the new GT3X + model. Second, agreement among the three monitors was evaluated in an age-diverse sample of children and adolescents. Third, even though agreement was assessed under controlled conditions, we examined agreement for accelerometer output collected over the entire 60 minute laboratory visit and not just individual activities. Notably both activity sessions included lifestyle activities and ambulatory activities that are commonly performed by children and adolescents.
In summary, accelerometer counts and time spent in MVPA measured by the ActiGraph™ GT1M, GT3X, and GT3X+ demonstrate strong agreement. Furthermore, cut points developed in the vertical axis from the 7164 and the GT1M can be applied to data collected by GT3X and GT3X+. Therefore the three models may be considered “interchangeable” and it is acceptable for researchers and practitioners to use multiple ActiGraph models within a given study.
References
- Bland JM, Altman DG. Statistical methods for assessing agreement between two methods of clinical measurement. Lancet. 1986;327:307–310. [PubMed] [Google Scholar]
- Chen KY, Bassett DR. The technology of accelerometry-based activity monitors: current and future. Medicine and Science in Sports and Exercise. 2005;37:S490–500. doi: 10.1249/01.mss.0000185571.49104.82. [DOI] [PubMed] [Google Scholar]
- Corder K, Brage S, Ramachandran A, Snehalatha C, Wareham N, Ekelund U. Comparison of two ActiGraph models for assessing free-living physical activity in Indian adolescents. Journal of Sports Sciences. 2007;25:1607–1611. doi: 10.1080/02640410701283841. [DOI] [PubMed] [Google Scholar]
- Evenson KR, Catellier DJ, Gill K, Ondrak KS, McMurray RG. Calibration of two objective measures of physical activity for children. Journal of Sports Science. 2008;26:1557–1565. doi: 10.1080/02640410802334196. [DOI] [PubMed] [Google Scholar]
- John D, Tyo B, Bassett DR. Comparison of four ActiGraph accelerometers during walking and running. Medicine and Science in Sports and Exercise. 2010;42:368–374. doi: 10.1249/MSS.0b013e3181b3af49. [DOI] [PMC free article] [PubMed] [Google Scholar]
- Kozey SL, Staudenmayer JW, Troiano RP, Freedson PS. A comparison of the ActiGraph 7164 and the ActiGraph GT1M during self-paced locomotion. Medicine and Science in Sports and Exercise. 2010;42:971–976. doi: 10.1249/MSS.0b013e3181c29e90. [DOI] [PMC free article] [PubMed] [Google Scholar]
- Landis J, Koch G. The measurement of observer agreement for categorical data. Biometrics. 1977;33:159–174. [PubMed] [Google Scholar]
- Rothney MP, Apker GA, Song Y, Chen KY. Comparing the performance of three generations of ActiGraph accelerometers. Journal of Applied Physiology. 2008;105:1091–1097. doi: 10.1152/japplphysiol.90641.2008. [DOI] [PMC free article] [PubMed] [Google Scholar]
- Sasaki JE, John D, Freedson PS. Validation and comparison of ActiGraph activity monitors. Journal of Science and Medicine in Sport. 2011;14:411–416. doi: 10.1016/j.jsams.2011.04.003. [DOI] [PubMed] [Google Scholar]
- Troiano RP. A timely meeting: objective measurement of physical activity. Medicine and Science in Sports and Exercise. 2005;37:S487–489. doi: 10.1249/01.mss.0000185473.32846.c3. [DOI] [PubMed] [Google Scholar]
- Troiano RP. Large-scale applications of accelerometers: new frontiers and new questions. Medicine and Science in Sports and Exercise. 2007;39:1501. doi: 10.1097/mss.0b013e318150d42e. [DOI] [PubMed] [Google Scholar]
- Trost SG. Measurement of physical activity in children and adolescents. American Journal of Lifestyle Medicine. 2007;1:299–314. [Google Scholar]
- Trost SG, Loprinzi PD, Moore RM, Pfeiffer KA. Comparison of accelerometer cut points for predicting activity intensity in youth. Medicine and Science in Sports and Exercise. 2011;43:1360–1368. doi: 10.1249/MSS.0b013e318206476e. [DOI] [PubMed] [Google Scholar]
- Trost SG, McIver KL, Pate RR. Conducting accelerometer-based activity assessments in field-based research. Medicine and Science in Sports and Exercise. 2005;37:S531–543. doi: 10.1249/01.mss.0000185657.86065.98. [DOI] [PubMed] [Google Scholar]
- Welk GJ. Principles of design and analyses for the calibration of accelerometry-based activity monitors. Medicine and Science in Sports and Exercise. 2005;37:S501–511. doi: 10.1249/01.mss.0000185660.38335.de. [DOI] [PubMed] [Google Scholar]


