

Abstract
Despite the importance of blood flow on brainstem control of respiratory and autonomic function, little is known about regional cerebral blood flow (CBF) during changes in arterial blood gases. We quantified: (1) anterior and posterior CBF and reactivity through a wide range of steady-state changes in the partial pressures of CO2 ( ) and O2 (
 ) in arterial blood, and (2) determined if the internal carotid artery (ICA) and vertebral artery (VA) change diameter through the same range. We used near-concurrent vascular ultrasound measures of flow through the ICA and VA, and blood velocity in their downstream arteries (the middle (MCA) and posterior (PCA) cerebral arteries). Part A (n= 16) examined iso-oxic changes in
  , consisting of three hypocapnic stages (
 =∼15, ∼20 and ∼30 mmHg) and four hypercapnic stages (
 =∼50, ∼55, ∼60 and ∼65 mmHg). In Part B (n= 10), during isocapnia,
  was decreased to ∼60, ∼44, and ∼35 mmHg and increased to ∼320 mmHg and ∼430 mmHg. Stages lasted ∼15 min. Intra-arterial pressure was measured continuously; arterial blood gases were sampled at the end of each stage. There were three principal findings. (1) Regional reactivity: the VA reactivity to hypocapnia was larger than the ICA, MCA and PCA; hypercapnic reactivity was similar. With profound hypoxia (35 mmHg) the relative increase in VA flow was 50% greater than the other vessels. (2) Neck vessel diameters: changes in diameter (∼25%) of the ICA was positively related to changes in
  (R2, 0.63 ± 0.26; P < 0.05); VA diameter was unaltered in response to changed
  but yielded a diameter increase of +9% with severe hypoxia. (3) Intra- vs. extra-cerebral measures: MCA and PCA blood velocities yielded smaller reactivities and estimates of flow than VA and ICA flow. The findings respectively indicate: (1) disparate blood flow regulation to the brainstem and cortex; (2) cerebrovascular resistance is not solely modulated at the level of the arteriolar pial vessels; and (3) transcranial Doppler ultrasound may underestimate measurements of CBF during extreme hypoxia and/or hypercapnia.
Key points
The partial pressures of arterial carbon dioxide (
 ) and oxygen (
 ) has a marked influence on brain blood flow.
It is unclear if the larger brain arteries are also sensitive to changing
 and
and  and if different areas of the brain possess different sensitivities.
We separately altered
 and
and  and measured the diameter and blood flow in the main arteries delivering blood to the cortex and brainstem.
During alterations in
 and
and  , the large arteries changed diameter and blood flow to the brainstem changed more than that to the cortex.
These findings change the basis of our understanding of brain blood flow control in humans.
Introduction
Brain perfusion is highly sensitive to changes in the partial pressure of carbon dioxide in arterial blood ( ) and, to a lesser degree, the partial pressure of oxygen in arterial blood (
 ) (Kety & Schmidt, 1948). These high sensitivities, especially to
  , are unique to the cerebrovasculature when compared with the peripheral vasculature (Lennox & Gibbs, 1932; Ainslie et al. 2005). Elevations in
  (hypercapnia) cause a decrease in cerebrovascular resistance and consequent increases in cerebral blood flow (CBF), whereas hypocapnia causes increased cerebrovascular resistance and related decreased CBF (Kety & Schmidt, 1948; Wasserman & Patterson, 1961). This response of the brain's circulation to
  partly serves to stabilize respiratory and cardiovascular autonomic control, which are regulated by specific regions of the brainstem sensitive to the pH of surrounding tissue (Ainslie & Duffin, 2009; Xie et al. 2009). Thus, the increase in CBF with hypercapnia mitigates rising tissue CO2, and the decreased CBF with hypocapnia attenuates falling tissue CO2. Under normal physiological circumstances, hypoxia-induced increases in ventilation result in hypocapnia; changes in
  and
and  therefore influence both ventilation and CBF (Ainslie & Ogoh, 2010; Lucas et al. 2010b). Despite the importance of this reciprocal regulation at the level of the brainstem to central respiratory and autonomic control, most studies to date have measured the velocity response of the middle cerebral artery (MCAv), assuming blood gas reactivity is similar for different brain regions. But there has been limited study of regional differences in brain blood flow regulation with which to verify this assumption.
Jansen et al. (2002) reported greater increases in middle cerebral artery blood velocity (MCAv) than basilar artery blood velocities (BAv) during 7% O2 gas exposure; however, these data were collected under dynamic poikilocapnic conditions, precluding analysis of cerebrovascular CO2 and O2 sensitivities independently of each other. Conversely, with changes in  , previous studies have found a comparable cerebrovascular sensitivity between the MCAv and BAv (Ogawa et al. 1988; Hida et al. 1996). Hauge et al. (1980) also reported similar CO2 reactivity differences in velocity between the vertebral artery (VA) and internal carotid artery (ICA). However, all previous studies are limited by their measurement of blood velocity (rather than flow) and may consequently have underestimated changes and/or differences in CO2 sensitivities, and no study has assessed reactivity in the posterior cerebral artery (PCA). Recent data indicate that within 3 h of hypoxic exposure (12% O2), the MCA may dilate (Wilson et al. 2011). Moreover, MCA diameter may change by 4–18% during a ∼15 mmHg range in
  (Giller et al. 1993). It is unknown if these diameter changes are more pronounced through a broader
  range, but if so may lead to a marked error in estimations of flow. Sato & Sadamoto (2010) reported different regional blood flow changes through the ICA and VA during progressive exercise (and concomitant changes in
  ); interpretation with respect to sensitivities to blood gases per se is confounded by the myriad other changes manifest during exercise. Moreover, if neck arteries are directly sensitive to changes in arterial blood gases, estimation of cerebrovascular reactivity, and hence physiological interpretations, could be broadly inaccurate as well.
The current model of cerebrovascular function is a single-resistor model, with changes in cerebrovascular resistance occurring at the precapillary arterioles of the pia mater – the pial vessels (Forbes & Wolff, 1928; Wolff & Lennox, 1930; Harper & Glass, 1965; Kontos et al. 1978). There are several animal studies, however, demonstrating that the large cerebral arteries, and distal arteries of the neck (ICA and VA) contribute significantly to total changes in cerebrovascular resistance during alterations of blood pressure and arterial gases (Heistad et al. 1978; Faraci & Heistad, 1990), but to our knowledge, the relative sensitivities of ICA and VA to altered blood gases is not known, and moreover, this concept has never been intentionally explored in humans.
We investigated the regional CBF distribution through a wide range of steady state progressive changes in  and
and  near the limits of tolerance in conscious humans. Second, we aimed to determine if the large extra-cerebral arteries (ICA and VA) change diameter through the same range of arterial blood gases, indicating their potential role in cerebrovascular regulation. Based on the different ICA and VA flow responses reported by Sato & Sadamoto (2010) during exercise, we hypothesized that VA and ICA flow would exhibit disparate reactivity to changes in arterial blood gases. Based on highly controlled animal studies (Heistad et al. 1978; Faraci & Heistad, 1990), we further speculated that the ICA and VA would dilate in hypoxia, and hypercapnia, and constrict with hypocapnia.
Methods
Participants
Twenty-six adults volunteered for the study and gave written informed consent. Part A (carbon dioxide investigations) included 16 adults (5 female) with a mean age of 22 ± 3.2 years (mean ± SD), and body mass index of 23.8 ± 1.8 kg m−2. Eleven subjects were studied between 07.00 and 12.00 h, four subjects between 12.00 and 17.00 h; there were no statistical differences found for time of day, and data were therefore pooled. Part B (oxygen investigations) included 10 adults (5 female) with a mean age of 28 ± 4.5 years, and body mass index of 24 ± 2.2 kg m−2. Parts A and B were completed at different centres on a different group of participants. Participants were non-smokers, had no previous history of cardiovascular, cerebrovascular or respiratory diseases, and were not taking any medications other than contraception; females were studied during the follicular phase. The study was approved by the Clinical Research Ethics Board of the University of British Columbia (Study A) and the Institutional Review Board of Duke University Medical Center (Study B) and conformed to the standards set by the Declaration of Helsinki.
Experimental design
After familiarization with the experimental procedures outlined below, each participant was studied on one occasion. Before each experimental session, participants were required to abstain from exercise and alcohol for 24 h, caffeine for 12 h and a heavy meal for 4 h prior. After local anaesthesia (1% lidocaine), a 20-gauge catheter (Arrow, Markham, Ontario, Canada) was placed into the radial artery and attached to a pressure transducer (ADInstruments, Colorado Springs, CO, USA) positioned at the level of the right atrium in the midaxillary line for the measurement of beat-to-beat arterial blood pressure and arterial blood gases. Following cannulation, subjects rested quietly in the supine position, breathing room air, for ≥30 min to allow the setting up of monitoring equipment, which included calibration of the pressure transducer. An automated gas blender adjusted the composition and flow to a sequential gas delivery mask and breathing circuit according to the method described by Slessarev et al. (2007) (RespirAct; Thornhill Research, Toronto, Canada). This apparatus enables prospective control of the individual's end-tidal CO2 and O2 ( and
and  ), and minute ventilation independently of one another. At least during modest changes in
  (35–55 mmHg), the breathing circuit has been shown to operate such that the
  is equal to
  (Slessarev et al. 2007). Two protocols were conducted, described below.
Part A (carbon dioxide investigations)
Following a 15 min baseline at 40 mmHg  , either progressive hypocapnia or hypercapnia was randomly begun. In either case, sequential iso-oxic ∼15 min steps approximating 15 and 20 mmHg (hypocapnia), and 50, 55, 60 and 65 mmHg (hypercapnia) were conducted. Due to technical limitations, the maximal hyperventilation stage (
 ∼15 mmHg) was carried out without oxygen clamping. Each step was separated by a recovery period long enough to allow
  to return to baseline values – typically ∼15–30 min. Arterial blood gases were sampled at the end of each stage, the exact duration of which depended on subject tolerance, the time needed to stabilize at the desired
  level, and the time needed to make neck blood flow measurements; in most cases stages lasted 12–15 min.
Part B (oxygen investigations)
Following 15 min breathing room air, baseline measurements were made before  was sequentially decreased to 60, 44 and 35 mmHg
  for exactly 15 min each. Subjects then breathed room air again for 15 min, before
  was increased to ∼320 mmHg and ∼430 mmHg.
  was clamped at room air levels throughout all tests.
Measurements
Cerebral blood velocity
The left middle cerebral artery blood velocity (MCAv) and right posterior cerebral artery blood velocity (PCAv) were measured using a 2 MHz pulsed transcranial Doppler ultrasound (TCD) system (Spencer Technologies, Seattle, WA, USA). The left MCA was measured through the temporal window, at a depth 1 cm distal to the MCA–anterior cerebral artery bifurcation. The right P1 segment of the PCA was insonated from the right anterior temporal window. The probes were fixed and held in place using a specialized headband fixation device (M600 Bilateral Head frame, Spencer Technologies, Seattle, WA, USA). Standardized search techniques were used to optimize signal quality as detailed previously (Willie et al. 2011). Our test–retest reliability for baseline measures of MCAv and PCAv are approximately 3% and 2%, respectfully.
Extracranial ultrasound of blood flow in conduit vessels
Continuous diameter and blood flow recordings in the left internal carotid artery and right vertebral artery were obtained using a 10 MHz multifrequency linear array probe attached to a high-resolution ultrasound machine (Terason 3000, Teratech, Burlington, MA, USA). Imaging of the extracranial arteries commenced when end-tidal clamping was stable for at least 1 min. One sonographer on the left side of the participant conducted all left ICA measures, while another sonographer on the right side performed imaging of the right VA. The left ICA was measured at least 2 cm from the carotid bifurcation, whilst ensuring there was no evidence of turbulent or retrograde flow. The right VA was measured between the transverse process of C4 and the subclavian artery, but always at the same location within each subject. Average diameter and blood flow recordings were made from a minimum of 10 cardiac cycles (see below), and care was taken to ensure probe position was stable so that the angle of insonation did not vary from 60 deg. The sample volume was positioned in the centre of the vessel and adjusted to cover the width of the vessel diameter. Measurement settings for each extracranial artery within an individual were standardized for all gas stages. Test–retest reliability for baseline measures of ICA and VA flow are approximately 5% and 11%, respectfully.
All extracranial vascular images were directly stored as an AVI file for offline analysis. As described in depth elsewhere, analysis involved continuous measurements of arterial diameter synchronous with measurements of blood velocity at 30 Hz performed using an off-line custom-designed edge-detection and wall-tracking software (Black et al. 2008). Mean blood flow was determined as half the time averaged maximum velocity (Evans, 1985) multiplied by the cross-sectional lumen area. This method is used instead of the intensity weighted mean because the latter is more susceptible to noise and other distorting influences; the maximum follower is only affected by noise above the maximum frequency, noise that is visually obvious. Reproducibility of diameter measurements using this software is significantly better than manual methods as it reduces observer error significantly, and possesses an intra-observer coefficient of variation of 6.7% (Black et al. 2008).
Blood pressure and heart rate
Electrocardiogram, non-invasive beat-to-beat blood pressure by finger photoplethysmography (Finometer, Amsterdam, the Netherlands), intra-radial artery pressure, and  were sampled continuously at 1 kHz via an analogue to digital data acquisition system (Powerlab/16SP ML795; ADInstruments).
Arterial blood gases
Arterial blood gas samples from the radial artery were drawn into a preheparinised syringe, and analysed immediately. Following standardised calibration, all blood samples were analysed using an arterial blood-gas analysing system (ABL-80 Co-Ox, Radiometer, Copenhagen, Denmark) for pH,  ,
,  and
and  .
.
Calculations
Values for mean arterial pressure (MAP), MCAv, PCAv, heart rate (HR), and end-tidal gases were averaged over the last 3 min of each stage. Cerebrovascular conductance (CVC) indices were calculated by dividing MAP by the mean cerebral blood velocities (CBV; for MCAv and PCAv), or flow (for ICA and VA). Two forms of the hypoxic cerebrovascular reactivity were calculated for each individual as the slopes of the linear regressions between: (1) absolute CBF (CBV or flow) vs.
 ; and (2) the relative (percentage) change from baseline CBF vs.
 .
.  is conventionally used in place of
  to calculate hypoxic cerebrovascular reactivity because (1) the former gives an approximately linear (rather than exponential) relationship with CBF, and (2)
  is clinically meaningful and less invasively obtained than
  . Cerebrovascular CO2 reactivity was similarly calculated both in absolute and relative terms as the slopes of the linear regression between CBF vs.
 and %ΔCBF vs.
 , for the entire
  range. All R2 values were greater than 0.65. Cerebrovascular CO2 reactivity was also calculated separately for hypo- and hypercapnia. Arterial blood gas sampling was not possible in two subjects (one due to lack of catheter, one to technical issues with the gas analyser). In these individuals
  and
and  were estimated from their measured end-tidal gases using the group relationship between arterial and end-tidal gases that yielded the regression equations:
  = 0.882 (
 ) + 2.47 (R2= 0.98);
  = 0.806 (
 ) + 8.3 (R2= 0.724). The relationship between arterial and end-tidal CO2 is shown in Fig. 1.
Figure 1. Relationship between arterial ( ) and end-tidal (
 ) partial pressures of carbon dioxide during targeted steady state changes in
  .
.
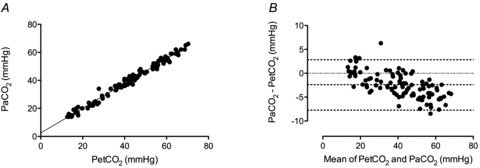
A, Regression equation:  = 0.882 (
 ) + 2.47 (R2 = 0.98). B, Bland–Altman plot of differences between
  and
and  , and the mean value of both. Dashed lines represents the 95% confidence intervals and the mean bias.
Arterial oxygen delivery was calculated as the product of the arterial content of oxygen ( ) and flow through the ICA and VA.
  was calculated as:
  (ml dl−1) =[haemoglobin] (g dl−1) × 1.36 (ml O2 (g haemoglobin)−1) ×
 (%)/100 + 0.003 (ml dl−1) ×
 (mmHg).
Statistical analysis
Normal distribution of variables was confirmed with the Shapiro–Wilk normality test. One-way ANOVA was used to compare differences across blood gas conditions, and where appropriate, post hoc comparisons to baseline blood gases were made using Dunnet's post hoc test. One-way repeated measures ANOVA was used to compare ICA diameter with  stage in the eight subjects who completed all stages between –20 mmHg and 55 mmHg
  . To make comparisons between ICA and VA, and between MCA and PCA, for a given blood gas stage, Student's t test was performed with appropriate Bonferroni correction for multiple comparison. Relationships between selected variables were determined using Pearson's correlations. There were no statistical differences in any variable between males and females, and these data were therefore pooled. Values are presented as means ± SD.
Results
Subjects
CO2 investigations
There were marked variation in tolerances to the extremes of both hypo- and hypercapnia. For example, with hypercapnia, the 50, 55, 60 and 65 mmHg steps were completed by 16, 15, 9 and 5 individuals, respectively. With hypocapnia, the 30, 20 and maximal hypocapnic (15 mmHg) steps were completed by 16, 15 and 11 individuals, respectively. Inadequate quality in ICA images was obtained in four subjects. Three of these subjects’ images lacked clearly demarcated vessel walls throughout the cardiac cycle, and in one subject large changes in the position of the vessel with respiration limited imaging of the vessel over more than a few concurrent cardiac cycles. Adequate images of the VA were not obtained in four subjects due in all cases to inadequate vessel wall sharpness; two of these subjects were amongst those excluded from ICA analysis. Those subjects with inadequate ICA and/or VA images were excluded only from ICA and/or VA analysis. Thus, group means for MAP, HR,  , MCAv and PCAv were all based on n= 16, whereas VA and ICA metrics were calculated on their respective n= 12. Data from the individuals who completed all stages showed the same blood flow and reactivity trends as that of the group means. Final sample sizes for each of the vessel measures at each stage are given in Table 1. In one subject a radial arterial catheter was not possible; blood pressure values from finger photoplethysmography were substituted in this subject only. Automated blood pressure measures were used to confirm these finger photoplethysmography values.
Table 1.
Cardiorespiratory and cerebrovascular variables during iso-oxic  alterations
| 15 mmHg | 20 mmHg | 30 mmHg | 40 mmHg (baseline) | 50 mmHg | 55 mmHg | 60 mmHg | 65 mmHg | |
|---|---|---|---|---|---|---|---|---|
 † † |
16.6 ± 1.7* | 20.0 ± 3.6* | 29.2 ± 4.2* | 39.2 ± 3.7 | 49.2 ± 3.7* | 53.7 ± 3.5* | 58.2 ± 4.7* | 62.2 ± 3.8* |
 |
109 ± 31 | 100 ± 25 | 92.6 ± 9 | 91.3 ± 17 | 95.9 ± 14 | 94.6 ± 14 | 93.2 ± 17 | 93.5 ± 21 |
| HR (beats min−1) | 89 ± 14* | 79 ± 11* | 68 ± 9 | 65 ± 1 | 72 ± 8.3 | 76 ± 11* | 79 ± 5.8* | 85 ± 6* |
| MAP (mmHg) | 81.1 ± 3.6 | 82.1 ± 5.2 | 82.5 ± 4.5 | 82.4 ± 3.6 | 86.5 ± 5.3 | 91.7 ± 7.4* | 93.9 ± 8.3* | 100 ± 5.2* |
 (ml min−1) (ml min−1) |
122 ± 30.0* | 121 ± 24.3* | 151 ± 25.0* | 222 ± 47.6 | 341 ± 75.2* | 418 ± 92.1* | 482 ± 109* | 489 ± 84.9* |
 (ml O2 min−1) (ml O2 min−1) |
26.3 ± 6.3* | 26.4 ± 5.4* | 32.4 ± 5.6 | 47.1 ± 11.0 | 72.5 ± 16.4* | 87.4 ± 23.1* | 102.7 ± 25.3* | 108.3 ± 19.9* |
| Diameter (mm) | 0.47 ± 0.05 | 0.48 ± 0.05 | 0.50 ± 0.07 | 0.52 ± 0.06 | 0.53 ± 0.07 | 0.55 ± 0.07 | 0.58 ± 0.06 | 0.59 ± 0.05 |
| Δ% diameter | −6.6 ± 2.9 | −6.0 ± 5.0 | −3.2 ± 5.3 | — | 2.6 ± 4.3 | 5.8 ± 6.1 | 10.0 ± 6.0 | 11.5 ± 4.8 |
| CVC (ml min−1 mmHg−1) | (1.5 ± 0.4) * | (1.5 ± 0.4) * | (1.8 ± 0.4) * | (2.6 ± 0.7) | (4.0 ± 1.2) * | (4.4 ± 1.0)* | (4.8 ± 1.3) * | (4.5 ± 1.3) * |
| Sample size | n= 7 | n= 11 | n= 12 | n= 12 | n= 12 | n= 10 | n= 7 | n= 3 |
 (ml min−1) (ml min−1) |
39.1 ± 25.4 | 39.9 ± 21.5 | 47.2 ± 22.7 | 71.4 ± 27.0 | 99.5 ± 35.3 | 118 ± 41.3* | 158 ± 58.9* | 187 ± 30.4* |
 (ml O2 min−1) (ml O2 min−1) |
8.4 ± 5.4 | 8.4 ± 4.1 | 8.7 ± 4.4 | 14.0 ± 5.4 | 19.6 ± 6.6 | 24.0 ± 8.3* | 32.0 ± 10.7* | 39.2 ± 3.2* |
| Diameter (mm) | 0.40 ± 0.07 | 0.39 ± 0.07 | 0.40 ± 0.07 | 0.41 ± 0.07 | 0.41 ± 0.05 | 0.42 ± 0.04 | 0.43 ± 0.01 | 0.43 ± 0.04 |
| Δ% diameter | −2.9 ± 9.7 | −6.1 ± 8.8 | 0.3 ± 8.9 | — | 2.4 ± 6.3 | 3.1 ± 7.4 | −0.5 ± 9.5 | 2.8 ± 6.7 |
| CVC (ml min−1 mmHg−1) | (0.47 ± 0.3) | (0.49 ± 0.2) | (0.56 ± 0.27) | (0.87 ± 0.33) | (1.2 ± 0.45) | (1.3 ± 0.45)* | (1.8 ± 0.81)* | (2.0 ± 0.30)* |
| Sample size | n= 4 | n= 6 | n= 11 | n= 12 | n= 11 | n= 9 | n= 3 | n= 2 |
| MCAv (cm s−1) | 37.9 ± 6.9* | 40.5 ± 6.8* | 46.6 ± 6.4* | 62.4 ± 10.1 | 88.0 ± 14.5* | 101 ± 14.3* | 111 ± 18.7* | 111 ± 19.6* |
| CVC (cm s−1 mmHg−1) | (0.47 ± 0.08)* | (0.50 ± 0.09)* | (0.56 ± 0.07)* | (0.76 ± 0.13) | (1.0 ± 0.18) * | (1.1 ± 0.18)* | (1.2 ± 0.20)* | (1.1 ± 0.16)* |
| Sample size | n= 11 | n= 15 | n= 16 | n= 16 | n= 16 | n= 15 | n= 9 | n= 5 |
| PCAv (cm s−1) | 28.8 ± 6.4* | 31.0 ± 7.1* | 34.9 ± 7.1* | 46.7 ± 11.5 | 67.4 ± 15.6* | 76.8 ± 12.4* | 84.3 ± 14.5* | 86.3 ± 16.8* |
| CVC (cm s−1 mmHg−1) | (0.36 ± 0.09)* | (0.38 ± 0.10)* | (0.42 ± 0.09)* | (0.57 ± 0.15) | (0.78 ± 0.19)* | (0.84 ± 0.14)* | (0.90 ± 0.17)* | (0.86 ± 0.14)* |
| Sample size | n= 10 | n= 14 | n= 16 | n= 16 | n= 16 | n= 15 | n= 9 | n= 5 |
†Values are arterial  and
and  , except for six blood gas values distributed amongst the subjects, and in two subjects in whom arterial blood sampling was not possible.
  and
and  values were estimated in these cases from the regression equations between
  ,
,  and
and  for all subjects; see Methods. Sample sizes vary between measured vessels due to inadequate image quality for VA and ICA measures, and loss of PCA signal in one subject during hypocapnia.
  and
and  , partial pressures arterial carbon dioxide and oxygen; HR, heart rate; MAP, mean arterial pressure;
  , internal carotid artery blood flow;
  , Oxygen delivery through vessel;
  , vertebral artery blood flow; MCAv, middle cerebral artery blood velocity; PCAv, posterior cerebral artery blood velocity; CVC, cerebrovascular conductance (flow or velocity/MAP); *P < 0.05 vs. 40 mmHg (baseline).
O2 investigations
Ten subjects began the protocol. One subject could not tolerate the mask at the 70% stage; her data were excluded from analysis. In another subject, post-analysis revealed technical problems with the blood pressure recording; therefore these data were also excluded from analysis. Of the n= 8 (age 28.6 ± 4.5) remaining, in one subject poor ICA images were attained; ICA analysis was therefore based on n= 7.
Cardiorespiratory data
CO2 investigations
There were no differences between the pre-hypocapnia and pre-hypercapnia baselines; thus full recovery was obtained between the progressive hypocapnic and hypercapnic steps. As expected,  was altered at each stage (P < 0.05; Table 1). Although MAP did not differ from baseline during hypocapnia, it was significantly increased during each stage of hypercapnia (Table 1). Heart rate was not different at 10 mmHg
  above or below baseline, but was elevated at every other stage.
O2 investigations (Tables 2 and 3)
Table 2.
Cardiorespiratory and cerebrovascular variables during isocapnic hypoxaemia
100%
|
90%
|
80%
|
70%
|
|
|---|---|---|---|---|
 (mmHg) (mmHg) |
106 ± 8.0 | 59 ± 4.0* | 43 ± 2.8* | 36 ± 4.3* |
 (%) (%) |
98.7 ± 0.39 | 92.4 ± 2.0* | 80.3 ± 2.0* | 70.1 ± 3.0* |
 (mmHg) (mmHg) |
40 ± 1.6 | 40 ± 2.4 | 41 ± 0.7 | 41 ± 1.7 |
| HR (beats min−1) | 65 ± 9 | 72 ± 11* | 82 ± 10* | 88 ± 10* |
| MAP (mmHg) | 89 ± 5 | 91 ± 6 | 93 ± 10 | 95 ± 12 |
 (ml min−1) (ml min−1) |
230 ± 67.5 | 222 ± 66.9 | 284 ± 62.8 | 322 ± 95.9* |
 (ml O2 min−1) (ml O2 min−1) |
48.7 ± 16.2 | 42.4 ± 12.5 | 50.8 ± 17.4 | 46.2 ± 14.4 |
| Diameter (mm) | 0.54 ± 0.09 | 0.54 ± 0.09 | 0.55 ± 0.07 | 0.49 ± 0.21 |
| Δ% diameter | — | −1.0 ± 8.1 | 1.4 ± 8.6 | 6.3 ± 8.1 |
| CVC (ml min−1 mmHg−1) | 2.7 ± 0.90 | 2.6 ± 0.86 | 3.3 ± 1.0 | 3.0 ± 1.8* |
 (ml min−1) (ml min−1) |
48.7 ± 16.5 | 52.6 ± 22.4 | 66.9 ± 30.8 | 92.4 ± 21.3* |
 (ml O2 min−1) (ml O2 min−1) |
9.4 ± 2.8 | 9.5 ± 4.2 | 10.4 ± 4.0 | 13.0 ± 2.3* |
| Diameter (mm) | 0.33 ± 0.05 | 0.33 ± 0.06 | 0.35 ± 0.06 | 0.36 ± 0.06* |
| Δ% diameter | — | 0.0 ± 4.8 | 5.3 ± 6.9 | 8.3 ± 9.2 |
| CVC (ml min−1 mmHg−1 | 0.55 ± 0.19 | 0.58 ± 0.24 | 0.75 ± 0.39 | 1.0 ± 0.31* |
| MCAv (cm s−1) | 59.9 ± 10.8 | 66.3 ± 14.1 | 76.2 ± 16.6* | 83.6 ± 18.4* |
| CVC (cm s−1 mmHg) | 0.67 ± 0.12 | 0.73 ± 0.16 | 0.82 ± 0.17* | 0.89 ± 0.18* |
| PCAv (cm s−1) | 38.0 ± 8.8 | 40.6 ± 10.8 | 46.2 ± 10.7* | 50.7 ± 12.0* |
| CVC (cm s−1 mmHg−1) | 0.43 ± 0.12 | 0.45 ± 0.14 | 0.51 ± 0.16* | 0.55 ± 0.18* |
 and
and  , partial pressures arterial carbon dioxide and oxygen; HR, heart rate; MAP, mean arterial pressure;
  , internal carotid artery blood flow;
  , Oxygen delivery through vessel;
  , vertebral artery blood flow; MCAv, middle cerebral artery blood velocity; PCAv, posterior cerebral artery blood velocity; CVC, cerebrovascular conductance (flow or velocity/MAP). *P < 0.05 vs. 100%
 (baseline).
Table 3.
Cardiorespiratory and cerebrovascular variables during isocapnic hyperoxia
| Baseline | 320 mmHg 
|
430 mmHg 
|
|
|---|---|---|---|
 (mmHg) (mmHg) |
104 ± 10.3 | 321 ± 7.8* | 434 ± 33.2* |
 (%) (%) |
98 ± 0.74 | 99.6 ± 0.25* | 99.6 ± 0.23* |
 (mmHg) (mmHg) |
40 ± 1.7 | 40 ± 2.6 | 41 ± 2.3 |
| HR (beats min−1) | 68 ± 10 | 66 ± 11 | 68 ± 11 |
| MAP (mmHg) | 91 ± 8 | 92 ± 8 | 92 ± 6 |
 (ml min−1) (ml min−1) |
242 ± 86.4 | 245 ± 110 | 243 ± 86.4 |
 (ml O2 min−1) (ml O2 min−1) |
51.9 ± 15.6 | 54.5 ± 21.9 | 51.0 ± 20.0 |
| Diameter (mm) | 0.56 ± 0.08 | 0.53 ± 0.08 | 0.51 ± 0.06 |
| CVC (ml min−1 mmHg−1) | 2.9 ± 0.86 | 2.9 ± 1.2 | 2.7 ± 1.1 |
 (ml min−1) (ml min−1) |
53.6 ± 15.4 | 52.1 ± 24.7 | 42.8 ± 12.3 |
 (ml O2 min−1) (ml O2 min−1) |
10.8 ± 2.7 | 10.5 ± 5.1 | 8.9 ± 2.7 |
| Diameter (mm) | 0.36 ± 0.06 | 0.33 ± 0.08 | 0.32 ± 0.07 |
| CVC (ml min−1 mmHg−1) | 0.61 ± 0.18 | 0.56 ± 0.26 | 0.47 ± 0.15 |
| MCAv (cm s−1) | 64.0 ± 12.8 | 60.4 ± 11.8* | 57.5 ± 10.7* |
| CVC (cm s−1 mmHg−1) | 0.70 ± 0.12 | 0.66 ± 0.11* | 0.62 ± 0.11* |
| PCAv (cm s−1) | 41.4 ± 11.1 | 39.6 ± 10.3 | 38.8 ± 9.8* |
| CVC (cm s−1 mmHg−1) | 0.44 ± 0.14 | 0.42 ± 0.13 | 0.41 ± 0.12* |
 and
and  , partial pressures arterial carbon dioxide and oxygen; HR, heart rate; MAP, mean arterial pressure;
  , internal carotid artery blood flow;
  , vertebral artery blood flow; MCAv, middle cerebral artery blood velocity; PCAv, posterior cerebral artery blood velocity; CVC, cerebrovascular conductance (flow or velocity/MAP). *Differences from baseline (P < 0.05).
There were no differences in any variable between pre-hypoxia and pre-hyperoxia trials. Full recovery was therefore achieved between the hypoxia and hyperoxia stages. Heart rate was elevated from baseline at each stage of hypoxia but was unaltered during hyperoxia. Mean arterial pressure did not change during any stage.
Cerebrovascular data: CO2 investigations
Changes in flow and velocity with  (Figs 2 and 3; Table 1)
Figure 2. Blood flow (top panels; ICA and VA) and blood velocity (bottom panels; MCA and PCA) during steady state changes in arterial CO2 (left panels) and oxygen (right panels).
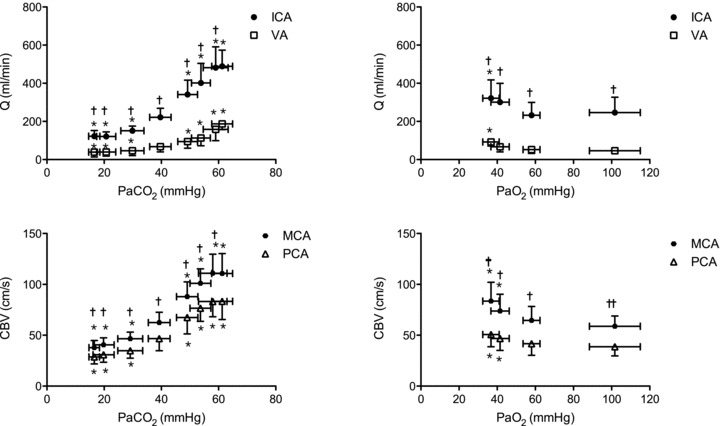
*Difference from baseline (40 mmHg  or 100
  ;), P < 0.05. †Differences between vessel flow (ICA vs. VA) or velocity (MCA vs. PCA) at a given stage;
  : P < 0.006;
  : P < 0.012. All values are means ± SD. ICA, internal carotid artery; VA, vertebral artery; MCA, middle cerebral artery; PCA, posterior cerebral artery. Note: the number of subjects comprising each mean value is different between stages and vessels. Please refer to Tables 1 and 2 for these values.
Figure 3. Percentage change from baseline in blood flow ( ; ICA and VA) and blood velocity (CBV; MCA and PCA) during steady state changes in arterial CO2 (top panels) and oxygen (bottom panels).
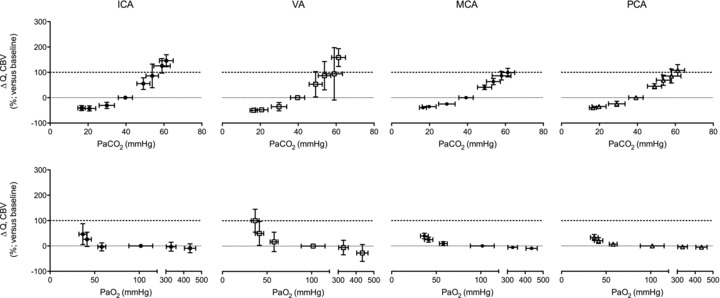
All values are mean ± SD. ICA, internal carotid artery; VA, vertebral artery; MCA, middle cerebral artery; PCA, posterior cerebral artery. The relative flow change in the neck arteries were ∼50% greater than velocity change in the intracranial vessels during hypercapnia, suggesting either anatomical flow redistribution or dilatation of the MCA and PCA – or both. Note the much greater increase in VA flow during hypoxia compared to the other vessels; see Fig. 4 for comparative CO2 and O2 reactivities. Note: the number of subjects comprising each mean value is different between stages and vessels. Please refer to Tables 1 and 2 for these values.
 , MCAv and PCAv, and their respective CVC values were significantly increased during all stages of hypercapnia, and decreased during all stages of hypocapnia.
  and VA CVC were increased during hypercapnia; however, the decrease during hypocapnia did not reach statistical significance (Table 1). With the extreme level of hypercapnia (65 mmHg) the relative increases in CBF from baseline were:
  : 146 ± 23.7%;
  : 158 ± 35%; MCAv: 99.1 ± 16.8%; and PCAv: 108 ± 22.7%. Conversely, at the extreme level hypocapnia CBF decreases were:
  : −41.0 ± 9.8%;
  : −49.8 ± 8.2%; MCAv: −39.1 ± 6.9%; PCAv: −39.5 ± 7.3%. Oxygen delivery through the ICA was decreased at 15 and 20 mmHg
  , and increased at 50 mmHg
  and above. Posterior cerebral (VA) oxygen delivery was increased above 50 mmHg
  ; there was a trend for reduced VA oxygen delivery during hypocapnia (Table 1).
Comparisons between vessels (Fig. 3)
Absolute flow/velocity values for each vessel for a given stage were different from each other (P < 0.006). Overall cerebrovascular reactivity to CO2 based on percentage changes in CBF from baseline was ∼25% greater (P < 0.05) for the neck arteries (ICA: 4.0 ± 0.38% mmHg−1; VA 4.4 ± 2.1% mmHg−1 versus that of the cerebral arteries (MCA: 2.9 ± 0.47% mmHg−1; PCA: 3.0 ± 0.62% mmHg−1). However, overall reactivity did not differ between ICA and VA, or between MCA and PCA. Reactivity in the hypercapnic range did not differ between vessels, whereas in the hypocapnic range VA reactivity was greater than the other vessels (Fig. 4). For comparison, Fig. 4 (bottom panel) also depicts CO2 reactivity when calculated on absolute CBF values.
Figure 4. Mean (SD) cerebral blood flow responses to CO2 and hypoxaemia.
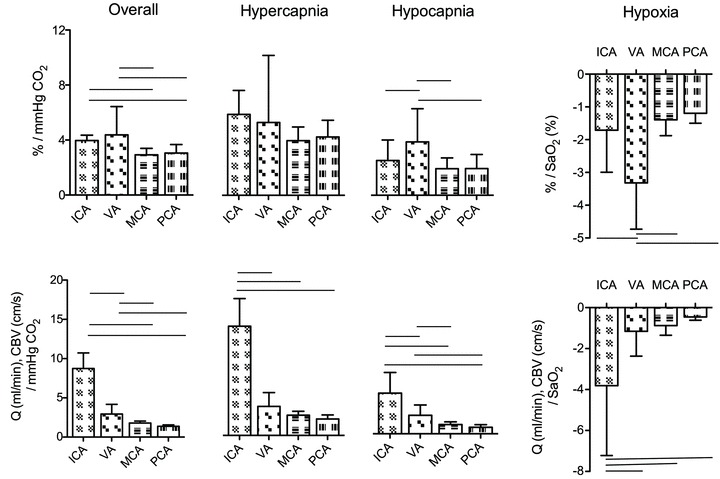
The top row depicts the slope of the normalized CBF change (A%, relative to baseline) and  or
or  ; the bottom row depicts absolute flow (
 ; ICA and VA) or blood velocity (CBV; MCA and PCA) and
  or
or  . Horizontal bars indicate significant relationships, P < 0.05.
Relationships with  (Figs 5 and 6)
Figure 5. Mean (squares; ±SD) and individual (circles) percentage change in luminal diameters of the internal carotid artery during steady state change in  .
.
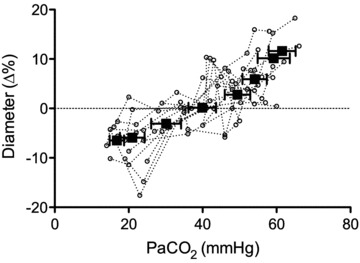
Linear regression of individual data y = 3.6 × 10⁻¹ ( ) – 13.3; R2 = 0.63. Through a large
  range, internal carotid diameter changes by ∼20%, indicating that cerebrovascular resistance is not solely modulated at cerebral arterioles with changes in the partial pressure of arterial blood gases.
Figure 6. Percent change from baseline in MAP(A) and relationship between ΔMAP and ΔCBF or ΔCBV (B) during hypercapia and hypoxia.
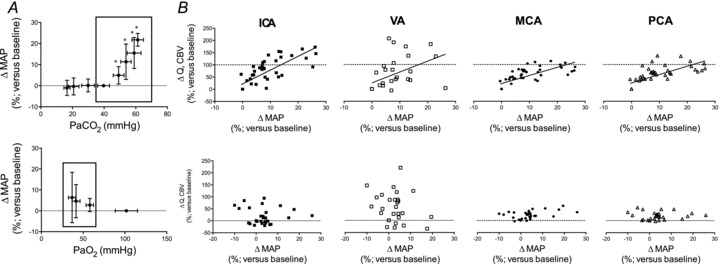
A, percentage change in (ΔMAP) relative to baseline for  (top row) and hypoxaemia (bottom row) trials. Right hand eight plots (B) depict ΔMAP in the hypercapnic or hypoxic ranges (shown boxed in A). ICA, internal carotid artery; VA, vertebral artery; MCA, middle cerebral artery; PCA, posterior cerebral artery. The hypercapnia related hypertension was positively related (P < 0.05) to elevations in CBF/CBV in all vessels; in contrast, hypoxia induced increases in MAP were not related to CBF/CBV.
Changes in  were reflected in significant changes in the diameter of the ICA (individual regression mean R2, 0.63 ± 0.26; Fig. 5). In the eight subjects who completed all
  stages from 20 mmHg to 55 mmHg, repeated measured ANOVA revealed that a >10 mmHg change in
  produced a significant change in ICA diameter, in both the hyper- and hypocapnic ranges. There was no significant change in VA diameter. The hypercapnic-induced elevations in MAP were positively (P < 0.05) related to elevations in CBF or CBV in all arteries (R2 0.8–0.91; Fig. 6).
Cerebrovascular data: O2 investigations
Changes in flow and velocity with  (Figs 2 and 3)
 and
and  (and related CVC) were increased at 36 mmHg
  (
( ∼70%) only. In contrast, MCAv and PCAv (and related CVC) were increased at both 44 mmHg (
 ∼80%) and 36 mmHg
  (
( ∼70%) stages. Both stages of hyperoxia decreased velocities and CVC of the MCA and PCA relative to baseline, but had no significant effect on the arteries of the neck (Table 3). Anterior cerebral (ICA) oxygen delivery was unchanged in hypoxia, whereas VA oxygen delivery was increased at 70%
 (Table 2). Hyperoxia elicited no change in oxygen delivery in either vessel.
Comparisons between vessels (Figs 2–4)
Absolute values for each vessel at each  stage were different from each other (P < 0.006). Cerebrovascular reactivity, expressed as the relative percentage change in CBF with
  , was ∼50% greater in the VA (–3.3 ± 1.4) relative to the other arteries. Reactivities in these arteries were not different from one another (ICA: –1.71 ± 1.3; MCA –1.39 ± 0.5; PCA –1.19 ± 0.3). However, when expressed as the absolute value of flow (ICA and VA), or velocity (MCA and PCA), reactivity in the ICA was the highest; absolute reactivity was not different between the other three vessels.
Relationships with O2
The diameter of the VA increased at ∼36 mmHg  (
( ∼70%) whereas ICA diameter was unaffected by altered
  . In contrast to the
  relationships, there was no relationship between the (non-significant) increase in MAP and CBF or CBV in any vessel (Fig. 6).
Proximal vs. distal measures of CBF
Figure 7 shows Bland–Altman plots of the difference in percentage change in CBF between VA and PCA, and ICA and MCA, plotted against their respective means. TCD provides an accurate estimate of CBF at lower CBF velocities but likely underestimates flow at the high CBF values during hypoxia or hypercapnia.
Figure 7. Bland–Altman plots of differences between neck artery blood flows and the respective downstream intracranial vessel, and the mean value of both.
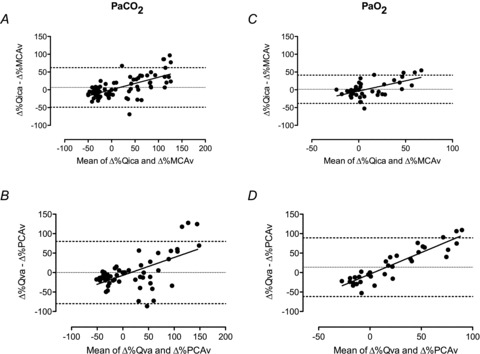
Values are percentage change from baseline. Dashed line represents the 95% confidence intervals, dotted line the mean bias. All plots show systematic error proportional to the increase in CBF; A and B suggest systematic and random error. Data show that at lower CBF values TCD estimates of intracranial blood velocity accurately reflect CBF for both the vertebral–PCA systems and ICA–MCA systems. With high CBF with hypoxia or hypercapnia MCAv and PCAv are likely to underestimate CBF.
Discussion
This is the first study to examine regional cerebrovascular response differences over the tolerable extremes of acute arterial blood gas changes in humans. The novel findings of this study were: (1) VA reactivity to isocapnic hypoxia, and hypocapnia was greater than the other arteries (i.e. ICA, MCA and PCA); (2) overall cerebrovascular reactivity to  was greater in the neck arteries than the cerebral arteries (i.e. ICA and VA vs. MCA and PCA); (3) VA diameter increased during extreme hypoxaemia, whereas ICA diameter was sensitive to changes in
  , indicating proximal resistance to the cerebral circulation is not constant during changes in blood gases; and (4) at high blood flows due to both isocapnic hypoxia and iso-oxic hypercapnia, TCD underestimates changes in global CBF. Collectively these findings indicate disparate blood gas sensitivity to the brainstem and cortex, challenge the dogma that cerebrovascular resistance is solely modulated at the level of the arteriolar pial vessels, and highlight limitations in the use of TCD for the measurement of CBF during extreme hypoxia and/or hypercapnia.
Cerebrovascular reactivity to  and
and 
The cerebrovasculature is exquisitely sensitive to  and, to a lesser extent,
  . This sensitivity serves to buffer brain tissue pH, thereby stabilizing chemosensory and autonomic control. We examined the slope of the CBF–
 /
/ relationships, as well as the separate CBF reactivities to hypocapnia and hypercapnia. The neck arteries displayed greater overall CO2 reactivity than the intracranial vessels, and the VA displayed higher reactivity to hypoxia than both the ICA and intracranial vessels. The explanation for differences in reactivity between the neck vessels and their downstream arteries is likely to have either an anatomical or a technical basis – or both.
Anatomical
In addition to the MCA, the ICA also supplies the anterior cerebral artery. Thus the assumption of unity between ICA and MCA flow/velocity is contingent on a constant distributive relationship between the middle and anterior cerebral arteries. Similarly, the VAs feed a number of other vessels in addition to the PCA, which in regards to the vertebrobasilar system, has a higher degree of complexity. There are numerous anastomoses with the VA both extra- and intracranially. The VA communicates with branches of the deep cervical artery, and inferior thyroid artery extracranially, and upon entering the skull gives off multiple branches to the cerebellum, medulla and pons before joining to form the basilar artery (Edvinsson & Krause, 2002). A number of arteries project from the basilar artery to supply the cerebellum and pons before it ramifies to form the posterior circle of Willis and posterial cerebral arteries (Willie et al. 2011). Thus, particularly in the case of the posterior vessels, the different reactivities in the neck vs. intracranial vessels could be a result of disparate changes in downstream resistance of regions not supplied by the MCA or PCA. In other words, for a given change in  or
or  , blood may be diverted away from the MCA or PCA through intracranial vessels not directly measured in the current study.
There are no data, however, to suggest that this is the case, and given the similar differences in ICA/MCA and VA/PCA reactivities, we feel the following technical argument is more likely.
Technical
Diameter changes of the MCA and PCA themselves provide the second explanation for the difference in reactivity between neck and intracranial vessels. That the overall  or
or  reactivity of the neck vessels was greater than the intracranial vessels could be evidence of vasodilatation at the site of insonation. Hypercapnic (or hypoxic)-induced dilatation would reduce blood velocity resulting in an underestimation of flow (see Flow versus velocity with TCD).
We observed that in the hypercapnic range all vessels exhibit similar cerebrovascular reactivity, yet in the hypocapnic range the VA had greater CO2 reactivity than the ICA, MCA and PCA, which were not different from one another. No previous study has reported reactivities for the ICA, VA or PCA but our MCA values are consistent with that previously reported (reviewed in: Ainslie & Duffin, 2009). Our values of  reactivity for MCA and PCA were similar to that reported for the basilar artery (Hida et al. 1996). As highlighted in the current study, it is known that steady-state cerebrovascular reactivity is more sensitive to increases in
  (i.e. hypercapnic reactivity) than decreases (i.e. hypocapnic reactivity) (Ide et al. 2003; Xie et al. 2005; Peebles et al. 2007). The mechanisms underlying this greater reactivity to hypercapnia compared with hypocapnia may be related to a greater influence of vasodilator mediators on intracranial vascular tone compared with vasoconstrictive mediators (Toda & Okamura, 1998). It is also likely that increased MAP in the hypercapnic range influences reactivity, though there was no obvious relationship between MAP and CBF with hypoxia.
Brainstem blood flow regulation
Relative to all other vessels, the VA exhibited greater reactivity to hypoxia and to CO2 in the hypocapnic range. Because of the complexity and distribution of the vertebrobasilar system, these results are difficult to interpret. There are also no values, to our knowledge, in the literature of VA reactivity to either CO2 or hypoxia to compare our findings. Nevertheless, the greater reactivity of the VA, particularly to severe hypoxaemia and hypocapnia, is interesting in light of it being the principal blood conduit to the brainstem, and highlights the importance of regional blood flow distribution in the study of chemoreflex and autonomic control.
A proximal resistor for the human cerebral circulation?
We observed a 27% change in ICA diameter through a wide  range at the limits of our subjects’ tolerance, and a 9% change in VA diameter with extreme hypoxaemia; to our knowledge this has not been previously reported in the literature. These data indicate that the large changes in CBF manifest through broad
  and
and  ranges may be partially affected by diameter modulation of the neck arteries themselves. That the regulation of brain blood flow is mediated by the pial arterioles has remained dogma for more than 70 years (Fog, 1934; Fog, 1938) despite evidence from animals suggesting that, unlike other vascular beds, the large arteries of the brain contribute significantly to total (cerebral) resistance. Indeed, this was proposed by Mchedlishvili 60 years ago, but his ideas did not reach western scientific literature until much later (Mchedlishvili et al. 1973; Mchedlishvili, 1980). There are a number of studies demonstrating that the large cerebral vessels of cats and dogs contribute up to 30–45% of total cerebrovascular resistance (Heistad et al. 1978; Gross et al. 1980; Faraci & Heistad, 1990). The present data indicate that both the proximal cerebral arteries and distal cerebral arterioles dilate with hypercapnia and constrict with hypocapnia. Consistent with the results of the above animal studies, it is therefore likely that the entire cerebral arterial tree is sensitive to altered blood gases. Because the relative change in proximal and distal cerebral artery resistance ultimately determines cerebral microvasculature pressure, calculating the resistance changes based on the observed changes in diameter is not a meaningful quantification. But with union between small and large vessel vasomotion, microvascular pressure would be kept relatively constant despite large changes in flow. The ability of large cerebral arteries to act as ‘protective’ resistors (as opposed to static tubes) seems teleologically important. We acknowledge that it is possible that the increase in ICA diameter may not be due to the direct influence of
  or hypoxia, but is rather a secondary endothelial-mediated response to changes in shear stress concomitant to flow changes, or passively during hypercapnia with increased MAP. At least at the level of brain arterioles in rats, however, vasodilatation with hypercapnia appears to be mediated through non-endothelial mechanisms (Wang et al. 1994), and we observed a significant decrease in ICA diameter during hypocapnia, when MAP did not change.
Our study was not designed to clarify the mechanism(s) or the specific site of  reactivity. Such a study will be difficult to design in vivo, however, given that subjecting only the arteries of the neck to changes in CO2 but not their downstream associations is of obvious difficulty in humans. Regardless of the mechanism, however, our data clearly indicate that with severe changes in arterial blood gases the large vessels of the neck are not mere conduit vessels, and rather act as active resistance vessels. We speculate that these findings are not simply evidence that the proximal vessels are vasoactive, but rather that the entire arterial structure of the cerebrovasculature is responsive to changes in arterial blood gases. This finding requires validation with higher resolution imaging modalities through a normal range of physiological changes, but if true, represents a new paradigm in our understanding of human CBF regulation.
Methodological considerations
Assessment of reactivity: absolute versus relative comparisons
Our findings exemplify the marked differences in  and
and  reactivity between vessels if absolute flow/velocity values are compared directly (Figs 2 and 3). Because different vessels have inherently different baseline flow through them, the use of absolute values for reactivity calculation yields values that are largely dependent on the baseline flow. Because there is no analytical interpretational standard for comparison of vessel reactivities, we recommend both absolute and relative reactivities be shown.
Pressure–flow relationships across the cerebrovasculature
The brain is able to modulate its flow to some degree in the face of changes in arterial pressure (Ainslie & Tzeng, 2010), an ability conventionally termed cerebral autoregulation. However, it is likely that hypercapnia and hypoxia both impair cerebral autoregulation (Aaslid et al. 1989; Zhang et al. 1998; Subudhi et al. 2009). Figure 6 highlights this phenomenon, where CBF increases concomitantly with MAP during hypercapnia. Such findings are broadly consistent with a well-controlled experiment by Przybyowski and co-workers (2003) who reported that apnoea-induced elevations in MCAv were attenuated by ganglionic blockade that blunted increases in MAP. However, in this study, we cannot distinguish between the effects of  or elevations in MAP per se because they occur concurrently, hypertension being caused by the chemoreflex response to hypercapnia. Although the MAP increase during hypoxia is much lower than with hypercapnia, it is interesting to note the lack of obvious MAP–CBF relationship during hypoxia.
Flow versus velocity with TCD
During both hypercapnia and hypoxia, our findings clearly show a greater increase in flow in the ICA and VA flow compared with velocity changes in the MCA and PCA, respectively. Bland–Altman plots (Fig. 7) reveal a systematic underestimation of flow via TCD proportional to the higher ranges of CBF during hypercapnia and hypoxia. As we observed greater CO2 reactivity in the ICA, and others have shown high CO2 reactivity in the M2 segment of the MCA (Giller et al. 1993), we feel it is likely the diameter of the MCA changes with  . There are two salient points: there is now ample support in the literature to preclude the assumption of constant cerebral vessel diameter at extremes of blood gas changes (Giller et al. 1993; Wilson et al. 2011), and these cerebral vessel characteristics need to be directly characterized with the most sophisticated imaging modalities available.
End-tidal vs. arterial  and
and 
A strength of our study is that we targeted desired  and
and  and confirmed
  and
and  by arterial blood samples. Breathing via a sequential gas delivery circuit (Slessarev et al. 2007) reduces the CO2 and O2 alveolar–arterial difference in the lung (Ito et al. 2008), but this has not been assessed at the extreme values presented in this study. This validation is important, especially during curve fitting, since
  is known to underestimate
  at rest (Robbins et al. 1990) and overestimate
  during breathing of hypercapnic air in both animals (Tojima et al. 1988) and humans (Peebles et al. 2007). Our data indicate that
  overestimates
  through the entire hypercapnic range (Fig. 1). Thus, arterial blood gas collection is necessary for the true representation and physiological interpretation of cerebrovascular reactivity to O2 and CO2, at the extremes of physiological tolerance to hypoxia, alkalosis and acidosis presented here.
Assessment of blood flow
Although a number of previous studies have measured blood flow in the ICA and VA at rest and during exercise (Sato & Sadamoto, 2010; Sato et al. 2011), this is the first report to integrate novel edge detection and wall tracking software (Black et al. 2008). This software allows operator-independent simultaneous assessment of conduit artery diameter changes and velocity, and thus quantitative assessment of blood flow through the arteries of interest at high resolution (30 Hz). We were, however, limited to near-concurrent insonation of the right ICA and left VA, and cannot therefore account for side-to-side differences in flow between the arteries. Indeed, Schoning (1994) showed no difference between the right and left ICA, whereas the right VA (the vessel measured in the present study) was found to have a ∼20% lower flow than the left VA. Regardless of potential differences in flows, we are unaware if any data suggesting there are bilateral differences in reactivity between the internal carotid arteries or vertebral arteries. Thus, we feel that our technological limitation of only being able to measure one ICA and one VA is unlikely to detract from our main study conclusions.
Curve fitting
As used extensively elsewhere for steady-state changes in  (Ainslie & Duffin, 2009) and
  (Jensen et al. 1996), we used linear regression to determine the relationship with CBF/CBV (R2 mean: 0.86 ± 0.07). In the case of
  , this approach allows both the determination of the full reactivity to
  and for hypercapnia and hypocapnia separately. Because the cellular mechanisms are likely to differ between the hypercapnia vs. hypocapnia ranges (reviewed in Ainslie & Duffin, 2009), consideration of them separately is important, especially when changes in both ranges are not comparable in many aspects of pathophysiology (Xie et al. 2005), physiology (e.g. with exercise (Ogoh et al. 2009), and high altitude (Lucas et al. 2010b)). However, our capacity for more complex curve fitting was consequently limited. Although technically challenging because of the prolonged vessel imaging necessitated, future studies are now needed to compare volumetric flow measures in the ICA and VA during Duffin-type rebreathing (Battisti-Charbonney et al. 2011).
In summary, we have characterized regional cerebrovascular responses through the widest range of  and
and  reported in the literature to date. This is the first study in humans to implicate the large cerebral vessels of the neck in blood gas related modulation of CBF, and moreover identify regional differences in neck artery blood-gas reactivity. That the VA demonstrated greater sensitivity to hypoxia and to CO2 in the hypocapnic range has significant implications for our understanding of brainstem control of respiratory and autonomic function. These data need to be considered in future studies of cerebrovascular function, as the long-held paradigm that blood flow regulation is modulated solely at the pial arterioles is likely to be an inadequately simplistic regulatory model.
Acknowledgments
This work was supported in part by a NSERC Discovery grant to P.N.A. P.N.A. is supported by a Canada Research Chair in Cerebrovascular Physiology. C.K.W. is a Vanier Canada graduate scholar and Killam Doctoral Fellow. We are grateful to Professor D. J. Green for providing the software and support for arterial wall-tracking analysis.
Glossary
- BAv
basilar artery blood velocities
- CBF
cerebral blood flow
- CBV
cerebral blood velocity
- CVC
cerebrovascular conductance
- HR
heart rate
- ICA
internal carotid artery
- MAP
mean arterial pressure
- MCA
middle cerebral artery
- MCAv
middle cerebral artery blood velocity
- PCA
posterior cerebral artery
- PCAv
posterior cerebral artery blood velocity
- TCD
transcranial Doppler ultrasound
- VA
vertebral artery
Author contributions
Part A of the study was completed at the University of British Columbia Okanagan, Part B at Duke University Medical Center. C.K.W. and P.N.A. were involved in the conception and design of the study, data collection, analysis and interpretation, and drafted and revised the manuscript. D.B.M., A.D.S., K.J.S., K.I., J.G., and N.C.L. were involved in data collection and interpretation, and revision of the manuscript. Y.C.T., N.D.E. and T.A.D. contributed to the intellectual content of the manuscript. All authors have approved the final version for publication.
References
- Aaslid R, Lindegaard KF, Sorteberg W, Nornes H. Cerebral autoregulation dynamics in humans. Stroke. 1989;20:45–52. doi: 10.1161/01.str.20.1.45. [DOI] [PubMed] [Google Scholar]
- Ainslie PN, Tzeng YC. On the regulation of the blood supply to the brain: old age concepts and new age ideas. J Appl Physiol. 2010;108:1447–1449. doi: 10.1152/japplphysiol.00257.2010. [DOI] [PubMed] [Google Scholar]
- Ainslie P, Duffin J. Integration of cerebrovascular CO2 reactivity and chemoreflex control of breathing: mechanisms of regulation, measurement, and interpretation. Am J Physiol Regul Integr Comp Physiol. 2009;296:R1473–R1495. doi: 10.1152/ajpregu.91008.2008. [DOI] [PubMed] [Google Scholar]
- Ainslie PN, Ogoh S. Regulation of cerebral blood flow in mammals during chronic hypoxia: a matter of balance. Exp Physiol. 2010;95:251–262. doi: 10.1113/expphysiol.2008.045575. [DOI] [PubMed] [Google Scholar]
- Ainslie PN, Ashmead JC, Ide K, Morgan BJ, Poulin MJ. Differential responses to CO2 and sympathetic stimulation in the cerebral and femoral circulations in humans. J Physiol. 2005;566:613–624. doi: 10.1113/jphysiol.2005.087320. [DOI] [PMC free article] [PubMed] [Google Scholar]
- Battisti-Charbonney A, Fisher J, Duffin J. The cerebrovascular response to carbon dioxide in humans. J Physiol. 2011;589:3039–3048. doi: 10.1113/jphysiol.2011.206052. [DOI] [PMC free article] [PubMed] [Google Scholar]
- Black MA, Cable NT, Thijssen DH, Green DJ. Importance of measuring the time course of flow-mediated dilatation in humans. Hypertension. 2008;51:203–210. doi: 10.1161/HYPERTENSIONAHA.107.101014. [DOI] [PubMed] [Google Scholar]
- Edvinsson L, Krause DN. Cerebral Blood Flow and Metabolism. Philadelphia: Lippincott, Williams & Wilkins; 2002. [Google Scholar]
- Evans DH. On the measurement of the mean velocity of blood flow over the cardiac cycle using Doppler ultrasound. Ultrasound Med Biol. 1985;11:735–741. doi: 10.1016/0301-5629(85)90107-3. [DOI] [PubMed] [Google Scholar]
- Faraci FM, Heistad DD. Regulation of large cerebral arteries and cerebral microvascular pressure. Circ Res. 1990;66:8–17. doi: 10.1161/01.res.66.1.8. [DOI] [PubMed] [Google Scholar]
- Fog M. Om Piarrteriernes vasomotoriske Reaktioner. Copenhagen: Danish Dissertation; 1934. [Google Scholar]
- Fog M. The relationship between the blood pressure and the tonic regulation of the pial arteries. J Neurol Psychiatry. 1938;1:187–197. doi: 10.1136/jnnp.1.3.187. [DOI] [PMC free article] [PubMed] [Google Scholar]
- Forbes HS, Wolff HG. Cerebral circulation. III. The vasomotor control of cerebral vessels. Arch Neuro Psychiat. 1928;19:1057–1086. [Google Scholar]
- Giller CA, Bowman G, Dyer H, Mootz L, Krippner W. Cerebral arterial diameters during changes in blood pressure and carbon dioxide during craniotomy. Neurosurgery. 1993;32:737–741. discussion 741–742. [PubMed] [Google Scholar]
- Gross PM, Marcus ML, Heistad DD. Regional distribution of cerebral blood flow during exercise in dogs. J Appl Physiol. 1980;48:213–217. doi: 10.1152/jappl.1980.48.2.213. [DOI] [PubMed] [Google Scholar]
- Harper AM, Glass HI. Effect of alterations in the arterial carbon dioxide tension on the blood flow through the cerebral cortex at normal and low arterial blood pressures. J Neurol Neurosurg Psychiatr. 1965;28:449–452. doi: 10.1136/jnnp.28.5.449. [DOI] [PMC free article] [PubMed] [Google Scholar]
- Hauge A, Thoresen M, Walloe L. Changes in cerebral blood flow during hyperventilation and CO2-breathing measured transcutaneously in humans by a bidirectional, pulsed, ultrasound Doppler blood velocitymeter. Acta Physiol Scand. 1980;110:167–173. doi: 10.1111/j.1748-1716.1980.tb06647.x. [DOI] [PubMed] [Google Scholar]
- Heistad DD, Marcus ML, Abboud FM. Role of large arteries in regulation of cerebral blood flow in dogs. J Clin Invest. 1978;62:761–768. doi: 10.1172/JCI109187. [DOI] [PMC free article] [PubMed] [Google Scholar]
- Hida W, Kikuchi Y, Okabe S, Miki H, Kurosawa H, Shirato K. CO2 response for the brain stem artery blood flow velocity in man. Respir Physiol. 1996;104:71–75. doi: 10.1016/0034-5687(96)00011-4. [DOI] [PubMed] [Google Scholar]
- Ide K, Eliasziw M, Poulin MJ. Relationship between middle cerebral artery blood velocity and end-tidal PCO2 in the hypocapnic-hypercapnic range in humans. J Appl Physiol. 2003;95:129–137. doi: 10.1152/japplphysiol.01186.2002. [DOI] [PubMed] [Google Scholar]
- Ito S, Mardimae A, Han J, Duffin J, Wells G, Fedorko L, Minkovich L, Katznelson R, Meineri M, Arenovich T, Kessler C, Fisher JA. Non-invasive prospective targeting of arterial PCO2 in subjects at rest. J Physiol. 2008;586:3675–3682. doi: 10.1113/jphysiol.2008.154716. [DOI] [PMC free article] [PubMed] [Google Scholar]
- Jansen GFA, Kagenaar DA, Basnyat B, Odoom JA. Basilar artery blood flow velocity and the ventilatory response to acute hypoxia in mountaineers. Resp Physiol Neurobiol. 2002;133:65–74. doi: 10.1016/s1569-9048(02)00152-0. [DOI] [PubMed] [Google Scholar]
- Jensen JB, Sperling B, Severinghaus JW, Lassen NA. Augmented hypoxic cerebral vasodilation in men during 5 days at 3,810 m altitude. J Appl Physiol. 1996;80:1214–1218. doi: 10.1152/jappl.1996.80.4.1214. [DOI] [PubMed] [Google Scholar]
- Kety SS, Schmidt CF. The effects of altered arterial tensions of carbon dioxide and oxygen on cerebral blood flow and cerebral oxygen consumption of normal young men. J Clin Invest. 1948;27:484–492. doi: 10.1172/JCI101995. [DOI] [PMC free article] [PubMed] [Google Scholar]
- Kontos HA, Wei EP, Navari RM, Levasseur JE, Rosenblum WI, Patterson JL. Responses of cerebral arteries and arterioles to acute hypotension and hypertension. Am J Physiol Heart Circ Physiol. 1978;234:H371–383. doi: 10.1152/ajpheart.1978.234.4.H371. [DOI] [PubMed] [Google Scholar]
- Lennox WG, Gibbs EL. The blood flow in the brain and the leg of man, and the changes induced by alteration of blood gases. J Clin Invest. 1932;11:1155–1177. doi: 10.1172/JCI100470. [DOI] [PMC free article] [PubMed] [Google Scholar]
- Lucas SJ, Burgess KR, Thomas KN, Donnelly J, Peebles KC, Lucas RA, Fan JL, Basnyat R, Cotter JD, Ainslie PN. Alterations in cerebral blood flow and cerebrovascular reactivity during 14 days at 5050 m. J Physiol. 2010;589:741–753. doi: 10.1113/jphysiol.2010.192534. [DOI] [PMC free article] [PubMed] [Google Scholar]
- Mchedlishvili G. Physiological mechanisms controlling cerebral blood flow. Stroke. 1980;11:240–248. doi: 10.1161/01.str.11.3.240. [DOI] [PubMed] [Google Scholar]
- Mchedlishvili GI, Mitagvaria NP, Ormotzadze LG. Vascular mechanisms controlling a constant blood supply to the brain. Stroke. 1973;4:742–750. doi: 10.1161/01.str.4.5.742. [DOI] [PubMed] [Google Scholar]
- Ogawa S, Handa N, Matsumoto M, Etani H, Yoneda S, Kimura K, Kamada T. Carbondioxide reactivity of the blood flow in human basilar artery estimated by the transcranial Doppler method in normal men: a comparison with that of the middle cerebral artery. Ultrasound Med Biol. 1988;14:479–483. doi: 10.1016/0301-5629(88)90108-1. [DOI] [PubMed] [Google Scholar]
- Ogoh S, Ainslie PN, Miyamoto T. Onset responses of ventilation and cerebral blood flow to hypercapnia in humans: rest and exercise. J Appl Physiol. 2009;106:880–886. doi: 10.1152/japplphysiol.91292.2008. [DOI] [PMC free article] [PubMed] [Google Scholar]
- Peebles K, Celi L, McGrattan K, Murrell C, Thomas K, Ainslie PN. Human cerebrovascular and ventilatory CO2 reactivity to end-tidal, arterial and internal jugular vein PCO2. J Physiol. 2007;584:347–357. doi: 10.1113/jphysiol.2007.137075. [DOI] [PMC free article] [PubMed] [Google Scholar]
- Przybyowski T, Bangash MF, Reichmuth K, Morgan BJ, Skatrud JB, Dempsey JA. Mechanisms of the cerebrovascular response to apnoea in humans. J Physiol. 2003;548:323–332. doi: 10.1113/jphysiol.2002.029678. [DOI] [PMC free article] [PubMed] [Google Scholar]
- Robbins PA, Conway J, Cunningham DA, Khamnei S, Paterson DJ. A comparison of indirect methods for continuous estimation of arterial PCO2 in men. J Appl Physiol. 1990;68:1727–1731. doi: 10.1152/jappl.1990.68.4.1727. [DOI] [PubMed] [Google Scholar]
- Sato K, Ogoh S, Hirasawa A, Oue A, Sadamoto T. The distribution of blood flow in the carotid and vertebral arteries during dynamic exercise in humans. J Physiol. 2011;589:2847–2856. doi: 10.1113/jphysiol.2010.204461. [DOI] [PMC free article] [PubMed] [Google Scholar]
- Sato K, Sadamoto T. Different blood flow responses to dynamic exercise between internal carotid and vertebral arteries in women. J Appl Physiol. 2010;109:864–869. doi: 10.1152/japplphysiol.01359.2009. [DOI] [PubMed] [Google Scholar]
- Schoning M, Walter J, Scheel P. Estimation of cerebral blood flow through colour duplex sonography of the carotid and vertebral arteries in healthy adults. Stroke. 1994;25:17–22. doi: 10.1161/01.str.25.1.17. [DOI] [PubMed] [Google Scholar]
- Slessarev M, Han J, Mardimae A, Prisman E, Preiss D, Volgyesi G, Ansel C, Duffin J, Fisher J. Prospective targeting and control of end-tidal CO2 and O2 concentrations. J Physiol. 2007;581:1207–1219. doi: 10.1113/jphysiol.2007.129395. [DOI] [PMC free article] [PubMed] [Google Scholar]
- Subudhi AW, Panerai RB, Roach RC. Acute hypoxia impairs dynamic cerebral autoregulation: results from two independent techniques. J Appl Physiol. 2009;107:1165–1171. doi: 10.1152/japplphysiol.00498.2009. [DOI] [PMC free article] [PubMed] [Google Scholar]
- Toda N, Okamura T. Cerebral vasodilators. Jpn J Pharmacol. 1998;76:349–367. doi: 10.1254/jjp.76.349. [DOI] [PubMed] [Google Scholar]
- Tojima H, Kuriyama T, Fukuda Y. Arterial to end-tidal PCO2 difference varies with different ventilatory conditions during steady state hypercapnia in the rat. Jpn J Physiol. 1988;38:445–457. doi: 10.2170/jjphysiol.38.445. [DOI] [PubMed] [Google Scholar]
- Wang Q, Pelligrino DA, Koenig HM, Albrecht RF. The role of endothelium and nitric oxide in rat pial arteriolar dilatory responses to CO2 in vivo. J Cereb Blood Flow Metab. 1994;14:944–951. doi: 10.1038/jcbfm.1994.126. [DOI] [PubMed] [Google Scholar]
- Wasserman AJ, Patterson JLJ. The cerebral vascular response to reduction in arterial carbon dioxide tension. J Clin Invest. 1961;40:1297–1303. doi: 10.1172/JCI104359. [DOI] [PMC free article] [PubMed] [Google Scholar]
- Willie CK, Colino FL, Bailey DM, Tzeng YC, Binsted G, Jones LW, Haykowsky MJ, Bellapart J, Ogoh S, Smith KJ, Smirl JD, Day TA, Lucas SJ, Eller LK, Ainslie PN. Utility of transcranial Doppler ultrasound for the integrative assessment of cerebrovascular function. J Neurosci Methods. 2011;196:221–237. doi: 10.1016/j.jneumeth.2011.01.011. [DOI] [PubMed] [Google Scholar]
- Wilson MH, Edsell MEG, Davagnanam I, Hirani SP, Martin DS, Levett DZH, Thornton JS, Golay X, Strycharczuk L, Newman SP, Montgomery HE, Grocott MPW, Imray CHE. Cerebral artery dilatation maintains cerebral oxygenation at extreme altitude and in acute hypoxia-an ultrasound and MRI study. J Cereb Bloodl Flow Metab. 2011;31:2019–2029. doi: 10.1038/jcbfm.2011.81. [DOI] [PMC free article] [PubMed] [Google Scholar]
- Wolff HG, Lennox WG. Cerebral circulation. XII. The effect on pial vessels of variations in the oxygen and carbon dioxide content of the blood. Arch Neuro and Psychiat. 1930;23:1097–1120. [Google Scholar]
- Xie A, Skatrud J, Barczi S, Reichmuth K, Morgan B, Mont S, Dempsey J. Influence of cerebral blood flow on breathing stability. J Appl Physiol. 2009;106:850–856. doi: 10.1152/japplphysiol.90914.2008. [DOI] [PMC free article] [PubMed] [Google Scholar]
- Xie A, Skatrud JB, Khayat R, Dempsey JA, Morgan B, Russell D. Cerebrovascular response to carbon dioxide in patients with congestive heart failure. Am J Respir Crit Care Med. 2005;172:371–378. doi: 10.1164/rccm.200406-807OC. [DOI] [PubMed] [Google Scholar]
- Zhang R, Zuckerman JH, Giller CA, Levine BD. Transfer function analysis of dynamic cerebral autoregulation in humans. Am J Physiol Heart Circ Physiol. 1998;274:H233–241. doi: 10.1152/ajpheart.1998.274.1.h233. [DOI] [PubMed] [Google Scholar]