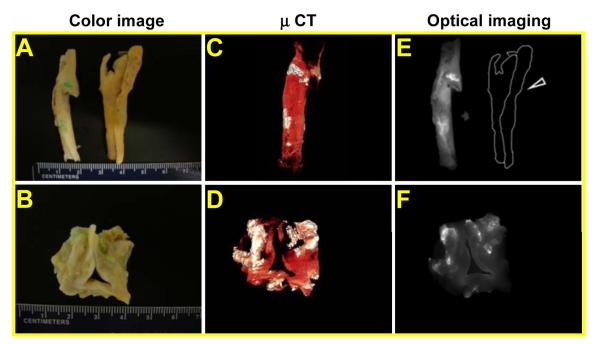
Figure 6.
Ex vivo images of cardiovascular tissues by NIR fluorescence. CEA tissues (A) and aortic valve (B) were incubated with Cy-HABP-19 for 1 h. Digital color images reveal extensive calcification (light cyan) in CEA specimens (A) and aortic valve (B). (C) and (D) μCT images. The white color represents calcified areas on the tissues. (E) and (F) NIR optical fluorescence images. These images are delineated as unmixed fluorescence-enhanced signal images (white) superimposed on the pseudo-background color image (gray). The control sample (marked by a dotted line and open arrowhead in panel C) did not exhibit any noticeable fluorescence in the optical imaging system.

