

Abstract
Study Objectives:
Time estimation is a complex cognitive task that is especially challenging when the time period includes sleep. To determine the accuracy of sleep duration perception, we investigated 44 healthy subjects participating in multi-day inpatient sleep protocols during which they had extended nighttime and short daytime sleep opportunities but no time cues or knowledge of time of day.
Methods:
The first sleep opportunity was at habitual sleep time and duration. The subsequent 3, 4, or 11 days had 12-h nighttime sleep opportunities and 4-h daytime nap opportunities, potentially creating an experimentally induced “insomnia” with substantial time awake during scheduled sleep.
Results:
Subjective sleep duration estimates were accurate for the first (habitual) sleep opportunity. The subjective reports following nighttime 12-h sleep opportunities significantly underestimated objective sleep duration, while those following daytime 4-h sleep opportunities significantly overestimated objective sleep duration. Misperception errors were not explained by poor sleep efficiency, which was lower during 4-h (~39%) than 12-h opportunities (~71%). Subjective sleep estimates after 4-h opportunities correlated with the percentage of REM and N3 sleep. Subjective sleep estimates following 12-h opportunities were, unexpectedly, negatively correlated with NREM stage 2 sleep.
Conclusion:
The estimation of sleep duration in the absence of time cues may depend on length of sleep opportunity and/or time of day. The results have implications for understanding sleep state misperception, which is an important consideration in patients with insomnia.
Citation:
Bianchi MT; Wang W; Klerman EB. Sleep misperception in healthy adults: implications for insomnia diagnosis. J Clin Sleep Med 2012;8(5):547-554.
Keywords: Insomnia, subjective sleep estimation, time perception, time cues
The clinical diagnosis and management of insomnia rests largely upon the subjective self-report of patients describing difficulty with sleep onset or sleep maintenance.1 It has long been recognized, however, that subjective reports may differ from objective measurements of sleep using physiological criteria.2–6 In particular, patients with insomnia may underestimate their actual sleep times and overestimate their wake times. This mismatch has implications for both diagnosis and treatment of patients with insomnia.
Perception of time as it relates to sleep is a particularly challenging topic. The subjective experience of wake may differ for the time elapsed preceding sleep onset compared to the time elapsed during mid-sleep awakenings. Also, mid-sleep awakenings may be associated with variable levels of alertness, which may affect perception. These issues become clinically important when considering the manifold forms of insomnia, and how the fragmentation of sleep and neurophysiological hyperarousal7,8 may affect time estimation. Current theories of insomnia pathophysiology include the issue of hyperarousal, as evidenced by increased high-frequency EEG activity as well as increased metabolism.7–9 The extent to which hyperarousal contributes to the failure to register what appears to be sleep by physiological criteria is an area of ongoing investigation.10 Because the diagnosis and management of insomnia each rely profoundly on patient self-report, it is critical that physicians and patients improve their understanding of subjective-objective mismatch in sleep duration, or sleep misperception.
BRIEF SUMMARY
Current Knowledge/Study Rationale: Sleep misperception remains an important yet poorly understood phenomenon in sleep medicine. We investigated misperception in healthy individuals with nighttime and daytime extended sleep opportunities expected to elicit isomnia in an experimental setting.
Study Impact: We found that healthy individuals with normal sleep perception at baseline exhibit misperception under inpatient experimental conditions that elicit insomnia. The extent to which insomnia patients with sleep misperception exhibit state or trait features warrants further exploration.
The extent to which sleep misperception may be a “trait” present in certain patients with sleep disorders, or a “state” that varies night to night, remains uncertain. In this study, we investigated self-reported sleep-wake estimates in healthy adults undergoing multiple days of inpatient assessments. Subjects had no time cues during the protocol, including not knowing the scheduled length of their sleep or wake opportunities, and had extended sleep opportunities during the day and at night, which caused an experimental form of insomnia due to excess time in bed. We hypothesized that the perception of sleep duration would be altered in this setting, and would relate to the degree of sleep fragmentation.
METHODS
Population
Healthy younger and older adults were pre-screened to rule out sleep and circadian disorders and prescription or elicit drug use. Subjects were healthy based on history, physical examination, electrocardiogram, routine blood and urine screens, and a polysomnogram to exclude those with sleep apnea and periodic limb movements.11,12 None had performed night shift work within 3 years or crossed more than one time zone in the previous 3 months. The age of the population was bi-modal, with a “younger” cohort (ages 18-32 years; n = 32) and an older cohort (ages 60-76; n = 12). Chronotype was assessed by the Horne and Ostberg method,13 described here as the Owl-Lark score.
Protocol
The protocol was approved by the Partners Healthcare Institutional Review Board. Actigraphy and diary monitoring for 3 weeks at home during habitual sleep behavior was followed immediately by the inpatient portion of study. During the home and inpatient portions, subjects abstained from medications, supplements, caffeine, tobacco, and alcohol. Subjects then spent 10-13 days and nights in the Brigham and Women's Hospital General Clinical Research Center, in single occupancy suites with no windows and no information about time. Subjects were not informed of the exact length of their scheduled sleep or wake opportunities; the consent documents stated “You will be assigned to one of four groups which have different patterns of sleep and wake times.” The inpatient portion of the protocol was designed to evaluate the response to sleep deprivation for a separate study; some data from this protocol have been previously reported.11,12 The inpatient portion began with an initial sleep opportunity at each subject's habitual sleep time and duration, followed by 3-8 consecutive days with 12-h nocturnal sleep opportunities (centered at the same time as habitual sleep) and 4-h daytime nap opportunities (centered 12 h opposite the 12-h nocturnal sleep period). For some subjects, a sleep deprivation occurred after these 3-8 days (random assignment stratified by age and sex); only the data from before the sleep deprivation and the final 8-h sleep period of the inpatient protocol after three 24-h days of recovery from the sleep deprivation are used for these analyses. The last sleep period was 8 h in duration, centered at the same time as the 12-h sleep period. This last period was not included in most of the Results analysis, unless specifically stated. During waking periods, subjects were not allowed to lie in bed. During sleep opportunities, which occurred in darkness, subjects were required to remain inactive in bed.
Subjective and Objective Recordings
Sleep was recorded on Vitaport digital recorders (Temec, The Netherlands) using standard EEG, EMG, and EOG montage, and scored in 30-sec increments according to Rechtschaffen and Kales criteria14 by experienced technicians. For this report, NREM stages 3 and 4 were analyzed separately and as a combined stage to yield stage N3, to align with recent changes in scoring criteria. After each sleep opportunity, subjects were asked to record their estimate of sleep latency, total sleep time (TST), and number of awakenings for the prior sleep period. The errors in these estimates were calculated as “subjective – objective,” such that negative values represent underestimation errors. Latency to persistent sleep (LPS) was defined as latency until the start of 20 consecutive epochs (10 min) of any stage of sleep. Wake after persistent sleep onset (WAPSO) was defined as the amount of wake occurring between the end of 20 consecutive epochs of sleep (LPS) and the final awakening. Objective criteria for number of awakenings was pre-specified to be ≥ 2 consecutive epochs (1 min) scored as wake after persistent sleep (as defined above) was achieved.
Analysis
Group comparisons for basic demographics, TST errors, and sleep efficiency were performed with either ANOVA with Bonferroni correction for multiple comparisons, or, in cases of non-Gaussian distributions, with nonparametric Kruskal-Wallis testing (with Dunn multiple comparisons test). Correlation analysis was conducted using the Spearman nonparametric method. For 12-h and 4-h sleep opportunities, each subject contributed multiple data points, and the number was not the same for all subjects due to the protocol (see supplemental material, Figure S1). Group analysis and correlation analysis were conducted by first taking the median of all 12-h or 4-h blocks for each subject, so that each subject contributed only one data point to the analysis.
RESULTS
Baseline Subject Characteristics
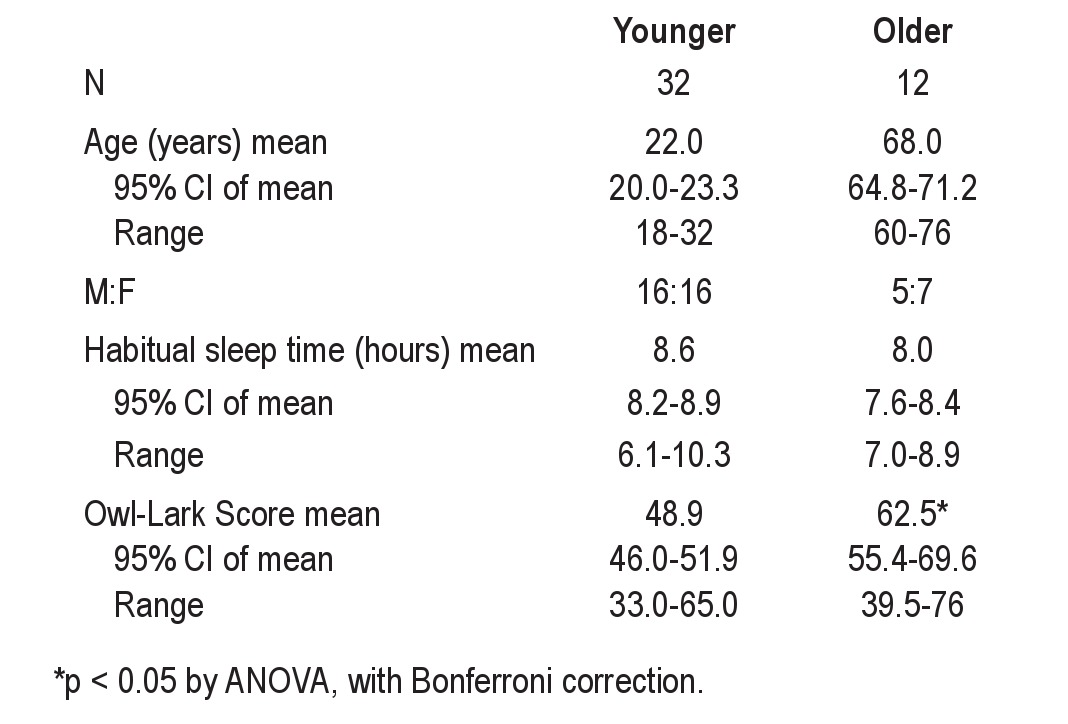
Table 1 contains the baseline characteristics of this population (n = 44), divided into older and younger groups. There were approximately equal numbers of males and females. The average habitual sleep durations overall were 8.4 ± 0.9 h (mean ± SD; range of 6.1 to 10.3 h). The habitual sleep durations were not statistically different between age groups, while the chronotype scores were different (ANOVA, p < 0.05), with older groups having more early-morning tendency.
Table 1.
Subject characteristics
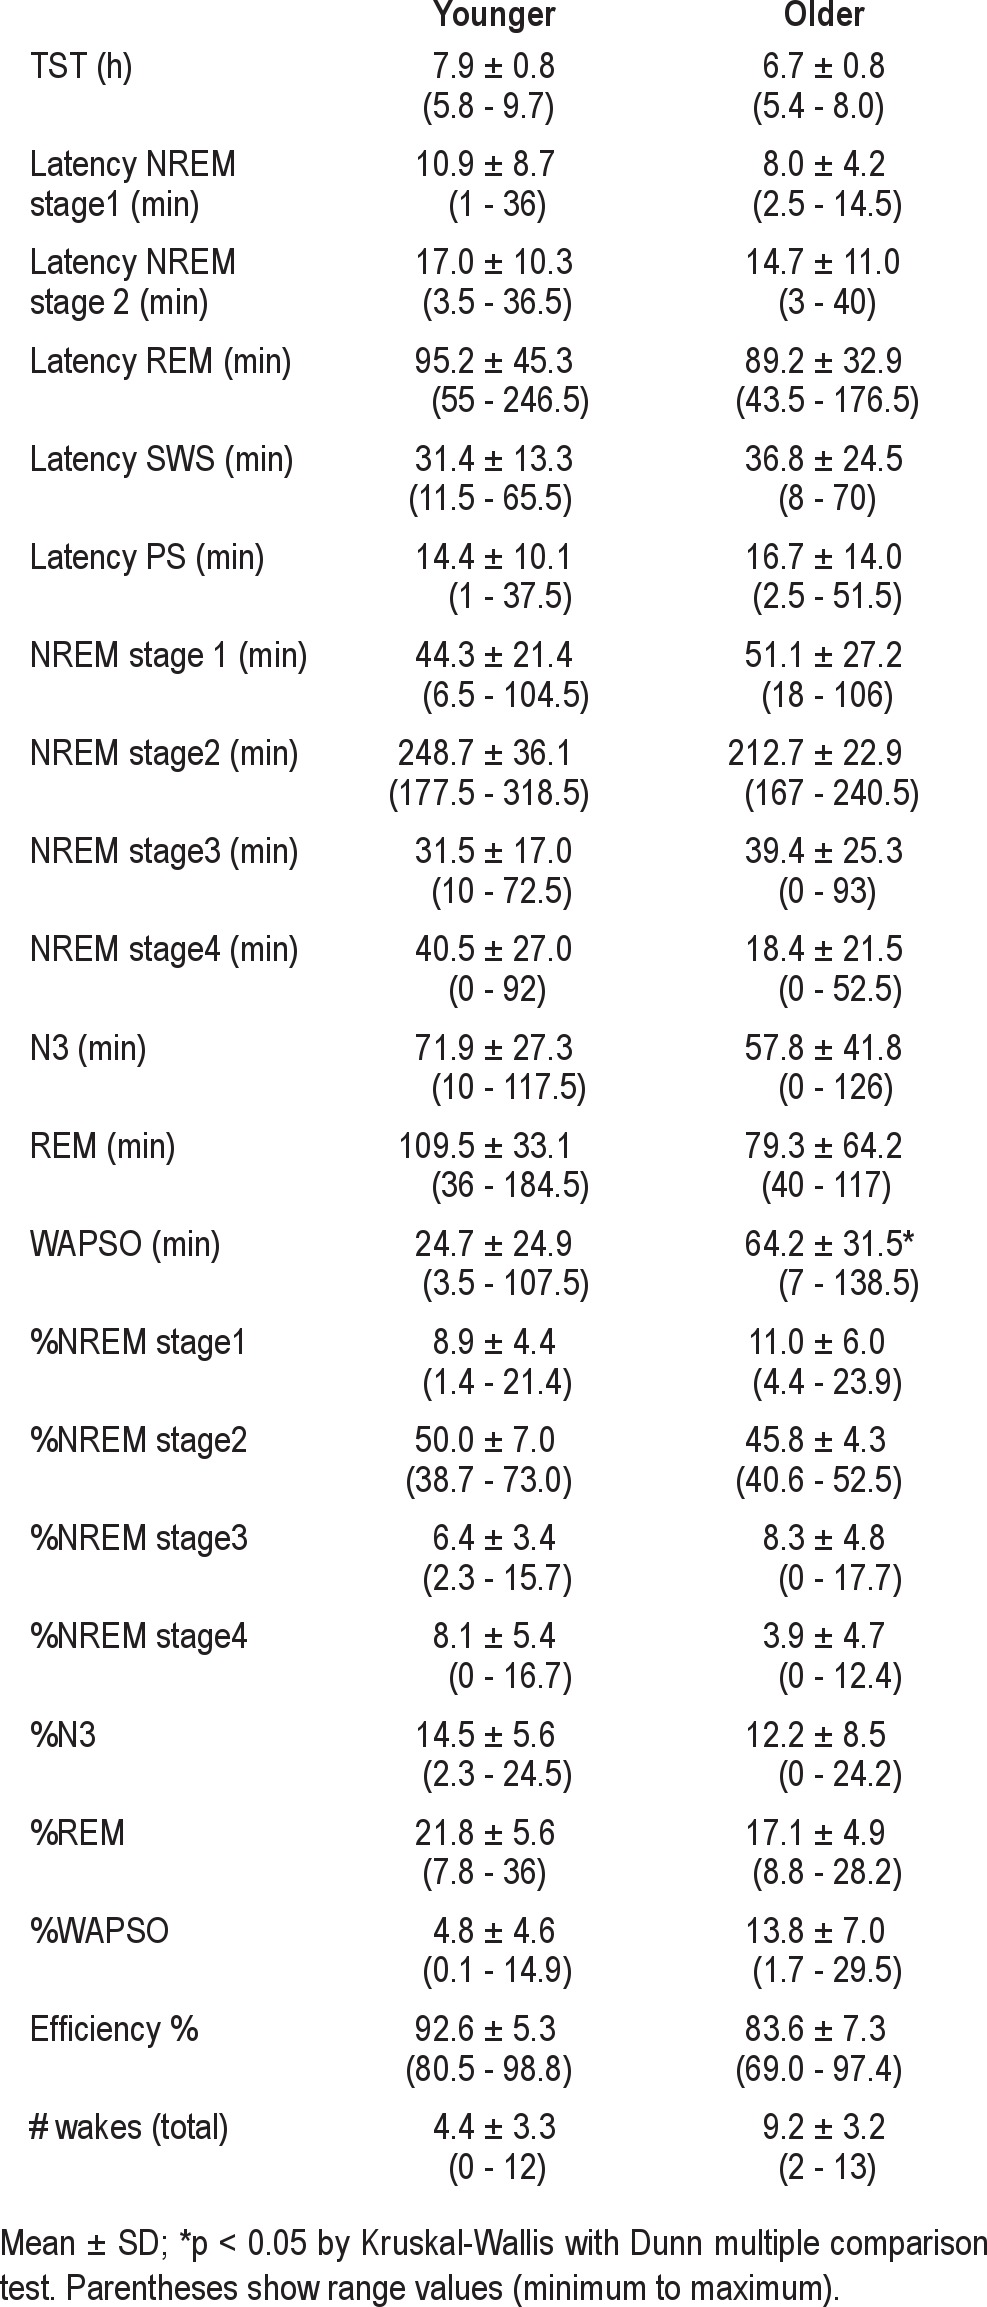
The first inpatient night began at each individual's habitual bedtime and lasted for their habitual sleep duration. We label this first night sleep period as “FNH.” The baseline sleep stage findings on this first night are shown in Table 2. The results with subgrouping by age or sex are reported in the supplemental material. Similar sleep time estimation patterns were observed for males and females. Although misperception showed a trend toward being more evident in younger than in older subjects, the differences were not significant. Thus, for the remaining analyses below, all 44 subjects were analyzed as a group.
Table 2.
Sleep characteristics on the first night of habitual time and duration
Changing Patterns of Sleep Stages across the Protocol
As expected, sleep efficiency was highest (> 90%) during the FNH night of the experimental protocol. Sleep efficiency was significantly decreased for the enforced nighttime 12-h sleep opportunities (Figure 1A); this is not surprising, given the excess time in bed compared with habitual sleep durations, which averaged ~8 h. Efficiency was lowest for the 4-h opportunities (Figure 1A) that occurred during the daytime. The distribution of sleep stages during the different sleep opportunities differed in the percentage of REM sleep (smaller in 4-h compared to FNH and 12-h), and in the percentage of NREM stage 1 sleep (larger in 4-h compared to FNH and 12-h) (Figure 1B). The temporal pattern of sleep efficiency demonstrates 2 tendencies: (i) gradually decreasing efficiency over successive days in the protocol, and (ii) systematically lower efficiency in the 4-h compared to the 12-h sleep opportunities (Figure 1C). The final sleep opportunity (8-h sleep opportunity) showed partial return towards the sleep efficiency of FNH.
Figure 1. Sleep stages and relation to total sleep time errors.

(A) Overall sleep efficiency in the different sleep opportunity durations. Brackets indicate significant differences with p < 0.05 by Kruskal-Wallis test with Dunn post-test. The median sleep efficiency value within individuals was used, such that each subject contributed one point for each sleep period. The first (FNH) opportunity and subsequent 12-h and 4-h opportunities are shown (B) Sleep stage composition in FNH, 4-h, and 12-h conditions. In each group, the values were averaged within subject for 12-h and 4-h periods, such that each subject contributes one point to the group data for each sleep period. *Significant difference from FNH and 12-h (p < 0.05; ANOVA with Bonferroni post-test). (C) Sleep efficiency across each sleep period of the protocol; brackets indicate significant differences (p < 0.05; ANOVA with Bonferroni post-test). Note that (i) SP1 is the first, habitual night (FNH, variable length), SP2 (and subsequent even numbers) are 12-h nocturnal sleep periods; SP3 (and subsequent odd numbers) are 4-h daytime nap periods. The final opportunity, SP17, is an 8-h sleep period centered at habitual time; (ii) the number of subjects contributing values to each sleep period decreased after SP8 due to the protocol design (n = 39-42 for SP 1-7, n = 32 for SP 8, n = 26 for SP 9, n = 11-12 for SP 10-16, and n = 12 for SP17). (D) Subjective TST estimate values according to the duration of sleep opportunity. In the box-and-whisker plots, the boxes show the median as well as 25% and 75% boundaries, while the whiskers show the 90% confidence range (5% to 95%). The “+” symbols indicate the mean value. Brackets indicate significant differences (p < 0.05; Kruskal-Wallis test, with Dunn post-test). In each group, the median value was taken across 12-h and 4-h periods, such that each subject contributes one point to the group data. (E) Objective TST values according to the duration of sleep opportunity. Box-and-whisker plots as in panel D. Brackets indicate significant differences (p < 0.05; Kruskal-Wallis test, with Dunn post-test).
Subjective Versus Objective Sleep-Wake Durations
Figure 1D shows that the subjective estimates following 12-h opportunities were significantly lower than those for the habitual duration, and that estimates for 4-h opportunities were significantly lower than those for either 12-h or FNH opportunities (p < 0.05, Kruskal-Wallis). Figure 1E shows for comparison the objective TST values for the FNH, 12-h, and 4-h sleep opportunities; the objective TST for 4-h periods was significantly smaller than the other periods (p < 0.05, Kruskal-Wallis).
Subjective TST estimates were accurate for FNH, with a median error of −9.1 min (quartiles of -43.5 to 51.3 min), not significantly different from zero error (Figure 2A). Negative values indicate underestimation (subjective minus objective TST minutes). Subjects significantly underestimated their TST for 12-h sleep opportunities, and overestimated their TST for 4-h sleep opportunities (Figure 2A). The median TST error was -109.4 min (quartiles of: -227.2 to -47.4) after 12-h opportunities and 58.3 min (quartiles of: −0.2 to +142.4) after 4-h opportunities (Figure 2A).
Figure 2. Accuracy of self-reported sleep latency, total sleep time, and awakenings.

Errors in estimating the total sleep time (A), sleep latency (B) and number of awakenings (C) are shown according to the sleep opportunity: first night habitual (FNH), 4-h and 12-h durations. In the box-and-whisker plots, the boxes show the median as well as 25% and 75% boundaries, while the whiskers show the 90% confidence range (5% to 95%). The “+” symbols indicate the mean value. In each group, the median value within each subject was used for 12-h and 4-h periods, such that each subject contributes one point to the group data. The error metric is derived from subtracting the objective value from the subjective value, such that negative values represent subjective underestimation. Brackets indicate significant differences by Kruskal-Wallis (in panel B and C, with Dunn post-test; p < 0.05). (D) The distribution of TST errors is shown over successive sleep periods. SP1 is the first, habitual night (FNH, variable length), SP2 (and subsequent even numbers) are 12-h nocturnal sleep periods; SP3 (and subsequent odd numbers) are 4-h daytime nap periods. SP17 is an 8-h sleep period centered at habitual time. Note that (i) SP1 is the first, habitual night (FNH, variable length) SP2 (and subsequent even numbers) are 12-h nocturnal sleep periods; n = 39-42 for SP 1-7, n = 32 for SP 8, n = 26 for SP 9, n = 11-12 for SP 10-16, and n = 12 for SP17. Brackets indicate significant differences between adjacent sleep periods (p < 0.05; ANOVA with Bonferroni correction).
Sleep latency estimations were accurate for FNH and 4-h sleep opportunities, but were slightly but significantly underestimated for 12-h sleep opportunities (Figure 2B). The number of reported awakenings within sleep was significantly underestimated compared to objective criteria for FNH and 12-h sleep opportunities, while the number reported for 4-h opportunities was accurate (Figure 2C).
To illustrate the temporal stability of the systematic under- and overestimations of TST, Figure 2D shows the errors for each sleep period: the alternating pattern for 12-h and 4-h sleep periods of errors persists throughout the protocol. The final sleep opportunity (SP17) was an 8-h opportunity at the habitual sleep time and shows resumed accuracy, although the variance was larger than on the first night. Similar patterns were observed when we compared male versus female subjects, and old versus young subjects (Figure S2).
Correlates of Subjective TST Estimation
We next conducted correlation analysis to determine whether the degree of TST error was related to sleep consolidation in the prior sleep period. There were no significant correlations between the TST error for a given 12-h or 4-h sleep opportunity and the sleep efficiency of the preceding 4-h or 12-h sleep opportunity, respectively (data not shown). We also conducted correlation analysis between the subjective TST estimates and sleep stage metrics (Table 3). No significant correlations were observed between sleep stages and TST estimates during FNH (data not shown), a condition in which TST estimates were highly accurate (see Figure 2A). We had predicted that TST estimates should have inverse correlations only with generally accepted metrics of sleep fragmentation, such as WASO, N1 sleep, and number of awakenings. These metrics were not significantly correlated with subjective TST estimations, however. Surprisingly, TST estimates were negatively correlated with the percentage of NREM stage 2 sleep.
Table 3.
Correlation with TST estimate
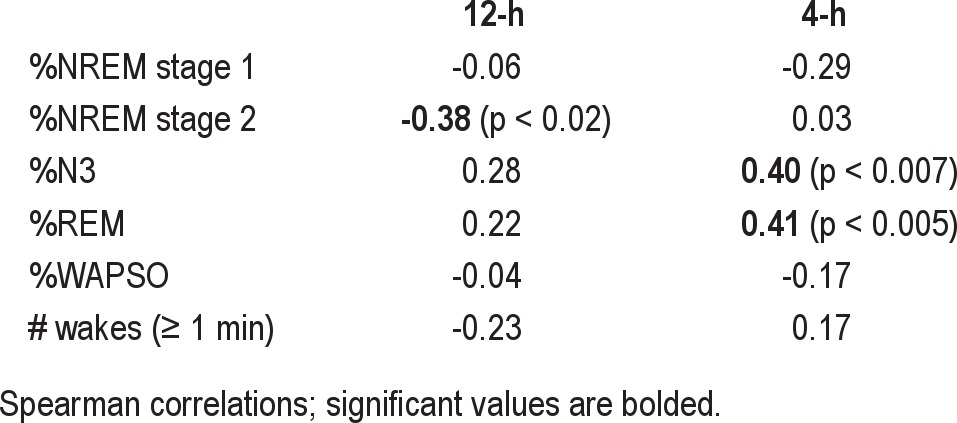
For the 4-h sleep periods, TST estimates were positively correlated with the percentage of stages N3 and REM sleep (Table 3). Similar correlations were found for individual NREM stages 3 and 4 sleep, when considered separately (data not shown).
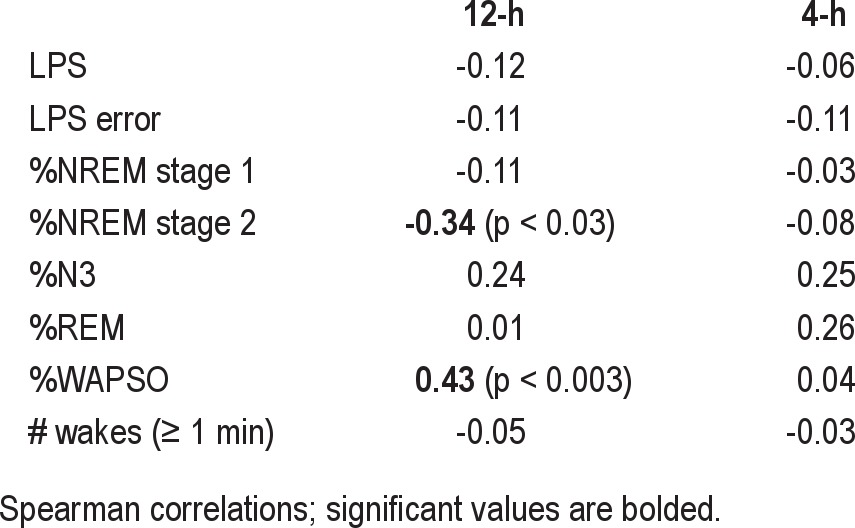
The above analysis considered the subjective estimation of TST, regardless of accuracy. We finally turn to investigation of correlations with the magnitude of the error in TST estimation (Table 4). Given that our calculation of TST error yields negative values for underestimation, positive correlation means “the higher the value of variable X, the less the TST underestimation.” Regarding 4-h sleep opportunities, we found no significant correlations between sleep-wake stage percentages, efficiency, or number of awakenings and the TST error (Table 4), including when NREM stages 3 and 4 were analyzed separately (not shown).
Table 4.
Correlation with TST error
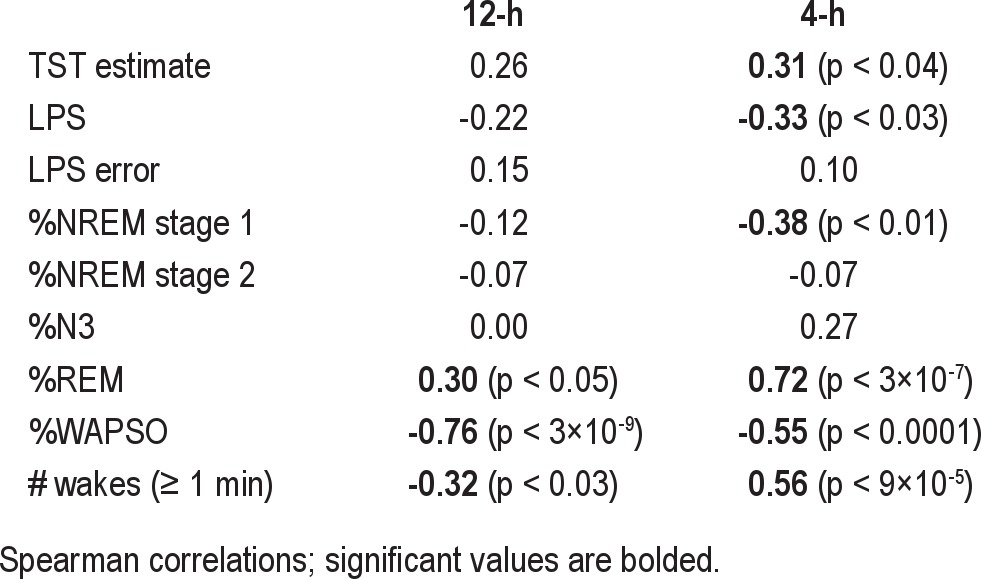
Of note, the objective TST was not significantly correlated with the subjective estimate of TST during 12-h sleep opportunities (r = 0.26; p > 0.05). Objective TST during 12-h sleep opportunities was, however, positively correlated with REM% (r = 0.30; p < 0.05), and inversely correlated with WAPSO% (r = −0.76; p < 3x10⁻⁹) and the number of awakenings (r = −0.32; p < 0.03) (Table 5). Objective TST during 4-h sleep opportunities was correlated positively with the subjective TST estimate (r = 0.31; p < 0.04), as well as the REM% (r = −0.72; p < 3x10⁻⁷), while it was inversely correlated with LPS (r = −0.33; p < 0.03), NREM stage 1% (r = −0.38; p < 0.01), and WAPSO% (r = −0.55; p < 0.0001). Unexpectedly, the objective TST was positively correlated with the number of awakenings during 4-h sleep opportunities (r = −0.56; p < 9×10⁻⁵), (Table 5).
Table 5.
Correlation with objective TST
Regarding 12-h opportunities, TST errors were not correlated with sleep latency errors, arguing against a “general” error of time perception. This suggested that retrospective self-report of sleep onset and total sleep time involve distinct cognitive processes. Contrary to expectations, TST error was positively correlated with WAPSO (lower WAPSO correlated with greater underestimation) and negatively correlated with the proportion of NREM stage 2 sleep (higher N2% correlated with greater underestimation). The direction of these relationships was unexpected, given the working hypothesis that errors are increased by sleep fragmentation. Two potential explanations were entertained. One is that larger errors are theoretically possible when more objective sleep (and less WAPSO) occurs and N2 comprises the majority of objective TST. The other possibility relates to the fact that the TST error is calculated directly from the objective TST, which is itself positively correlated with time spent in NREM stage 2 sleep and negatively correlated with time spent awake. To evaluate the potential for spurious correlations of TST error with sleep stage percentages due to this “embedded” correlation, we undertook additional analysis (supplemental material). This analysis shows how sleep architecture associations with TST error are confounded by the fact that the objective TST is both used in the calculation of the error and itself has correlations with sleep architecture components. This embedded correlation may lead to incorrect conclusions about TST error in relation to sleep stage percentages.
DISCUSSION
The main finding of this study is that healthy adults without evidence of sleep misperception on the baseline habitual night of sleep within an inpatient experimental facility exhibit substantial sleep misperception under subsequent conditions of (i) absence of time cues and (ii) extended time in bed per 24 hours. The inpatient extended sleep opportunity resulted in decreased sleep efficiency and thus a form of experimental insomnia. The misperception of sleep duration was bi-directional: overestimation of sleep following 4-h daytime nap opportunities, and underestimation of sleep following 12-h nocturnal sleep opportunities. Contrary to our working hypothesis, neither the subjective TST estimates nor the extent of their accuracy was correlated with commonly accepted indices of sleep fragmentation, such as NREM stage 1 sleep or the number of awakenings.
Time Perception during Sleep and Wake States
Retrospectively estimating sleep duration involves, among other things, time cues common to daily life, such as looking at the time just before bed, natural sunlight variations, and waking to an alarm in the morning. Systematic removal of time cues may compromise accuracy in retrospective time estimation. The use of auxiliary cues is not surprising, since sleep is a state of altered consciousness, and presumably an individual cannot directly assess a sense of time passage while asleep. For patients with insomnia, the existing data do not support the hypothesis that general time perception is abnormal. For example, in one study, time perception during wakefulness was intact in patients with insomnia,15,16 and in another study showing mild overestimations of short time periods (< 3 min), there were no differences between those with insomnia and controls.17
Sleep Stage Correlates of Sleep Misperception
Errors in TST underestimation are most clinically relevant for insomnia patients, who often demonstrate a component of sleep misperception.2 Underestimation errors were observed specifically for 12-h nighttime sleep opportunities, whereas overestimation was observed for 4-h daytime sleep opportunities. TST errors were related to NREM stage 2 sleep in an unexpected direction: the less of this stage, the higher the subjective TST estimate. The basis of this finding is uncertain, though it is worth mentioning that the percent of NREM stage 2 sleep was inversely related to the percentage of REM and N3 sleep. Thus the apparent correlation may be spurious (see supplemental material) and reflect its relation to these other stages of sleep, which themselves did not reach significance in correlations with TST estimates, possibly due to greater variance compared to the dominant NREM stage 2 sleep percentages. Similarly, the apparent correlation of TST error with the percentage of WAPSO was likely related to the strong inverse correlation of WAPSO with objective TST (see Table 5).
Regarding the potential importance of sleep stages, there is literature supporting the restorative and cognitive roles of REM and slow wave sleep,18,19 although a variety of opinions on the role of particular sleep stages exist.20–22 Here, REM and slow wave sleep only showed significant correlations with TST estimates following 4-h sleep opportunities. The relationship is clearly complex, since TST was overestimated for 4-h sleep opportunities, despite less REM sleep in these daytime naps.
Although we expected that the degree of fragmentation evidenced by increased WAPSO% would influence the perception of sleep, clearly this is not a simple causal relationship, as the TST errors following 12-h periods were larger when WAPSO% was smaller, and there was no correlation of WAPSO% with errors following 4-h periods. In addition, TST errors for 4-h periods were overestimated despite the markedly decreased sleep efficiency. One might predict that this overestimation was in fact related to sleep inertia when awakening from slow wave sleep. Despite a correlation of TST estimate following 4-h sleep opportunities with the N3%, there was no correlation of TST error for 4-h sleep periods with the absolute or relative amount of slow wave sleep whether it was considered as NREM stages 3 and 4 sleep separately or combined as stage N3 sleep. In fact, the magnitude of TST error for 4-h periods was not correlated with any other sleep-wake metrics. Therefore, misperception is not strictly related to the degree of fragmentation or WAPSO. The difference between subjective estimates and the extent to which they are incorrect (i.e., the TST error) suggest that the subjective experience of sleep has complex dependencies, only a portion of which relates to the sleep-wake stage content of the sleep opportunity.
In summary, subjective sleep estimates demonstrated correlation with sleep stage amounts. The magnitude of misperception errors, however, showed no clear mechanistic link to the amounts of individual sleep stages. The potential roles for circadian phase in sleep perception could not be assessed in these protocols, but could represent an important factor in how we process time perception. We also cannot address whether subjects inferred either the time of day or the expected sleep duration based on the repeating alternation of 12-h and 4-h sleep opportunities, despite not being informed of this pattern. The extent of misperception was nevertheless substantial, even if unaccounted for heuristics were involved.
Clinical Implications of Misperception
Despite the extensive literature documenting the occurrence of misperception in various sleep disorders,2–6,23,24 the issue of perception is not typically addressed in epidemiological studies that depend on self-reported sleep.25 Many reports utilize subjective reports of latency, efficiency, and total sleep time in insomnia interventions.26 Although the patient's subjective perception is a justifiable endpoint for assessing the effectiveness of interventions, from a mechanistic standpoint and from the perspective of possible feedback to re-align subjective-objective mismatch, understanding the degree to which this phenomenon occurs in insomnia patients remains an important goal.
Clearly the misperception of sleep times was a “state” rather than a “trait” phenomenon in this study of healthy adults. Patients with insomnia could, in principle, demonstrate a trait of misperception, independent of the sleep stage amounts on a particular night, in which case pharmacological management takes on a perspective other than increasing the amount of sleep obtained. Other patients may demonstrate fluctuations in their sleep stage amounts and consolidation from night to night, and thus their degree of misperception may also fluctuate as a reversible state. Determining where on this spectrum a particular patient resides may have important implications for insomnia management.
Limitations
This study has several limitations. First, the experimental setting was highly controlled, and thus may not have external validity with respect to the sleep-wake patterns of patients with insomnia. Although excess time in bed is a maladaptive behavior adopted by some patients with insomnia, absence of time cues and other experimental restrictions on activity do not occur clinically. The variance in misperception among individuals with insomnia accounted for by excess time in bed is unknown. Moreover, the habit of clock-watching may actually exacerbate insomnia. Second, the form of insomnia observed here is entirely attributed to excess time in bed, whereas clinical insomnia is often multifactorial. Third, healthy subjects presumably do not have the hyperarousal that is hypothesized to be a major pathophysiological aspect of chronic insomnia. The extent to which hyperarousal contributes to misperception is incompletely understood, but cortical hyperarousal is a plausible (and testable) potential etiology.10 Finally, we cannot distinguish possible contributions of circadian factors (i.e., time of day or night) or sleep opportunity duration (4-h or 12-h) as potential causes of the differences in misperception between the two types of sleep period using these data.
DISCLOSURE STATEMENT
This was not an industry supported study. Dr. Bianchi has a patent pending on a home sleep monitoring device that may be used in the future for insomnia patients. Dr. Klerman has received support from Respironics and Sony Corporations. The other author has indicated no financial conflicts of interest.
ACKNOWLEDGMENTS
The authors thank Drs. Andrew Phillips and Catherine Chu-Shore for valuable discussions. Funding: Department of Neurology, Massachusetts General Hospital, Center for Integration of Medicine and Innovative Technology, and the Clinical Investigator Training Program: Harvard/MIT Health Sciences and Technology – Beth Israel Deaconess Medical Center, in collaboration with Pfizer, Inc. and Merck &Co. (MTB); NIH P01-AG009975, NSBRI HFP01603, NIH RC2-HL101340, K02-HD045459, and NIH K24-HL105664 (EBK); and NCRR-GCRC-M01-RR02635 to the BWH GCRC.
SUPPLEMENTAL MATERIAL
To evaluate the potential for spurious correlations between TST error and sleep architecture components, we performed a simulation experiment. Fifty “subjects” were simulated to have normally distributed variance of stage percentages with the following means: 5% wake, 5% N1, 50% N2, 20% N3, and 20% REM. These values were chosen to approximate typical amounts seen in laboratory polysomnogram data. We assumed a fixed time of 8 h total time in bed. We then simulated subjective TST values as random numbers from 180 to 480 min, to mimic the majority of the experimentally observed subjective sleep times. These simulated estimates had no correlation, by definition, with the simulated objective TST values (mean 95% efficiency, or ~456 min). These values allowed us to test the hypothesis that TST errors could be spuriously correlated to sleep stage percentages simply because stage percentages are correlated with the objective TST, and TST enters into the calculation of TST error.
The simulated objective TST values showed the following significant correlation coefficients: wake, 1.0; N2, 0.77; N3, 0.21; REM 0.17 (p < 0.05). This demonstrates, as expected, that the objective TST is correlated to varying degrees with sleep-wake stages. The exact inverse correlation with wake is due to the fact that TST is calculated by subtracting wake from the time in bed.
We then measured correlations between the TST errors and the simulated sleep stages. Figure S3, A1 shows that the percentage of N2 sleep was correlated with the TST error, with r = 0.42 (p < 0.002). Thus, even though the simulated subjective sleep times were randomly assigned, the TST error can show “significant” sleep stage correlations, because the objective TST was itself strongly correlated with stages, in particular, here, with stage N2 sleep. Figure S3, A2 shows the observed data from our experimental subjects, demonstrating that the correlation of TST error with stage N2 sleep was similar to that seen in our simulations.
Although these simulations were compelling, they included assumptions about stage percentages and subjective estimates. Therefore, we next turned to our experimental data to explore the potential for spurious correlations. To this end, we randomized the experimental TST error values by reassigning the subjective estimates randomly, and repeated this scrambling process 100 times, to generate a distribution of possible correlation coefficients. We performed this analysis with the WAPSO percent (Figure S3, B) and the N2 percentage (not shown). Note that the strong correlation with WAPSO in the experimental data (~0.4) is well within the range expected by pure chance, using this scrambling protocol. Thus, by these complementary methods, we conclude that sleep-wake stage percentage correlations with TST error are inherently confounded by the “embedded” correlations with TST itself.
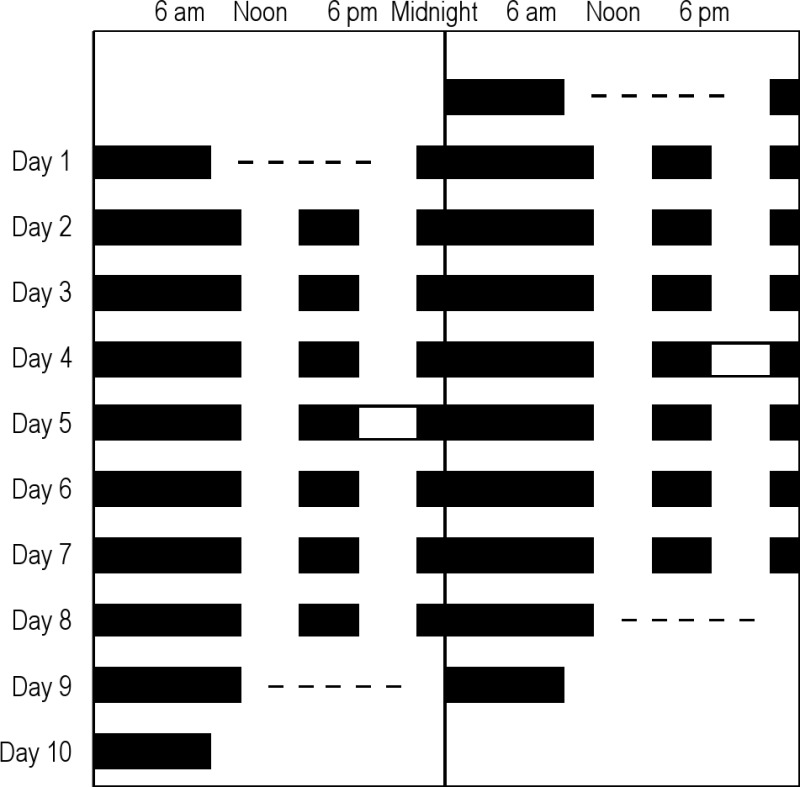
The protocol for the study is shown in double raster format. Clock time is on the X-axis, and day on the Y-axis. Black bars represent sleep opportunities. For some subjects (random assignment), a sleep deprivation occurred after 3 (n = 12) or 4 (n = 20) days of this 12+4 schedule; 12 subjects continued on this schedule without sleep deprivation for 8 days (as shown in figure). Data after this sleep deprivation were not included in these analyses, except for the final 8-h sleep episode, in certain analyses. Actual protocol times were adjusted for each subject. The dashes indicate that multiple sleep latency testing was performed. Total n = 44.
The error in TST (defined as subjective – objective values, in minutes) is given according to sleep period (SP#). The means and SD values are shown for subgroups as follows: males (A), females (B), younger (C), and older (D). Brackets indicate significant differences between adjacent sleep periods (ANOVA with Bonferroni correction; p < 0.05). For the male group, n = 19-23 for SP 1-7, n = 16 for SP 8, n = 15 for SP 9, n = 5-6 for SP 10-16, and n = 13 for SP17. For the female group, n = 17-21 for SP 1-7, n = 16 for SP 8, n = 11 for SP 9, n = 5-6 for SP 10-16, and n = 11 for SP17. For the younger group, n = 28-31 for SP 1-7, n = 24 for SP 8, n = 20 for SP 9, n = 7-8 for SP 10-16, and n = 16 for SP17. For the older group, n = 10-12 for SP 1-7, n = 8 for SP 8, n = 6 for SP 9, n = 3-4 for SP 10-16, and n = 8 for SP17. The reason for variation in particular sleep periods relates to infrequent missing data, as well as differences in when the sleep deprivation occurred (i.e., whether after sleep period 8 or 9).

Sleep-wake stage percentages were simulated as Gaussian distributions (± 20% standard deviation) centered at these mean values: 5% wake, 5% N1, 50% N2, 20% N3, and 20% REM. Four of the 5 stages were simulated, and the final stage adjusted to yield 100% (with approximately equal proportion of each stage being the “adjusted” one); negative values were not allowed. TST was calculated by subtracting the % wake from the fixed time in bed of 8 hours. Random subjective TST values, in a uniform distribution between 180 min and 480 min were used to calculate TST error values. Panel A1 shows the correlation of TST error with the NREM stage 2 percentage (linear regression and 95% confidence interval), with r = 0.42 (p < 0.002). Panel A2 shows the same analysis applied to the observed data from our experimental subjects. Panel B shows the distribution of correlation coefficients between WAPSO % and the TST error obtained over 100 trials of random scrambling of the experimental TST error values. The observed correlation is shown (left column) for comparison. In the box-and-whisker plots, the boxes show the median as well as 25% and 75% boundaries, while the whiskers show the 90% confidence range (5% to 95%); outliers are shown as filled circles.

REFERENCES
- 1.Chesson A, Jr., Hartse K, Anderson WM, et al. Practice parameters for the evaluation of chronic insomnia. An American Academy of Sleep Medicine report. Standards of Practice Committee of the American Academy of Sleep Medicine. Sleep. 2000;23:237–41. [PubMed] [Google Scholar]
- 2.Edinger JD, Krystal AD. Subtyping primary insomnia: is sleep state misperception a distinct clinical entity? Sleep Med Rev. 2003;7:203–14. doi: 10.1053/smrv.2002.0253. [DOI] [PubMed] [Google Scholar]
- 3.Bonnet MH, Arand DL. Physiological activation in patients with sleep state misperception. Psychosom Med. 1997;59:533–40. doi: 10.1097/00006842-199709000-00011. [DOI] [PubMed] [Google Scholar]
- 4.Edinger JD, Fins AI. The distribution and clinical significance of sleep time misperceptions among insomniacs. Sleep. 1995;18:232–9. doi: 10.1093/sleep/18.4.232. [DOI] [PubMed] [Google Scholar]
- 5.Frankel BL, Coursey RD, Buchbinder R, Snyder F. Recorded and reported sleep in chronic primary insomnia. Arch Gen Psychiatry. 1976;33:615–23. doi: 10.1001/archpsyc.1976.01770050067011. [DOI] [PubMed] [Google Scholar]
- 6.Carskadon MA, Dement WC, Mitler MM, Guilleminault C, Zarcone VP, Spiegel R. Self-reports versus sleep laboratory findings in 122 drug-free subjects with complaints of chronic insomnia. Am J Psychiatry. 1976;133:1382–8. doi: 10.1176/ajp.133.12.1382. [DOI] [PubMed] [Google Scholar]
- 7.Nofzinger EA, Buysse DJ, Germain A, Price JC, Miewald JM, Kupfer DJ. Functional neuroimaging evidence for hyperarousal in insomnia. Am J Psychiatry. 2004;161:2126–8. doi: 10.1176/appi.ajp.161.11.2126. [DOI] [PubMed] [Google Scholar]
- 8.Bonnet MH, Arand DL. Hyperarousal and insomnia. Sleep Med Rev. 1997;1:97–108. doi: 10.1016/s1087-0792(97)90012-5. [DOI] [PubMed] [Google Scholar]
- 9.Perlis ML, Merica H, Smith MT, Giles DE. Beta EEG activity and insomnia. Sleep Med Rev. 2001;5:363–74. doi: 10.1053/smrv.2001.0151. [DOI] [PubMed] [Google Scholar]
- 10.Bonnet MH, Arand DL. Hyperarousal and insomnia: state of the science. Sleep Med Rev. 2010;14:9–15. doi: 10.1016/j.smrv.2009.05.002. [DOI] [PubMed] [Google Scholar]
- 11.Klerman EB, Dijk DJ. Age-related reduction in the maximal capacity for sleep--implications for insomnia. Curr Biol. 2008;18:1118–23. doi: 10.1016/j.cub.2008.06.047. [DOI] [PMC free article] [PubMed] [Google Scholar]
- 12.Klerman EB, Dijk DJ. Interindividual variation in sleep duration and its association with sleep debt in young adults. Sleep. 2005;28:1253–9. doi: 10.1093/sleep/28.10.1253. [DOI] [PMC free article] [PubMed] [Google Scholar]
- 13.Horne JA, Ostberg O. A self-assessment questionnaire to determine morningness-eveningness in human circadian rhythms. Int J Chronobiol. 1976;4:97–110. [PubMed] [Google Scholar]
- 14.Rechtschaffen A, Kales A. Washington, DC: U.S. Government Printing Office; 1968. A manual of standardized terminology, techniques, and scoring system for sleep stages of human subjects. [Google Scholar]
- 15.Rioux I, Tremblay S, Bastien CH. Time estimation in chronic insomnia sufferers. Sleep. 2006;29:486–93. doi: 10.1093/sleep/29.4.486. [DOI] [PubMed] [Google Scholar]
- 16.Tang NK, Harvey AG. Time estimation ability and distorted perception of sleep in insomnia. Behav Sleep Med. 2005;3:134–50. doi: 10.1207/s15402010bsm0303_2. [DOI] [PubMed] [Google Scholar]
- 17.Fichten CS, Creti L, Amsel R, Bailes S, Libman E. Time estimation in good and poor sleepers. J Behav Med. 2005;28:537–53. doi: 10.1007/s10865-005-9021-8. [DOI] [PubMed] [Google Scholar]
- 18.Walker MP, van der Helm E. Overnight therapy? The role of sleep in emotional brain processing. Psychol Bull. 2009;135:731–48. doi: 10.1037/a0016570. [DOI] [PMC free article] [PubMed] [Google Scholar]
- 19.Born J, Rasch B, Gais S. Sleep to remember. Neuroscientist. 2006;12:410–24. doi: 10.1177/1073858406292647. [DOI] [PubMed] [Google Scholar]
- 20.Vassalli A, Dijk DJ. Sleep function: current questions and new approaches. Eur J Neurosci. 2009;29:1830–41. doi: 10.1111/j.1460-9568.2009.06767.x. [DOI] [PubMed] [Google Scholar]
- 21.Ficca G, Salzarulo P. What in sleep is for memory. Sleep Med. 2004;5:225–30. doi: 10.1016/j.sleep.2004.01.018. [DOI] [PubMed] [Google Scholar]
- 22.Siegel JM. The REM sleep-memory consolidation hypothesis. Science. 2001;294:1058–63. doi: 10.1126/science.1063049. [DOI] [PMC free article] [PubMed] [Google Scholar]
- 23.Manconi M, Ferri R, Sagrada C, et al. Measuring the error in sleep estimation in normal subjects and in patients with insomnia. J Sleep Res. 2010;19:478–86. doi: 10.1111/j.1365-2869.2009.00801.x. [DOI] [PubMed] [Google Scholar]
- 24.Means MK, Edinger JD, Glenn DM, Fins AI. Accuracy of sleep perceptions among insomnia sufferers and normal sleepers. Sleep Med. 2003;4:285–96. doi: 10.1016/s1389-9457(03)00057-1. [DOI] [PubMed] [Google Scholar]
- 25.Ohayon MM. Epidemiology of insomnia: what we know and what we still need to learn. Sleep Med Rev. 2002;6:97–111. doi: 10.1053/smrv.2002.0186. [DOI] [PubMed] [Google Scholar]
- 26.Vincent N, Penner S, Lewycky S. What predicts patients' perceptions of improvement in insomnia? J Sleep Res. 2006;15:301–8. doi: 10.1111/j.1365-2869.2006.00529.x. [DOI] [PubMed] [Google Scholar]
Associated Data
This section collects any data citations, data availability statements, or supplementary materials included in this article.
Supplementary Materials
The protocol for the study is shown in double raster format. Clock time is on the X-axis, and day on the Y-axis. Black bars represent sleep opportunities. For some subjects (random assignment), a sleep deprivation occurred after 3 (n = 12) or 4 (n = 20) days of this 12+4 schedule; 12 subjects continued on this schedule without sleep deprivation for 8 days (as shown in figure). Data after this sleep deprivation were not included in these analyses, except for the final 8-h sleep episode, in certain analyses. Actual protocol times were adjusted for each subject. The dashes indicate that multiple sleep latency testing was performed. Total n = 44.
The error in TST (defined as subjective – objective values, in minutes) is given according to sleep period (SP#). The means and SD values are shown for subgroups as follows: males (A), females (B), younger (C), and older (D). Brackets indicate significant differences between adjacent sleep periods (ANOVA with Bonferroni correction; p < 0.05). For the male group, n = 19-23 for SP 1-7, n = 16 for SP 8, n = 15 for SP 9, n = 5-6 for SP 10-16, and n = 13 for SP17. For the female group, n = 17-21 for SP 1-7, n = 16 for SP 8, n = 11 for SP 9, n = 5-6 for SP 10-16, and n = 11 for SP17. For the younger group, n = 28-31 for SP 1-7, n = 24 for SP 8, n = 20 for SP 9, n = 7-8 for SP 10-16, and n = 16 for SP17. For the older group, n = 10-12 for SP 1-7, n = 8 for SP 8, n = 6 for SP 9, n = 3-4 for SP 10-16, and n = 8 for SP17. The reason for variation in particular sleep periods relates to infrequent missing data, as well as differences in when the sleep deprivation occurred (i.e., whether after sleep period 8 or 9).
Sleep-wake stage percentages were simulated as Gaussian distributions (± 20% standard deviation) centered at these mean values: 5% wake, 5% N1, 50% N2, 20% N3, and 20% REM. Four of the 5 stages were simulated, and the final stage adjusted to yield 100% (with approximately equal proportion of each stage being the “adjusted” one); negative values were not allowed. TST was calculated by subtracting the % wake from the fixed time in bed of 8 hours. Random subjective TST values, in a uniform distribution between 180 min and 480 min were used to calculate TST error values. Panel A1 shows the correlation of TST error with the NREM stage 2 percentage (linear regression and 95% confidence interval), with r = 0.42 (p < 0.002). Panel A2 shows the same analysis applied to the observed data from our experimental subjects. Panel B shows the distribution of correlation coefficients between WAPSO % and the TST error obtained over 100 trials of random scrambling of the experimental TST error values. The observed correlation is shown (left column) for comparison. In the box-and-whisker plots, the boxes show the median as well as 25% and 75% boundaries, while the whiskers show the 90% confidence range (5% to 95%); outliers are shown as filled circles.