

Abstract
Background and Objective
Medical groups have invested billions of dollars in electronic medical records (EMRs), but few studies have examined the cost-effectiveness of EMR-based clinical decision support (CDS). This study examined the cost-effectiveness of EMR-based CDS for adults with diabetes from the perspective of the health care system.
Data Sources/Setting
Clinical outcome and cost data from a randomized clinical trial of EMR-based CDS were used as inputs into a diabetes simulation model. The simulation cohort included 1,092 patients with diabetes with A1c above goal at baseline.
Study Design
The United Kingdom Prospective Diabetes Study Outcomes Model, a validated simulation model of diabetes, was used to evaluate remaining life years, quality-adjusted life years (QALYs), and health care costs over patient lifetimes (40-year time horizon) from the health system perspective.
Principal Findings
Patients in the intervention group had significantly lowered A1c (0.26 percent, p = .014) relative to patients in the control arm. Intervention costs were $120 (SE = 45) per patient in the first year and $76 (SE = 45) per patient in the following years. In the base case analysis, EMR-based CDS increased lifetime QALYs by 0.04 (SE = 0.01) and increased lifetime costs by $112 (SE = 660), resulting in an incremental cost-effectiveness ratio of $3,017 per QALY. The cost-effectiveness of EMR-based CDS persisted in one-way, two-way, and probabilistic sensitivity analyses.
Conclusions
Widespread adoption of sophisticated EMR-based CDS has the potential to modestly improve the quality of care for patients with chronic conditions without substantially increasing costs to the health care system.
Diabetes is a common and costly chronic disease. In 2007, 17.9 million U.S. residents were diagnosed with diabetes at a cost to the economy of $174 billion (American Diabetes Association 2008).1 The Centers for Disease Control has estimated the lifetime risk of developing diabetes for individuals born in the United States in 2000 to be 32.8 percent for men and 38.5 percent for women (Narayan et al. 2003). Despite recent improvement trends, in 2008, less than 20 percent of diabetes patients reached evidence-based goals for glycated hemoglobin (A1c), blood pressure (BP), and low-density lipoprotein (LDL) cholesterol (Saydah, Fradkin, and Cowie 2004; Hoerger et al. 2008). Appropriate control of these risk factors would substantially reduce the rate of major microvascular or macrovascular diabetes-related complications and their associated costs (Patel et al. 2007; Dluhy and McMahon 2008; Gaede et al. 2008; Gerstein et al. 2008; Holman et al. 2008).
One of the major barriers to improved diabetes care is the lack of timely intensification of pharmacotherapy in patients who have not achieved recommended clinical goals. Many factors contribute to this problem, including competing demands at the time of the visit (Parchman et al. 2007) and medication nonadherence (Karter et al. 2009). Rates of treatment intensification when patient are not at goal hover around 70–80 percent (Bolen et al. 2009). Studies have linked higher rates of treatment intensification by a primary care provider (PCP) to improved A1c, BP, and LDL control (McEwen et al. 2009).
Interventions to improve the rates of appropriate treatment intensification include team-based case management, telephone-based management, and information technology-based interventions (Piette et al. 2001; Norris et al. 2002b; Bu et al. 2007). Integrated clinical decision support (CDS) systems have the potential to improve clinical care for millions of persons who are enrolled in health plans that have deployed electronic medical records (EMRs). EMRs can be programmed to include sophisticated algorithms that take advantage of current and past clinical information to provide detailed recommendations at the time of a clinical encounter (Von Korff et al. 1997; Wagner 1998; de Jaegher and Jegers 2001).
Initial efforts at EMR-based CDS for diabetes typically improved processes of care (such as rate of A1c or LDL testing or eye exams) but failed to improve A1c, BP, or LDL control (Montori et al. 2002; Meigs et al. 2003;Crosson et al. 2005; O'Connor et al. 2005; Ziemer et al. 2006; Grant et al. 2008; Peterson et al. 2008). EMR-based CDS for other chronic conditions such as hypertension, congestive heart failure (CHF), and asthma similarly failed to improve key intermediate clinical outcomes (Montgomery and Fahey 1998; Tierney et al. 2003; Balas et al. 2004; Murray et al. 2004). A careful reading of these studies identified several possible reasons why these efforts failed: first, most CDS was limited to general prompts and reminders and did not include more detailed drug-specific advice; second, introduction of CDS was usually not accompanied by changes in staff responsibilities and clinic workflow to maximize the impact on clinical care; third, rather than being used for visit planning, CDS displays were usually provided late in the encounter and were often skipped over or not viewed by PCPs.
A new generation of EMR-based CDS addressed these concerns by providing treatment recommendations including personalized and detailed drug-specific advice, and by reorganizing the workflow to incorporate recommendations into visits-planning activities. As a result, these system-wide interventions are beginning to have an impact on intermediate outcomes including A1c, BP, and LDL. However, concerns remain regarding the potential costs of these interventions, and evidence on both their costs and cost-effectiveness is limited. This study examines the cost-effectiveness of an EMR-based CDS that was implemented in a large Midwestern health plan.
Methods
EMR-Based Clinical Decision Support
An EMR-based CDS (referred to as “Diabetes Wizard”) was implemented at HealthPartners Medical Group, a large medical group in Minnesota that provided care to approximately 9,000 adults with diabetes in 2007. The Wizard was developed to inform clinical care for type 2 diabetes patients aged 18–75. Adults aged 75 years and older and those with a Charlson comorbidity scores of 3 or more (indicating high short-term risk of mortality) were excluded from the study because of legitimate debate about appropriate clinical goals in such patients (Charlson et al. 1987; Brown et al. 2003). The Wizard was not meant to override or supersede clinical judgment.
Wizard implementation included the following changes in clinic workflow at intervention clinics: (1) Rooming nurse enters blood pressure readings into EMR as usual; (2) If patient has diabetes, rooming nurse opens Wizard and prints a EMR-generated Wizard form that provides data on primary clinical indicators, treatment recommendations, and safety alerts; (3) Rooming nurse places the printed Wizard form on top of the visit summary sheet on the exam room door for the doctor to view just prior to the visit; (4) PCP reviews the available diabetes treatment options printed on the Wizard just prior to entering the room and proceeds with the visit; and (5) After the visit but before closing the encounter, the PCP opens the Wizard form in the EMR visit navigator and completes the brief visit resolution form.
Diabetes Wizard recommendations were based on detailed clinical algorithms constructed by the research team (JSH, PJO) consistent with evidence-based diabetes guidelines from the Institute for Clinical Systems Improvement (ICSI) and from other evidence-based sources (O'Connor and Sperl-Hillen 2008 ICSI 2009). Recommendations were not displayed if patients had achieved care goals for A1c, BP, and LDL and had no safety alerts. Safety alerts were displayed if (a) patients had contraindications to existing treatments (e.g., metformin use in renal insufficiency or CHF), (b) were treated with potentially risky drug combinations (e.g., concomitant beta-blocker and nondihydropyridone calcium channel blocker), or (c) had overdue or abnormal safety laboratory tests such as potassium, serum creatinine, creatine kinase, or liver function tests. Wizard also suggested short follow-up intervals, such as monthly visits, for patients not at goal, since this is associated with better chronic disease outcomes in many clinical trials.
After each office visit at which Wizard was deployed, the PCP was asked to complete a brief (15 seconds per clinical domain) “visit resolution form” to indicate whether treatment was intensified at the time of the visit. If treatment was intensified, the form required only one click per uncontrolled clinical domain. If treatment was not intensified, PCPs were asked to specify why not. The fastest way to complete the visit resolution form was to intensify therapy for patients not at goal.
The clinical effectiveness of the Diabetes Wizard was examined in a clinic-randomized trial including 11 clinics with 41 consenting PCPs (O'Connor et al. 2011). Statistical analyses using generalized linear mixed models with a repeated time measurement and a nested cohort pretest-posttest control group design showed that intervention arm patients who were not initially at A1c goal (<7 percent) had a significantly greater improvement in A1c value than control arm patients who were not initially at A1c goal. The A1c change was −0.26 percent in intervention arm (N = 471) versus control (N = 621) at 1-year follow-up (95 percent CI: −0.06 to −0.47 percent; time by condition p = .014). The study did not find statistically significant improvements in blood pressure or lipids. Although there was a greater proportion of patients at goal for blood pressure in the intervention group (the percent of patients with systolic BP <130 mmHg was 80.2 percent in the intervention group versus 75.1 percent in the control group, p = .03), there was virtually no difference in mean blood pressure (130.5 mmHg versus 131.5 mmHg, p = .56). Therefore, we modeled only the 0.26 percent improvement in A1c.
Simulation Model
Long-term projections were made using a simulation model designed to evaluate the long-term health outcomes and economic consequences of interventions among patients with type 2 diabetes (Clarke et al. 2004). The United Kingdom Prospective Diabetes Study (UKPDS) Outcomes Model employs an integrated system of parametric equations to estimate the absolute risk of the first occurrence of each of seven diabetes-related complications (fatal or non-fatal myocardial infarction, other ischemic heart disease, stroke, heart failure, amputation, renal failure, and eye disease) and death based on patient characteristics (e.g., age and gender) and time-varying risk factors (A1c, systolic BP, cholesterol, smoking status). Data from the UKPDS study were used to develop the predictive equations for diabetes-related complications, mortality, as well as progressive time paths for the risk factors, and to assign utilities conditional on disease state. In this study, change in clinical outcomes and costs that were observed in the RCT were used as inputs into the UKPDS Outcomes Model, which was then used to evaluate changes in life expectancy, quality-adjusted life expectancy, lifetime costs, and cost-effectiveness of EMR-based CDS.
Patient Cohort
A patient cohort was derived from the RCT. This cohort included 1,092 study participations that were randomized to either the intervention or control arm and who had an A1c value above recommended clinical goal (<7 percent) at baseline. The RCT was clinic randomized, which resulted in some differences in population characteristics among intervention and control arms. The goal of this analysis is to estimate the cost-effectiveness of the intervention as implemented more generally, and therefore patients in both the intervention and control arms were included in the study cohort. Those with A1c <7 were slightly older than those with an A1c of 7 percent or higher (58.5 versus 56.2, p < .001).
RCT data are used to assign demographics and risk factors at baseline. The UKPDS Outcomes Model requests the duration of diabetes as well as risk factor values at diagnosis of diabetes. Since these data were unknown, we estimated the duration of diabetes to be 12 years, based on a previous study we conducted in this population (Gilmer et al. 2005), and employed baseline RCT values as risk factors at diagnosis. The UKPDS software estimates progressive time paths for the time-varying risk factors. These time paths were used to model usual care. The clinical effect of EMR-based CDS was modeled by reducing A1c by 0.26 percent for each study participant at each annual time point. The remaining risk profiles were left unchanged.
Intervention Costs
Intervention costs were derived from the RCT and were estimated from the health system perspective. Intervention costs included implementation and maintenance costs, intervention training and incentive costs, and the incremental health care costs associated with the intervention. These costs were calculated as long-term average costs of implementation and exclude research and development costs. The cost estimates assume that the decision support intervention is implemented in a relatively large health plan with an EMR that accommodates programmable clinical algorithms. Implementation of the intervention in settings without a full functionality EMR would likely incur additional costs.
Implementation and maintenance costs included programmer and physician time for development and maintenance of the EMR algorithms. These costs were estimated from the actual expenses of updating and transferring the Diabetes Wizard from the research environment into the EPIC systems production for dissemination to all HealthPartners clinics. These costs were expected to persist since the algorithms would be updated each year to account for changes in medical practice and technology (e.g., emerging pharmacotherapies).
Intervention training and incentive costs included training materials, the time of the trainers and the staff participating in the training, and incentives for physicians to use the EMR algorithms. These costs were estimated using the study's accounting data. Training material and time costs were incurred in the first year of the intervention. However, use of the Diabetes Wizard declined by approximately 50 percent after the incentives and feedback associated with the RCT were discontinued. Thus, to model a real-world situation where the tool continued to be used and the clinical improvements were maintained, the incentives for physicians to use the EMR-based CDS were assumed to continue at 50 percent of their initial value.
The RCT was not powered to precisely determine the incremental health care costs associated with the intervention. Three approaches were pursued to provide a range of cost estimates. These approaches were supplemented by detailed analysis of outpatient utilization and pharmacotherapy. In the most broad definition, incremental health care costs associated with the intervention included additional costs for outpatient services and pharmaceuticals experienced by the intervention group. A more targeted definition included only pharmacy costs associated with glycemic control, since an improvement in glycemic control is the only clinical improvement modeled in the intervention. Finally, micro costing was used to estimate pharmacy costs based on observed changing patterns in pharmaceutical fills.
Incremental health care costs were assigned using a resource-based method previously developed to assign costs to encounter data (Gilmer et al. 2005, 2006). Costs for outpatient services were based on relative value units (RVUs). Each service was assigned an RVU based on the procedure code recorded, and RVUs were priced at the 2009 physician services conversion factor: $38.1. Costs of pharmaceuticals were based on the amount that HealthPartners paid plus any member liability.
Incremental health care utilization and costs were estimated using standard health econometric methods. Outpatient and pharmacy costs were estimated using generalized linear models (GLMs) assuming a gamma distribution and a log link function. Outpatient visits, labs, and pharmaceutical fills were estimated using negative binomial regression, and type of pharmacotherapy was estimated using logistic regression. These specifications were chosen based on standard tests for assessing alternative GLMs and transformed models (Blough, Madden, and Hornbrook 1999; Manning and Mullahy 2001). These models included a term for study arm, time (baseline or post-intervention), and a time by study arm interaction term, age, and gender. A standardized estimate of the effect of the intervention on utilization or costs was calculated as the mean difference among all study participants as they were alternatively assigned to the intervention and control group in the post period. Standard errors were estimated using the nonparametric bootstrap and significance values were computed using the percentile method (Efron 1993).
Costs of Diabetes Complications
Costs of diabetes-related complications were estimated using Symmetry Episode Treatment Group (ETG) software applied to HealthPartners' cost accounting system (INGENIX 2007). ETG is an illness classification methodology that organizes medical and pharmaceutical claims into meaningful episodes of care. The ETG software was used to calculate annual costs for diabetes-related complications among adults with diabetes in 2009. Adults were identified as having diabetes if they received one or more inpatient or two or more outpatient diagnoses of diabetes within 1 year using International Classification of Diseases Version 9 (ICD9) diagnoses codes 250–250.99. Diabetes-related complications included myocardial infarction, other ischemic heart disease, heart failure, stroke amputation, blindness, and renal failure. Annual costs were also estimated for adults with diabetes but without complications.
The simulation model includes both event costs—annual costs in the year in which a diabetes-related complication occurs—as well as state costs—costs in the following years for those who experience an event. The model further distinguishes between events that were fatal versus non-fatal. Although the ETG approach is sufficient for estimating costs of diabetes complications in the year in which they occur, it does not provide information on costs during the following years. There were also insufficient deaths among HealthPartners members to estimate the costs of fatal events. Therefore, a national-level dataset was used to estimate adjustment factors that could be applied to event costs to estimate state costs and costs of fatal events.
Adjustment factors for cost for fatal and non-fatal diabetes-related events, and state costs for diabetes-related complications were estimated following the regression methods outlined by Clarke et al. (2008), using a nationally representative dataset of U.S. Medicaid programs: the Medicaid Analytical Extract (MAX) data system (Center for Medicare and Medicaid Services 2011). The MAX data included eligibility and claims data for all Medicaid beneficiaries in the United States plus the District of Columbia from 2001 to 2005. Adults with diabetes were identified using ICD9 codes as described above. Costs were estimated using the amounts paid by Medicaid programs for services typically covered by a health plan: inpatient, physician, clinic, outpatient hospital, mental health, pharmacy, laboratory and radiology, home health, dental, other providers, and durable medical equipment. Indicator variables were created for the first occurrence of each diabetes-related complication; a second set of variables was created to indicate the presence of complications in following years; and a third set of variables indicated a fatal complication. A complication was considered fatal if it occurred in the final month of Medicaid eligibility. A random effects regression was used to estimate the effects of diabetes-related complications on acute health care costs. Due to the large sample size, a Gaussian distribution was assumed for both the individual error and the random effects.
The resulting estimates were used to calculate two sets of cost ratios: the ratio of costs of fatal to non-fatal events and the ratio of state costs to non-fatal event costs. These ratios were calculated for each diabetes-related complication. These ratios were then applied to the non-fatal event costs estimated from HealthPartners data to provide estimates of fatal event costs and state costs in the HealthPartners Medical Group.
Base Case and Sensitivity Analyses
This cost-effectiveness analysis assumed a health system perspective, a 40-year time horizon, and a 3 percent discount rate for both QALYs and costs. This analysis used as inputs the effect of EMR-based decision support on A1c that was observed in the RCT, intervention costs estimated from the RCT, and costs of diabetes-related complications estimated from health plan data. The base case assumed that the intervention effect would persist over time. This assumption seems reasonable since the effects of the medication changes that drive the clinical improvements should continue to exist. Sensitivity analyses were performed to investigate influence of the treatment effects and intervention costs. Sensitivity analyses considered alternatives in which ongoing intervention training and full physician incentive costs were required to maintain the observed improvement in A1c, where physician incentives were not required to achieve and maintain the improvement in A1c, and in which the observed improvement in A1c diminished over time.
An additional sensitivity analysis considered second-order uncertainty. The UKPDS Outcomes Model provides a full set of equation parameters that were derived from bootstrap samples of the original UKPDS trial population. A total of 1,000 bootstrapped estimates were created by drawing from the available set of model parameters. These estimates were used to calculate estimates of incremental costs and effects, which were plotted in a cost-effectiveness plane.
Results
The study sample population characteristics are shown in Table 1. The mean age was 56.2 (SD = 10.6), 49 percent were women, and 81 percent were white. Baseline A1c ranged from 7 percent to 14.8 percent. There were no statistically significant differences in demographics or clinical indicators between the intervention and control groups.
Table 1.
Population Characteristics (N = 1,092)
| Mean | SD | |
|---|---|---|
| Age | 56.2 | 10.6 |
| Female (%) | 49 | |
| White race (%) | 81 | |
| African American (%) | 15 | |
| Asian (%) | 4 | |
| Height/weight | ||
| Height (inches) | 65.9 | 5.9 |
| Weight (pounds) | 208.1 | 53.1 |
| Clinical indicators | ||
| A1c | 8.4 | 1.5 |
| Systolic BP | 125.7 | 16.5 |
| LDL | 94.9 | 34.5 |
| HDL | 45.0 | 12.7 |
| Triglycerides | 165.0 | 99.3 |
| Past smoker (%) | 18 | |
| Current smoker (%) | 38 | |
BP, blood pressure; HDL, high-density lipoprotein; LDL, low-density lipoprotein.
There were no statistically significant differences in outpatient visits or pharmaceutical fills in the intervention or control groups between the pre and post periods (see Appendix Table 1). Both groups saw similar increases in the number of laboratory tests performed; however, the difference in these estimates was not statistically significant.
The analysis of pharmacotherapy considered the main types of pharmacotherapy for persons with diabetes: insulin, sulfonylureas, metformin, thiazolidinediones, and Exenatide (see Appendix Table 2). There were no statistically significant differences in the use of insulin, sulfonylureas, or metformin. However, among users of sulfonylureas, high-dose pharmaceutical fills (proxied by pill size) increased in the intervention group in the post period: the adjusted odd ratio (OR) on the time by study arm interaction term was 1.38 (SE = 0.17). Use of thiazolidinediones increased (OR = 1.56, SE = 0.37), while the use of Exenatide decreased in the intervention group in the post period (OR = 0.40, SE = 0.19). These results are consistent with the algorithms of the Diabetes Wizard, which suggested increasing the dose of an existing sulfonylurea and adding a thiazolidinedione as strategies to intensify glycemic control. Notably, the Diabetes Wizard discouraged use of Exenatide among users of insulin where it is contraindicated.
Intervention costs are shown in Table 2. Intervention implementation and maintenance costs were estimated from the actual costs incurred to transfer the Diabetes Wizard from the research environment into general production in the EPIC system. These costs included 10 percent of a programmer's time and 5 percent of a physician's time over a 6-month period, and totaled $19,300 including benefits and overhead. As of November 2011, there were 14,054 eligible patients with type 2 diabetes in the medical group's registry (i.e., patients age 18–75 with two or more office visits with a diabetes diagnosis in the last 24 months and at least one office visit for any reason in the last 12 months). Of those, 4,086 (28.4 percent) were not meeting the A1c goal of 7 percent. Therefore, the per capita costs of implementation and maintenance of the EMR-based CDS were estimated to be $5.
Table 2.
Intervention Costs
| Year 1 | Years 2+ | |
|---|---|---|
| Intervention implementation and maintenance costs | ||
| Programming time | 9,900 | 9,900 |
| Physician time | 9,400 | 9,400 |
| Subtotal | 19,300 | 19,300 |
| Per capita subtotal | 5 | 5 |
| Intervention training and incentive costs | ||
| Training material preparation | 1,000 | 0 |
| Physician trainer time | 600 | 0 |
| Meal expenses for lunch time training | 600 | 0 |
| Clinic reimbursement for staff time | 3,000 | 0 |
| Physician incentives | 30,400 | 15,200 |
| Subtotal | 35,600 | 15,200 |
| Per capita subtotal | 76 | 32 |
| Incremental health care costs, mean (SE) | ||
| Scenario 1: Outpatient +RX | 102 (189) | 102 (189) |
| Scenario 2: Targeted RX | 24 (95) | 24 (95) |
| Scenario 3: Micro costing RX (base case) | 39 (45) | 39 (45) |
| Per capita total intervention costs | ||
| Scenario 1: Outpatient +RX | 183 (189) | 183 (189) |
| Scenario 2: Targeted RX | 105 (95) | 105 (95) |
| Scenario 3: Micro costing RX (base case) | 120 (45) | 120 (45) |
Note. Costs are in 2009 dollars.
Training and incentive costs per patient participant were estimated from the cost accounting of the RCT to be $35,600, in the first year, and were assumed to be $15,200 in the following years. The per capita subtotal cost was calculated by dividing the subtotal intervention costs by the number of individuals who received the A1c intervention (N = 471).
In the broad definition, incremental outpatient health care costs were estimated to be $56 (SE = $62) lower in the intervention group, and incremental pharmaceutical costs were $159 (SE = $199) higher in the intervention group; the net incremental health care cost associated with the intervention was estimated to be $102 (SE = $189). In the more targeted definition, the incremental cost of endocrine and metabolic drugs, plus miscellaneous supplies related to glucose monitoring, was $24 (SE = 95). Micro costing the observed increase in dose of sulfonylureas, increased use of thiazolidinediones, and reduced use of Exenatide resulted in a cost estimate of $39 (SE = $45).
Total per capita costs were estimated to be $183 in the first year and $139 in following years using the broad definition of cost; $105 and $61 using the targeted definition, and $120 and $76 using micro costing. The results from the micro costing approach are used as the base case analysis. Using a broad definition of costs would include outpatient cost savings that are not supported by the analyses of outpatient utilization, as well as additional costs for pharmaceuticals that were not targeted in the EMR-based CDS and that potential benefits of which were not modeled in the simulation. The targeted and micro costing approaches provide similar results; however, the micro costing approach is more precise.
Costs of diabetes-related complications are shown in Table 3. Costs were greater for fatal than for non-fatal events, and event costs were greater than state costs. The annual cost of health care without diabetes-related complications was $1,499.
Table 3.
Costs of Complications Used as Inputs to the UKPDS Outcomes Model
| Fatal* | Non-fatal, Initial* | Non-fatal, State** | |
|---|---|---|---|
| Ischemic heart disease | 24,622 | 8,052 | |
| Myocardial infarction | 39,517 | 36,709 | 10,304 |
| Heart failure | 30,445 | 17,290 | 11,863 |
| Stroke | 15,735 | 11,176 | 4,070 |
| Amputation | 62,378 | 47,955 | 12,239 |
| Blindness | 4,341 | 2,258 | |
| Renal failure | 89,614 | 89,614 | 89,614 |
| Annual costs without complications | 1,499 |
Note. Costs are annual amounts in 2009 dollars.
Costs in year of event.
Costs per subsequent year.
UKPDS, United Kingdom Prospective Diabetes Study.
The results of the cost-effectiveness analyses are shown in Table 4. In the base case analysis using micro costing, EMR-based CDS increased lifetime QALYs by 0.04 (SE = 0.01) and increased lifetime costs by $111 (SE = $660). The incremental cost-effectiveness ratio (ICER) was $3,017 per QALY. Using the broad definition of health care costs, the EMR-based CDS increased lifetime costs by $802 (SE = $2,561) and the ICER was $21,690 per QALY. Using the targeted definition, lifetime costs decreased by $−53 (SE = 1,307). Improvements in quality of life in the intervention arm were the result of projected declines in the probabilities of stroke (0.1 percent), ischemic heart disease (0.2 percent), renal failure (0.4 percent), and all cause death (1.7 percent) over the 40-year period.
Table 4.
Cost-Effectiveness of EMR-Based Clinical Decision Support
| Total Costs | Remaining Life Years | QALYs | CE Ratio ($/QALY) | |
|---|---|---|---|---|
| Scenario 1: All outpatient and pharmacy costs | ||||
| Usual care | $51,592 | 13.45 | 10.28 | |
| EMR support | $52,395 | 13.48 | 10.32 | $21,690 |
| Scenario 2: Targeted pharmacy costs | ||||
| Usual care | $51,592 | 13.45 | 10.28 | |
| EMR support | $51,540 | 13.48 | 10.32 | Dominant |
| Scenario 3: Micro costing pharmacy costs (base case) | ||||
| Usual care | $51,592 | 13.45 | 10.28 | |
| EMR support | $51,705 | 13.48 | 10.32 | $3,017 |
| One-way sensitivity analyses | ||||
| Ongoing training costs | ||||
| Usual care | $51,592 | 13.45 | 10.28 | |
| EMR support | $51,814 | 13.48 | 10.32 | $5,908 |
| Ongoing training and full incentive costs | ||||
| Usual care | $51,592 | 13.45 | 10.28 | |
| EMR support | $52,143 | 13.48 | 10.32 | $14,868 |
| Zero incentive costs | ||||
| Usual care | $51,592 | 13.45 | 10.28 | |
| EMR support | $51,321 | 13.48 | 10.32 | Dominant |
| Intervention effect persists for 2 years | ||||
| Usual care | $51,710 | 13.44 | 10.27 | |
| EMR support | $52,312 | 13.46 | 10.29 | $40,342 |
| Intervention effect persists for 1 year | ||||
| Usual care | $51,726 | 13.44 | 10.27 | |
| EMR support | $52,377 | 13.45 | 10.28 | $56,042 |
| Two-way sensitivity analyses | ||||
| Ongoing training costs and intervention effect persists for 2 years | ||||
| Usual care | $51,710 | 13.44 | 10.27 | |
| EMR support | $52,422 | 13.46 | 10.29 | $47,667 |
| Ongoing training costs and intervention effect persists for 1 year | ||||
| Usual care | $51,726 | 13.44 | 10.27 | |
| EMR support | $52,486 | 13.45 | 10.28 | $65,459 |
| Zero ongoing costs and intervention effect persists for 1 year | ||||
| Usual care | $51,726 | 13.44 | 10.27 | |
| EMR support | $51,557 | 13.45 | 10.28 | Dominant |
Note. Costs, life years, and QALYs are per-capita averages. Costs are in 2009 dollars. In the base case analysis, the intervention effect is −0.26 percent, intervention costs are $120 in the first year and $76 in following years, the time horizon is 40 years, and costs and QALYs are discounted at 3.0 percent per year.
EMR, electronic medical record; QALY, quality-adjusted life years.
In one-way sensitivity analyses using the base case, the ICER increased to $5,908 per QALY if training costs were ongoing. The ICER increased to $14,868 per QALY if both ongoing training and the full physician incentives were required to maintain the intervention. In contrast, if physician incentives were not required to achieve the benefit of EMR-CDS, the intervention was cost saving. The study results were more sensitive to assumed changes in the intervention effects than assumed changes in intervention costs. The ICER increased to $40,342 per QALY when the intervention effect persisted for only 2 years. The ICER increased to $65,459 per QALY when the intervention effect persisted for 1 year.
Two-way sensitivity analyses examined combined adjustments to intervention costs and effects. Assuming ongoing training costs, an intervention with effects that persisted for 2 years would have an ICER of $47,667. An intervention with ongoing training costs and a 1-year effect would have an ICER of $65,459. An intervention that was discontinued after 1 year, with a 1-year effect and without ongoing costs, would be cost saving.
Figure 1 presents results from the analysis of second-order uncertainty. Since all estimated incremental effects are positive, only two quadrants are presented. The angled line indicates the $50,000 per QALY ICER threshold. The median incremental cost is $62 with an interquartile range of $−317 to $435. The median incremental effect is 0.04 QALY with an interquartile range of 0.03–0.05 QALY. The ICER was above $25,000 per QALY in 8 percent of simulations, and above $50,000 per QALY in 1 percent of simulations.
Figure 1.
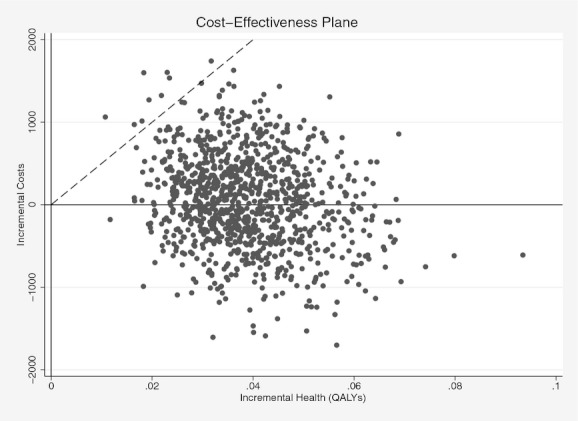
Cost-Effectiveness Plane
Discussion
By 2034, the number of U.S. residents with diagnosed or undiagnosed diabetes is projected to increase to 44.1 million, accompanied by $336 billion in annual diabetes-related medical spending (Huang et al. 2009).2 New strategies are required, both for diabetes screening and prevention (Gilmer and O'Connor 2010), and for improved diabetes care among those with existing diabetes including those who are newly diagnosed. Integrated EMR-based CDS systems have the potential to modestly improve diabetes care for millions of persons who are enrolled in health plans that have deployed EMRs.
The EMR-based CDS studied herein was cost-effective by commonly accepted standards, both in the base case and in multiple sensitivity analyses that describe a range of reasonable assumptions regarding the intervention's costs and effects (Braithwaite et al. 2008). Although the intervention effect was modest, the relatively low cost of the intervention favored a cost-effective outcome. In fact, a main appeal of EMR-based interventions is their potential to improve clinical care over a large population at relatively low cost. The cost of the technology displays these economics of scale. However, use of these tools requires changes in provider behavior, and incentives for provider participation comprised the largest component in the cost of intervention. We note that the intervention was implemented in the context of a research study, and that incentives may become less important if the approach is established as an accepted clinical practice. Future research should consider system-level approaches to changing provider behavior as complementary to implementation of EMR-based CDS.
This cost-effectiveness analysis has several limitations. We employ a simulation model (the UKPDS Outcomes Model) that may not accurately predict the clinical course of diabetes in our population. In particular, the original UKPDS study included recently diagnosed adults with type 2 diabetes. Patients in the RCT were diagnosed with diabetes for just over 10 years, on average. However, the baseline A1c in our study population was similar to that of UKPDS. We assume that the intervention effects and costs persist over time, and we assumed that ongoing training would not be necessary to maintain the intervention effect. Our sensitivity analyses showed that the intervention remained cost-effective when A1c improvements did not persist, and with ongoing training and full incentive costs. The EMR-based CDS studied herein emphasized glucose control and lowered A1c, but it did not significantly improve BP or LDL control. Previous studies show that improvements in BP and lipid control reduce costs more than reductions in A1c (CDC Diabetes Cost-effectiveness Group 2002).
Data from UKPDS, ACCORD, and ADVANCE suggest that the benefits and risks of glucose-lowering therapy depend not only on the level of A1c but also on the treatment strategy used to achieve glucose control (Holman et al. 2008; Gerstein et al. 2008; Patel et al. 2008; Chew et al. 2010; Ismail-Beigi et al. 2010). Yet there are major gaps in our knowledge of the relative long-term safety, clinical effectiveness, and cost-effectiveness of various classes and combinations of glucose-lowering agents and insulin. In an era in which treatment goals need to be tailored to individual patients, and in which particular treatment strategies may reduce microvascular complications while increasing the risk of mortality, both clinical decision making and cost-effectiveness analyses become more complex and challenging. In this brave new world of mixed clinical outcomes, it is unlikely that either clinical trials or cost-effectiveness analyses will identify a single glucose control strategy that is best for all patients with diabetes, and personalized CDS will increase in importance.
Despite some limitations, our analyses clearly demonstrate that an EMR-based CDS system can be implemented at a modest cost. The observed clinical impact is comparable to that achieved by many disease management or patient education programs that are more expensive (Norris et al. 2002a,b,c, 2003; Schmittdiel et al. 2009). EMR-based CDS is scalable, and it can be used in conjunction with additional care improvement strategies. Additional research will help shape our understanding of clinical decisions that could benefit from EMR-based CDS and under what circumstances we can expect it to be cost-effective. In the coming era of personalized medicine, CDS strategies capable of simultaneously standardizing and personalizing clinical care will likely become an essential tool in primary care, and investments to improve the effectiveness of this technology are needed.
Acknowledgments
Joint Acknowledgment/Disclosure Statement: Financial support was provided by NIDDK DK068314, Clinical Trials Registration NCT00272402. We have no conflicts of interests.
Disclosures: None.
Notes
This estimate includes both medical costs and productivity losses resulting from diabetes.
In contrast to the estimates presented in the introduction, the prevalence estimate includes undiagnosed diabetes and the cost estimate excludes productivity-related losses.
SUPPORTING INFORMATION
Additional supporting information may be found in the online version of this article:
Appendix SA1: Author Matrix.
Table S1: Changes in Outpatient and Pharmacy Utilization Associated with EMR-Based Clinical Decision Support: Pre, Post, and Difference Estimates.
Table S2: Changes in Pharmacotherapy Associated with EMR-Based Clinical Decision Support: Difference-in-Difference Estimates.
Please note: Wiley-Blackwell is not responsible for the content or functionality of any supporting materials supplied by the authors. Any queries (other than missing material) should be directed to the corresponding author for the article.
References
- American Diabetes Association. “Economic Costs of Diabetes in the U.S. in 2007”. Diabetes Care. 2008;31(3):1–20. doi: 10.2337/dc08-9017. [DOI] [PubMed] [Google Scholar]
- Balas EA, Krishna S, Kretschmer RA, Cheek TR, Lobach DF, Boren SA. “Computerized Knowledge Management in Diabetes Care”. Medical Care. 2004;42(6):610–21. doi: 10.1097/01.mlr.0000128008.12117.f8. [DOI] [PubMed] [Google Scholar]
- Blough DK, Madden CW, Hornbrook MC. “Modeling Risk Using Generalized Linear Models”. Journal of Health Economics. 1999;18(2):153–71. doi: 10.1016/s0167-6296(98)00032-0. [DOI] [PubMed] [Google Scholar]
- Bolen SD, Bricker E, Samuels TA, Yeh HC, Marinopoulos SS, McGuire M, Abuid M, Brancati FL. “Factors Associated with Intensification of Oral Diabetes Medications in Primary Care Provider-Patient Dyads: A Cohort Study”. Diabetes Care. 2009;32(1):25–31. doi: 10.2337/dc08-1297. [DOI] [PMC free article] [PubMed] [Google Scholar]
- Braithwaite RS, Meltzer DO, King JT, Jr, Leslie D, Roberts MS. “What Does the Value of Modern Medicine Say about the $50,000 Per Quality-Adjusted Life-Year Decision Rule?”. Medical Care. 2008;46(4):349–56. doi: 10.1097/MLR.0b013e31815c31a7. [DOI] [PubMed] [Google Scholar]
- Brown AF, Mangione CM, Saliba D, Sarkisian CA. “Guidelines for Improving the Care of the Older Person with Diabetes Mellitus”. Journal of the American Geriatrics Society. 2003;51(5 Suppl Guidelines):S265–80. doi: 10.1046/j.1532-5415.51.5s.1.x. [DOI] [PubMed] [Google Scholar]
- Bu D, Pan E, Walker J, Adler-Milstein J, Kendrick D, Hook JM, Cusack CM, Bates DW, Middleton B. “Benefits of Information Technology-Enabled Diabetes Management”. Diabetes Care. 2007;30(5):1137–42. doi: 10.2337/dc06-2101. [DOI] [PubMed] [Google Scholar]
- CDC Diabetes Cost-effectiveness Group. “Cost-Effectiveness of Intensive Glycemic Control, Intensified Hypertension Control, and Serum Cholesterol Level Reduction for Type 2 Diabetes. The CDC Diabetes Cost-effectiveness Group”. JAMA. 2002;287(19):2542–51. doi: 10.1001/jama.287.19.2542. [DOI] [PubMed] [Google Scholar]
- Center for Medicare and Medicaid Services. 2011. “Medicaid Analytic eXtract (MAX) General Information” [accessed on May 13, 2011]. Available at http://www.cms.hhs.gov/medicaiddatasourcesgeninfo/07_maxgeneralinformation.asp.
- Charlson ME, Pompei P, Ales KL, MacKenzie CR. “A New Method of Classifying Prognostic Comorbidity in Longitudinal Studies: Development and Validation”. Journal of Chronic Diseases. 1987;40(5):373–83. doi: 10.1016/0021-9681(87)90171-8. [DOI] [PubMed] [Google Scholar]
- Chew EY, Ambrosius WT, Davis MD, Danis RP, Gangaputra S, Greven CM, Hubbard L, Esser BA, Lovato JF, Perdue LH, Goff DC, Jr, Cushman WC, Ginsberg HN, Elam MB, Genuth S, Gerstein HC, Schubart U, Fine LJ. “Effects of Medical Therapies on Retinopathy Progression in Type 2 Diabetes”. New England Journal of Medicine. 2010;363(3):233–44. doi: 10.1056/NEJMoa1001288. [DOI] [PMC free article] [PubMed] [Google Scholar]
- Clarke PM, Gray AM, Briggs A, Farmer AJ, Fenn P, Stevens RJ, Matthews DR, Stratton IM, Holman RR. “A Model to Estimate the Lifetime Health Outcomes of Patients with Type 2 Diabetes: The United Kingdom Prospective Diabetes Study (UKPDS) Outcomes Model (UKPDS no. 68)”. Diabetologia. 2004;47(10):1747–59. doi: 10.1007/s00125-004-1527-z. [DOI] [PubMed] [Google Scholar]
- Clarke P, Leal J, Kelman C, Smith M, Colagiuri S. “Estimating the Cost of Complications of Diabetes in Australia Using Administrative Health-Care Data”. Value in health. 2008;11(2):199–206. doi: 10.1111/j.1524-4733.2007.00228.x. [DOI] [PubMed] [Google Scholar]
- Crosson JC, Stroebel C, Scott JG, Stello B, Crabtree BF. “Implementing an Electronic Medical Record in a Family Medicine Practice: Communication, Decision Making, and Conflict”. Annals of Family Medicine. 2005;3(4):307–11. doi: 10.1370/afm.326. [DOI] [PMC free article] [PubMed] [Google Scholar]
- Dluhy RG, McMahon GT. “Intensive Glycemic Control in the ACCORD and ADVANCE Trials”. New England Journal of Medicine. 2008;358(24):2630–3. doi: 10.1056/NEJMe0804182. [DOI] [PubMed] [Google Scholar]
- Efron B. An Introduction to the Bootstrap. New York: Chapman and Hall; 1993. [Google Scholar]
- Gaede P, Lund-Andersen H, Parving HH, Pedersen O. “Effect of a Multifactorial Intervention on Mortality in Type 2 Diabetes”. New England Journal of Medicine. 2008;358(6):580–91. doi: 10.1056/NEJMoa0706245. [DOI] [PubMed] [Google Scholar]
- Gerstein HC, Miller ME, Byington RP, Goff DC, Jr, Bigger JT, Buse JB, Cushman WC, Genuth S, Ismail-Beigi F, Grimm RH, Jr, Probstfield JL, Simons-Morton DG, Friedewald WT. “Effects of Intensive Glucose Lowering in Type 2 Diabetes”. New England Journal of Medicine. 2008;358(24):2545–59. doi: 10.1056/NEJMoa0802743. [DOI] [PMC free article] [PubMed] [Google Scholar]
- Gilmer TP, O'Connor PJ. “The Growing Importance of Diabetes Screening”. Diabetes Care. 2010;33(7):1695–7. doi: 10.2337/dc10-0855. [DOI] [PMC free article] [PubMed] [Google Scholar]
- Gilmer TP, O'Connor PJ, Rush WA, Crain AL, Whitebird RR, Hanson AM, Solberg LI. “Predictors of Health Care Costs in Adults with Diabetes”. Diabetes Care. 2005;28(1):59–64. doi: 10.2337/diacare.28.1.59. [DOI] [PubMed] [Google Scholar]
- Gilmer TP, O'Connor PJ, Rush WA, Crain AL, Whitebird RR, Hanson AM, Solberg LI. “Impact of Office Systems and Improvement Strategies on Costs of Care for Adults with Diabetes”. Diabetes Care. 2006;29(6):1242–8. doi: 10.2337/dc05-1811. [DOI] [PubMed] [Google Scholar]
- Grant RW, Wald JS, Schnipper JL, Gandhi TK, Poon EG, Orav EJ, Williams DH, Volk LA, Middleton B. “Practice-Linked Online Personal Health Records for Type 2 Diabetes Mellitus: A Randomized Controlled Trial”. Archives of Internal Medicine. 2008;168(16):1776–82. doi: 10.1001/archinte.168.16.1776. [DOI] [PMC free article] [PubMed] [Google Scholar]
- Hoerger TJ, Segel JE, Gregg EW, Saaddine JB. “Is Glycemic Control Improving in U.S. Adults?”. Diabetes Care. 2008;31(1):81–6. doi: 10.2337/dc07-1572. [DOI] [PubMed] [Google Scholar]
- Holman RR, Paul SK, Bethel MA, Matthews DR, Neil HA. “10-Year Follow-Up of Intensive Glucose Control in Type 2 Diabetes”. New England Journal of Medicine. 2008;359(15):1577–89. doi: 10.1056/NEJMoa0806470. [DOI] [PubMed] [Google Scholar]
- Huang ES, Basu A, O'Grady M, Capretta JC. “Projecting the Future Diabetes Population Size and Related Costs for the U.S”. Diabetes Care. 2009;32(12):2225–9. doi: 10.2337/dc09-0459. [DOI] [PMC free article] [PubMed] [Google Scholar]
- INGENIX. 2007. “Symmetry Episode Treatment Groups: Issues and BEst Practices in Physician Episode Attribution” [accessed on August 23, 2011]. Available at http://www.ingenix.com/content/attachments/Symmetry_EpisodeAttribution_WP_FINAL_112007.pdf.
- Institute for Clinical Systems Improvement. 2009. “Diagnosis and Management of Type 2 Diabetes Mellitus in Adults” [accessed on August 23, 2011]. Available at http://www.icsi.org/diabetes_mellitus__type_2/management_of_type_2_diabetes_mellitus__9.html.
- Ismail-Beigi F, Craven T, Banerji MA, Basile J, Calles J, Cohen RM, Cuddihy R, Cushman WC, Genuth S, Grimm RH, Jr, Hamilton BP, Hoogwerf B, Karl D, Katz L, Krikorian A, O'Connor P, Pop-Busui R, Schubart U, Simmons D, Taylor H, Thomas A, Weiss D, Hramiak I. “Effect of Intensive Treatment of Hyperglycaemia on Microvascular Outcomes in Type 2 Diabetes: An Analysis of the ACCORD Randomised Trial”. Lancet. 2010;376(9739):419–30. doi: 10.1016/S0140-6736(10)60576-4. [DOI] [PMC free article] [PubMed] [Google Scholar]
- de Jaegher K, Jegers M. “The Physician-Patient Relationship as a Game of Strategic Information Transmission”. Health Economics. 2001;10(7):651–68. doi: 10.1002/hec.603. [DOI] [PubMed] [Google Scholar]
- Karter AJ, Parker MM, Moffet HH, Ahmed AT, Schmittdiel JA, Selby JV. “New Prescription Medication Gaps: A Comprehensive Measure of Adherence to New Prescriptions”. Health Services Research. 2009;44(5 Pt 1):1640–61. doi: 10.1111/j.1475-6773.2009.00989.x. [DOI] [PMC free article] [PubMed] [Google Scholar]
- Manning WG, Mullahy J. “Estimating Log Models: To Transform or Not to Transform?”. Journal of Health Economics. 2001;20(4):461–94. doi: 10.1016/s0167-6296(01)00086-8. [DOI] [PubMed] [Google Scholar]
- McEwen LN, Bilik D, Johnson SL, Halter JB, Karter AJ, Mangione CM, Subramanian U, Waitzfelder B, Crosson JC, Herman WH. “Predictors and Impact of Intensification of Antihyperglycemic Therapy in Type 2 Diabetes: Translating Research into Action for Diabetes (TRIAD)”. Diabetes Care. 2009;32(6):971–6. doi: 10.2337/dc08-1911. [DOI] [PMC free article] [PubMed] [Google Scholar]
- Meigs JB, Cagliero E, Dubey A, Murphy-Sheehy P, Gildesgame C, Chueh H, Barry MJ, Singer DE, Nathan DM. “A Controlled Trial of Web-Based Diabetes Disease Management: The MGH Diabetes Primary Care Improvement Project”. Diabetes Care. 2003;26(3):750–7. doi: 10.2337/diacare.26.3.750. [DOI] [PubMed] [Google Scholar]
- Montgomery AA, Fahey T. “A Systematic Review of the Use of Computers in the Management of Hypertension”. Journal of Epidemiology and Community Health. 1998;52(8):520–5. doi: 10.1136/jech.52.8.520. [DOI] [PMC free article] [PubMed] [Google Scholar]
- Montori VM, Dinneen SF, Gorman CA, Zimmerman BR, Rizza RA, Bjornsen SS, Green EM, Bryant SC, Smith SA. “The Impact of Planned Care and a Diabetes Electronic Management System on Community-Based Diabetes Care: The Mayo Health System Diabetes Translation Project”. Diabetes Care. 2002;25(11):1952–7. doi: 10.2337/diacare.25.11.1952. [DOI] [PubMed] [Google Scholar]
- Murray MD, Harris LE, Overhage JM, Zhou XH, Eckert GJ, Smith FE, Buchanan NN, Wolinsky FD, McDonald CJ, Tierney WM. “Failure of Computerized Treatment Suggestions to Improve Health Outcomes of Outpatients with Uncomplicated Hypertension: Results of a Randomized Controlled Trial”. Pharmacotherapy. 2004;24(3):324–37. doi: 10.1592/phco.24.4.324.33173. [DOI] [PubMed] [Google Scholar]
- Narayan KM, Boyle JP, Thompson TJ, Sorensen SW, Williamson DF. “Lifetime Risk for Diabetes Mellitus in the United States”. JAMA. 2003;290(14):1884–90. doi: 10.1001/jama.290.14.1884. [DOI] [PubMed] [Google Scholar]
- Norris SL, Nichols PJ, Caspersen CJ, Glasgow RE, Engelgau MM, Jack L, Snyder SR, Carande-Kulis VG, Isham G, Garfield S, Briss P, McCulloch D. “Increasing Diabetes Self-Management Education in Community Settings. A Systematic Review”. American Journal of Preventive Medicine. 2002a;22(4 Suppl 1):39–66. doi: 10.1016/s0749-3797(02)00424-5. [DOI] [PubMed] [Google Scholar]
- Norris SL, Lau J, Smith SJ, Schmid CH, Engelgau MM. “Self-Management Education for Adults with Type 2 Diabetes: A Meta-Analysis of the Effect on Glycemic Control”. Diabetes Care. 2002b;25(7):1159–71. doi: 10.2337/diacare.25.7.1159. [DOI] [PubMed] [Google Scholar]
- Norris SL, Nichols PJ, Caspersen CJ, Glasgow RE, Engelgau MM, Jack L, Isham G, Snyder SR, Carande-Kulis VG, Garfield S, Briss P, McCulloch D. “The Effectiveness of Disease and Case Management for People with Diabetes. A Systematic Review”. American Journal of Preventive Medicine. 2002c;22(4 Suppl):15–38. doi: 10.1016/s0749-3797(02)00423-3. [DOI] [PubMed] [Google Scholar]
- Norris SL, Glasglow RE, Engelgau MM, O'Connor PJ, McCulloch D. “Chronic Disease Management: A Definition and Systematic Approach to Component Interventions”. Disease Management and Health Outcomes. 2003;11(8):477–88. [Google Scholar]
- O'Connor P, Sperl-Hillen J. “Treatment of Type 2 Diabetes. Online Point of Care Clinical Decision Support Tool Marketed as Part of BMJ Point of Care. Concise and Practical Information on Etiology, Epidemiology, and Clinical Management of Type 2 Diabetes”. BMJ. 2008 [accessed on April 27, 2012]. Available at: https://online.epocrates.com/u/291124/Type+2+diabetes+mellitus. [Google Scholar]
- O'Connor PJ, Crain AL, Rush WA, Sperl-Hillen JM, Gutenkauf JJ, Duncan JE. “Impact of an Electronic Medical Record on Diabetes Quality of Care”. Annals of Family Medicine. 2005;3(4):300–6. doi: 10.1370/afm.327. [DOI] [PMC free article] [PubMed] [Google Scholar]
- O'Connor PJ, Sperl-Hillen JM, Rush WA, Johnson PE, Amundson GH, Asche SE, Ekstrom HL, Gilmer TP. “Impact of Electronic Health Record Clinical Decision Support on Diabetes Care: A Randomized Trial”. Annals of Family Medicine. 2011;9(1):12–21. doi: 10.1370/afm.1196. [DOI] [PMC free article] [PubMed] [Google Scholar]
- Parchman ML, Pugh JA, Romero RL, Bowers KW. “Competing Demands or Clinical Inertia: The Case of Elevated Glycosylated Hemoglobin”. Annals of Family Medicine. 2007;5(3):196–201. doi: 10.1370/afm.679. [DOI] [PMC free article] [PubMed] [Google Scholar]
- Patel A, MacMahon S, Chalmers J, Neal B, Woodward M, Billot L, Harrap S, Poulter N, Marre M, Cooper M, Glasziou P, Grobbee DE, Hamet P, Heller S, Liu LS, Mancia G, Mogensen CE, Pan CY, Rodgers A, Williams B. “Effects of a Fixed Combination of Perindopril and Indapamide on Macrovascular and Microvascular Outcomes in Patients with Type 2 Diabetes Mellitus (The ADVANCE Trial): A Randomised Controlled Trial”. Lancet. 2007;370(9590):829–40. doi: 10.1016/S0140-6736(07)61303-8. [DOI] [PubMed] [Google Scholar]
- Patel A, MacMahon S, Chalmers J, Neal B, Billot L, Woodward M, Marre M, Cooper M, Glasziou P, Grobbee D, Hamet P, Harrap S, Heller S, Liu L, Mancia G, Mogensen CE, Pan C, Poulter N, Rodgers A, Williams B, Bompoint S, de Galan BE, Joshi R, Travert F. “Intensive Blood Glucose Control and Vascular Outcomes in Patients with Type 2 Diabetes”. New England Journal of Medicine. 2008;358(24):2560–72. doi: 10.1056/NEJMoa0802987. [DOI] [PubMed] [Google Scholar]
- Peterson KA, Radosevich DM, O'Connor PJ, Nyman JA, Prineas RJ, Smith SA, Arneson TJ, Corbett VA, Weinhandl JC, Lange CJ, Hannan PJ. “Improving Diabetes in Practice: Findings from the TRANSLATE Trial”. Diabetes Care. 2008;(12):2238–43. doi: 10.2337/dc08-2034. [DOI] [PMC free article] [PubMed] [Google Scholar]
- Piette JD, Weinberger M, Kraemer FB, McPhee SJ. “Impact of Automated Calls with Nurse Follow-Up on Diabetes Treatment Outcomes in a Department of Veterans Affairs Health Care System: A Randomized Controlled Trial”. Diabetes Care. 2001;24(2):202–8. doi: 10.2337/diacare.24.2.202. [DOI] [PubMed] [Google Scholar]
- Saydah SH, Fradkin J, Cowie CC. “Poor Control of Risk Factors for Vascular Disease among Adults with Previously Diagnosed Diabetes”. JAMA. 2004;291(3):335–42. doi: 10.1001/jama.291.3.335. [DOI] [PubMed] [Google Scholar]
- Schmittdiel JA, Uratsu CS, Fireman BH, Selby JV. “The Effectiveness of Diabetes Care Management in Managed Care”. The American Journal of Managed Care. 2009;15(5):295–301. [PubMed] [Google Scholar]
- Tierney WM, Overhage JM, Murray MD, Harris LE, Zhou XH, Eckert GJ, Smith FE, Nienaber N, McDonald CJ, Wolinsky FD. “Effects of Computerized Guidelines for Managing Heart Disease in Primary Care”. Journal of General Internal Medicine. 2003;18(12):967–76. doi: 10.1111/j.1525-1497.2003.30635.x. [DOI] [PMC free article] [PubMed] [Google Scholar]
- Von Korff M, Gruman J, Schaefer J, Curry SJ, Wagner EH. “Collaborative Management of Chronic Illness”. Annals of Internal Medicine. 1997;127(12):1097–102. doi: 10.7326/0003-4819-127-12-199712150-00008. [DOI] [PubMed] [Google Scholar]
- Wagner EH. “Chronic Disease Management: What Will It Take to Improve Care for Chronic Illness?”. Effective Clinical Practice. 1998;1(1):2–4. [PubMed] [Google Scholar]
- Ziemer DC, Doyle JP, Barnes CS, Branch WT, Jr, Cook CB, El-Kebbi IM, Gallina DL, Kolm P, Rhee MK, Phillips LS. “An Intervention to Overcome Clinical Inertia and Improve Diabetes Mellitus Control in a Primary Care Setting: Improving Primary Care of African Americans with Diabetes (IPCAAD) 8”. Archives of Internal Medicine. 2006;166(5):507–13. doi: 10.1001/archinte.166.5.507. [DOI] [PubMed] [Google Scholar]
Associated Data
This section collects any data citations, data availability statements, or supplementary materials included in this article.