

Abstract
Nanomaterials increasingly are playing a role in society for uses ranging from biomedicine to microelectronics; however pharmacokinetic studies, which will be necessary for human health risk assessments, are limited. Currently the most widely used nanoparticle in consumer products is silver (Ag). The objective of this study was to quantify the local biodistribution of two types of Ag nanoparticles, Ag-citrate and Ag-silica, in the isolated perfused porcine skin flap (IPPSF). IPPSFs were perfused for 4 h with 0.84 μg/ml Ag-citrate or 0.48 μg/ml Ag-silica followed by a 4-h perfusion with media only during a washout phase. Arterial and venous concentrations of Ag were measured in the media by ICP-OES. Venous concentrations of Ag for both types of nanoparticles were best fit with a two compartment model. The normalized volumes of distribution estimated from the noncompartmental analysis of the venous concentrations indicated distribution of Ag greater than the vascular space, however, because total Ag was measured, the extravascular distribution could be attributed to diffusion of Ag ions. The estimated clearance for both types of Ag nanoparticles was 1 ml/min, which was equal to the flap perfusion rate, indicating no detectable elimination of Ag from the system. By 4 hrs following infusion of the Ag nanoparticles, the recovery of Ag in the venous effluent was 90 ± 5.0% and 87 ± 22 % of the infused Ag for Ag-citrate and Ag-silica, respectively.
Keywords: Silver nanoparticles, Biodistribution, skin
INTRODUCTION
Nanoparticles are playing an increasingly important role in society through a variety of applications ranging from electronics to medicine. Largely due to its antimicrobial properties, silver (Ag) is currently the most widely used nanoparticle in consumer products and can be found in textiles, medical devices, contraceptives, water disinfectants, and room sprays, (Woodrow Wilson International Center for Scholars, 2011). Because of the widespread use of Ag nanoparticles and thus potential intentional and accidental exposure (Chen and Schluesener, 2008) the health risks of Ag nanoparticles need to be assessed, particularly the dose-response relationship. As with exposure to other chemicals in the environment, the pharmacokinetics of nanoparticles will be important for correlating dose with target tissue concentration and potential adverse event (Hagens et al, 2007; Riviere, 2009).
There have been several studies investigating in vivo pharmacokinetics of Ag nanoparticles in rodents (Kim et al., 2008; Kim et al., 2010; Garza-Ocanas et al., 2010, Park et al., 2010). Garza-Ocanas et al. (2010) studied BSA-coated Ag nanoparticles (core diameter 2 nm) deposition in rats after intraperitoneal injection. The highest concentration of Ag after exposure was found in reticuloendothelial tissues, and intact nanoparticles were detected in tissues images analyzed by TEM and STEM. Garza-Ocanas et al. detected Ag, but not intact nanoparticles, in the brain. Kim et al. (2008) exposed male and female Sprague-Dawley rats for 28 days by oral gavage to 30, 300 or 1000 mg/kg Ag nanoparticles (diameter range 52.7–70.9 nm) and detected Ag in all tissues following exposure. In a subchronic study with male and female mice exposed to Ag nanoparticles (diameter 60 nm by TEM) by oral gavage for 90 days to 30, 125 and 500 mg/kg, Ag was again detectable in all tissues sampled at the end of the 90 day exposure, and the tissue concentration increased nonlinearly with dose (Kim et al., 2010).
In addition, several studies have reported plasma concentrations of Ag in humans following medical treatment of wounds with Ag (Trop et a., 2006) or ingestion of Ag colloids (Bowden et al., 2011). Trop et al. (2006) studied the disposition of Ag in humans who were being treated with Ag-coated wound dressings. Agryia was noted in patients, as well as an increase in liver enzymes in serum. Whether the effects are the result of Ag nanoparticles gaining access to the systemic circulation and distributing to other regions or from dissolution of Ag ions from the nanoparticles is not known.
There have been several studies investigating the in vitro cellular uptake or in vivo pharmacokinetics and have demonstrated differences in uptake and distribution for Ag nanoparticles with different physicochemical properties including size, shape, and charge (Croteau et al., 2011; Farkas et al, 2011; Lankveld et al., 2010). Croteau et al. (2011) reported differences in the bioaccumulation of Ag in the invertebrate Lymnaea stagnalis (the great pond snail) exposed to dissolved AgNO3 versus Ag-citrate or humic-acid-coated Ag nanoparticles. Farkas et al. (2011) studied Ag uptake into cultured gill cells exposed to AgNO3, Ag-citrate or polyvinyl pyrrolidone (PVP)-coated Ag nanoparticles. While ionic Ag had the greatest uptake, the uptake of Ag-citrate was greater than the PVP-coated Ag nanoparticles despite PVP particles displaying greater transmembrane diffusion. Lankveld et al. (2010) looked at the distribution of 3 sizes of Ag nanoparticles (20, 80, and 100 nm) in rats after intravenous injection. For 80 and 100 nm Ag nanoparticles the predominant sites of accumulation were liver, lungs, and spleen, while the 20 nm did not accumulate. Since all studies have measured total Ag in the tissues and media, the portion of the uptake and distribution due to intact nanoparticles versus Ag ions is currently not known.
There have been recent efforts to develop physiologically based pharmacokinetic (PBPK) models for nanoparticles, which will be useful tools for predicting nanoparticle distribution to assist with extrapolation of responses from in vitro and in vivo. Preliminary work has been published for quantum dots (Lee et al., 2009; Lin et al., 2008) and Ag (Lankveld et al., 2010). One of the issues in the development of the models is the need to accurately describe the distribution of the nanoparticles in the tissues, as the blood-flow limited model most commonly used for chemicals (International Programme on Chemical Safety, 2010) will not be appropriate for nanoparticles (Lee et al., 2009; Lin et al., 2008; Lankveld et al., 2010). For the Ag PBPK model Lankveld et al. (2010) described uptake into tissues as a first order rate process. Information is still needed to develop relationships to help predict the rates of diffusion of the Ag nanoparticles as well as the Ag ions formed from dissolution of the nanoparticles into the various tissues.
The objective of this study was to quantify the local biodistribution of two types of coated Ag nanoparticles in the ex vivo tissue perfusion system, the isolated perfused porcine skin flap (IPPSF). IPPSF is representative of intact skin, a target tissue of interest for Ag, and may provide information on rates of distribution in skin to assist in the development of mathematical models to predict the pharmacokinetics of Ag in vivo. The IPPSF recently has been used to investigate the distribution of quantum dots (Lee et al., 2007) and fullerenes (Leavens et al., 2010), the latter of which were shown to primarily distribute only in the vascular space of the flap. The study used two different types of Ag nanoparticles, Ag-citrate and silica-coated Ag, to investigate potential differences in the local biodistribution due to physicochemical properties such as size and surface charge. Like previous pharmacokinetic studies with Ag, this system measured both the Ag nanoparticles and Ag ions present in the media.
MATERIALS AND METHODS
Animals
Female, weanling, Yorkshire/Landrace cross pigs (20–30 kg, n=4) were acclimated for one week prior to surgery. Both prior to and following surgery, the pigs were housed singly in an AALAC-accredited facility on an elevated floor and provided water (ad libitum) and 16% min protein pellets (PMI Nutrition International, LLC, Brentwood, MO). For the surgery the animals were initially anesthetized with a mixture of telazol, ketamine, and xylazine administered intramuscularly, followed by isoflurane by inhalation for the duration of the surgical procedure (Bowman et al., 1991). After surgery the pigs were given banamine (2 mg/kg) to alleviate pain and discomfort. The IPPSF model allows biodistribution studies to be conducted when the tissue has been removed from the animal, thereby minimizing numerous cannulations and distress to animals. The IPPSF was originally touted as an humane alternative animal model both by the Psychologists for the Ethical Treatment of Animals (Bernstein, 1987) and by listing in the ECVAM registry.
Materials
The citrate BioPure™ Ag (20nm) and silica-coated (40nm) Ag nanoparticles were provided by nanoComposix. In addition to the size and zeta potential provided by nanoComposix (Table 1), the stability of the nanoparticles in the perfusion medium as indicated by Ag agglomeration was determined by dynamic light scattering (DLS). The nanoparticles were placed in perfusate at a target concentration of 0.855 μg/ml and incubated at 37°C for 8 h to mimic infusion conditions in the flap. The size of the nanoparticles was determined by DLS on a Zetasizer Nano ZS (Malvern Instruments, Worcestershire, UK) at 0, 4, and 8 h.
Table 1.
Characterization of Ag nanoparticles infused into the IPPSF.
| Ag nanoparticle | Stock solvent | Ag concentration in stock (mg/mL) | Ag concentration in infusion media (μg/ml) | Diameter (nm) | Zeta Potential (mV) | ||
|---|---|---|---|---|---|---|---|
| Target | Measured | TEM | DLS | ||||
| Silver citrate (Biopure) | Aqueous 2mM citrate | 1.0 | 0.855 | 0.84 ± 0.014 | 19.2 | NA | −36.8 |
| Silica-coated silver | Milli-Q water | 4.66 | 0.855 | 0.48 ± 0.010 | 40.5 | 146.7 | 25.4 |
NA=Not applicable. The manufacturer, Nanocomposix, uses a a DLS instrument with a HeNe laser operating at 632.8 nm, and silver nanoparticles with physical diameters less than ~25 nm do not scatter enough photons for use to obtain reasonable signal to noise ratios to determined the hydrodynamic diameter.
Preparation of perfusion media
The IPPSF perfusion media (modified Krebs/Ringer’s buffer) consisted of a Krebs-Ringer bicarbonate buffer solution (pH 7.4) containing the following in g/liter: NaCl, 6.89; KC1, 0.36; CaCl2, 0.28; KH2PO4, 0.16; MgSO4 -7H20, 0.30; NaHCO3, 2.75; dextrose, 1.2; and bovine serum albumin (Cohn Fraction V), 45. The media also contains the antibiotics Amikacin (0.0315 g/L) and Penicillin G (12,500 units/L) and the anticoagulant sodium heparin (5000 units/L).
Preparation of IPPSF
The details and diagrams of the preparation of IPPSFs and the perfusion apparatus used for the study can be found in the original research articles by Bowman et al. (1991) and Riviere et al. (1986), as well as in a review by Riviere and Monteiro-Riviere (1991). One difference in the current study was the use of a single flow-through perfusion with separate arterial and venous reservoirs for media, compared with the originally designed recirculating system. Previous examples for the use of IPPSF to study nanoparticle distribution included Leavens et al. (2010) and Lee et al. (2007).
Briefly, two single pedicle, axial pattern flaps with intact microvascular were surgically prepared in the inguinal region of each pig, one per side. At 48 h post surgery, the skin flaps were cannulated, harvested, and flushed with heparinized saline, then transferred to the perfusion apparatus, which was enclosed in specially designed temperature and humidity-regulated plexiglass chamber to maintain a temperature of 37°C and humidity of 60 to 80%. The flaps were perfused with media at a flow rate of 1 mL/min for one h prior to exposure to Ag nanoparticles, while arterial and venous media was collected and to analyze Ag.
Perfusion of IPPSFs with Ag-citrate or Ag-silica
The IPPSF were infused with citrate BioPure Ag (n=5) and silica-coated Ag (n=5) at a concentration of 342 μg in 400 ml of media (0.855 μg/ml) for 4 h (dose phase), followed by an additional 4-h media perfusion (wash-out phase). Arterial and venous media were sampled at 5 min intervals for the first 30 min, at 15 min intervals from 30 min to 2 h, and at 30 min intervals from 2 h to 4 h. For the washout phase the venous media was sampled at the same intervals as the dosing phase, while the arterial media was only sampled each hour.
Analysis of perfusion media
Analysis of arterial and venous samples for Ag was performed with a Model 2000DV Perkin Elmer inductively coupled plasma optical emission spectrometer (ICP-OES). Samples (500 μl) were pipetted into 15 ml polypropylene tubes and 1 ml of 15.8 M nitric acid was added to each sample. Samples were digested at room temperature for at least 6 h, after which silica-coated samples received an addition of 0.1 ml of 29 M hydrofluoric acid to digest the coating. Samples subsequently were heated in a water bath at 95°C for 30 min and then cooled. The samples were brought to a final volume of 5 ml by the addition of 2% hydrochloric acid, shaken, and then analyzed at the appropriate wavelength for Ag (328.069 nm). A laboratory check standard was analyzed every 6 samples, and the standard curve rerun for any difference greater than ± 5%. No carryover was observed in the sample transport system. A glass Meinhardt nebulizer and cyclonic spray chamber were used for the highest sensitivity for the Ag samples, while a PFA opal mist nebulizer and cyclonic spray chamber were used for the samples containing hydrofluoric acid. Standards were prepared with backgrounds matched to the samples. An internal standard was run with the samples adjoined to the sample transport line to correct for minor differences in sample transport and background matrices. If the internal standard varied more than 20%, the analysis was stopped and the sample torch was cleaned. Method blanks were prepared in the same manner as samples and analyzed for Ag background.
Analysis of Arterial and Venous Ag concentration data
The overall mass balance equation for the flap is given below in equation (1), where Cart is the infused arterial concentration, Cven is the venous concentration from the flap, VIPPSF is the volume of the flap, and Ntoss is the irreversible loss from the system.
| (1) |
At steady state
| (2) |
Therefore
| (3) |
The extraction percentage, which is the percentage of the influx eliminated can be calculated as
| (4) |
The system was assumed to be at steady state when an ANOVA for the effect of time on the arterial and venous concentration was no longer significant at p < 0.05.
Phoenix WinNonLin v 6.1 (Pharsight Corporation, Cary, NC) was used to perform both a noncompartmental analysis (NCA) and compartmental analysis of the Ag concentration data in the venous effluent from the flap. The analysis was performed on each individual skin flap, and a visual fit was used to determine the best model.
The area under the curve was calculated from time 0 to the last time point (AUCtlast) for the arterial and venous Ag concentrations. The ratio of AUCtlast for the arterial versus the venous was used to determine a percentage recovery on the Ag infused according to the following equation:
| (5) |
The percent extraction and percent recovery between the two types of media were compared for statistically significant differences with a two-tailed t-test at p<0.05.
RESULTS
The properties of the two types of Ag nanoparticles and their respective concentrations in the perfusion media are listed in Table 1. The Ag-citrate and Ag-silica did not agglomerate over time in the perfusion media at the exposure concentrations used; the diameter measured by DLS decreased between 0 and 8 h for both particle types (not shown). The actual concentration of Ag measured in the media includes the Ag both from the nanoparticle, as well as possible free ions of Ag present in the media from dissolution during storage in an aqueous environment (Kittler et al., 2010). While the actual concentration of Ag for the Ag-citrate particles was within range of the targeted concentration, the measured concentration of Ag for the Ag-silica particles was only 56% of the target concentration. This may be caused by the silica coating masking the Ag to provide incomplete analysis.
The arterial and venous concentration profiles (X ± SD) for the Ag-citrate and Ag-silica particles are shown in Figure 1. While the arterial concentrations of Ag for both types of particles remained steady during the 4 h infusion, the venous concentrations of Ag for both types did not reach steady state. Therefore the extraction ratio could not be determined for either Ag-silica or Ag-citrate to determine if there was irreversible cellular uptake of either the Ag nanoparticle or Ag ions, which may have been present in the media.
Figure 1.

Arterial and venous Ag concentrations versus time both during infusion and washout of A) Ag-citrate and B) Ag-silica nanoparticles.
The individual concentration versus time profiles for the Ag-citrate and Ag-silica perfusions were analyzed by a noncompartmental analysis. The analysis was conducted on all 5 flaps for Ag-citrate, but only 4 of the flaps for Ag-silica, since one of the flaps had an inadequate washout phase data. For that flap only the 5-min post-exposure time point had concentrations of Ag above the LOD (0.002 μg/ml). A summary of the mean and SD for the estimated parameters are listed in Table 2. The PK parameters, including t1/2λz, MRT, Vz, Vdss, and Cl, were not significantly different between the two Ag nanoparticle types. The larger values for Ag-silica were due to an individual flap whose concentration profile for Ag varied significantly from the other three analyzed. The larger AUC0-∞ was due to the higher infusion concentrations of the Ag-citrate compared with the Ag-silica. The mean of clearances in the flap (Cl) was equal to the perfusion flow rate through the flap.
Table 2.
NCA parameters for IPPSF infusions of Ag-citrate and Ag-silicaa
| Nanoparticle | n | t1/2λz (min) | AUC0-∞ (μg*h/ml) | Percentage AUC0-∞ Extrapolated (%) | Mean Residence Time (min) | Vz (ml) | Cl (ml/min) | Vdss (ml) |
|---|---|---|---|---|---|---|---|---|
| Ag-citrate | 5 | 44 ± 13 | 185 ± 9.2 | 0.18 ± 0.067 | 11v± 4.7 | 73 ± 20 | 1.0 ± 0.05 | 12 ± 6 |
| Ag-silica | 4 | 59 ± 25 | 94 ± 28 | 1.8 ± 2.4 | 30 ± 34 | 135 ± 89 | 1.0 ± 0.4 | 50 ± 71 |
The NCA parameters included are t1/2λz=terminal phase half life, AUC0-∞=Area under concentration time curve from 0 to ∞, Vz=Volume of distribution during terminal phase, Cl=clearance, and Vdss=Volume of distribution at steady state.
While the extraction ratio could not be determined, the AUC0-tlast for the arterial concentration and the AUC0-∞ for the venous concentrations of Ag were used to calculate a percentage recovery of the Ag (Figure 2). The percentage recoveries of Ag during and following the perfusion of the IPPSFs were 87 ± 22 % and 90 ± 5 % for Ag-silica and Ag-citrate, respectively, which were not significantly different between the two nanoparticle types because of the large variability in Ag concentrations among flaps. While the steady-state arterial concentrations of Ag for the silica-coated nanoparticles varied among flaps 6.8 to 23% for the different time points, the venous concentrations of Ag varied 30 to 49% among the flaps at the sampled time points.
Figure 2.

Percentage recovery of the Ag infused into the flap in the venous effluent for both Ag-citrate and Ag-silica. There was no significant difference in recovery between the two types of nanoparticles.
The calculated Vdss was normalized to the flap weight to determine whether the Ag from the perfusion appeared to be localized to the vascular space or was diffusing out into the interstitial or intracellular space. One change that was noted from the perfusion studies was a large change in the flap weight (Figure 3A), which was significantly different than observed previously with IPPSF studies with chemicals and nC60. Therefore, the Vdss was normalized to both the weight of the flap prior to infusion and the weight of the flap at the end of the study for comparison. Although the Ag-silica had a larger normalized Vdss based on both the pre weight and post weight of the flap, it was not statistically different from Ag-citrate, again due to the large variability in the Ag-silica perfusions. The means of the normalized Vdss for the pre and post weights, respectively, were 0.716 ± 0.363 and 0.412 ± 0.22 L/kg for Ag-citrate and 1.96 ± 2.46 and 1.39 ± 1.83 L/kg for Ag-silica.
Figure 3.
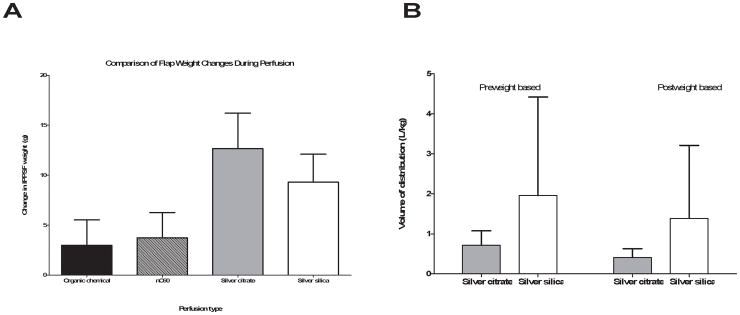
A) Weight of flaps prior to (pre weight) and following (post weight) perfusion for Ag-citrate and Ag-silica and B) Comparison of the estimated volume of distribution at steady state normalized to the preweight and postweight for both types of Ag nanoparticles.
Because Vz was larger compared with Vdss, consistent with a multiple compartment distribution, the individual venous Ag concentrations were analyzed with a two compartment model for an iv infusion. The average of the arterial concentrations for all time points in each flap was used as the infusion concentration. All flaps for Ag-citrate were well fit by the two compartment model, however only 2 of the 5 flaps for Ag-silica could be analyzed. As mentioned for the NCA, one flap had only one post-exposure time point with a measureable Ag concentration, and the other two flaps did not have a venous concentration profile that was consistent with the iv infusion model with a central and peripheral compartment. The values for parameters from the two compartment analysis are listed in Table 3; the mean and SD of the estimates are listed for Ag-citrate, while the individual values for the two flaps for the Ag-silica are listed for comparison. In all the Ag-citrate nanoparticles and in one of the Ag-silica flaps, the distribution phase was not pronounced with ratios of k12/k21 of 0.5 to 0.73, while for the other Ag-silica flap there appeared to be an extensive distribution phase (k12/k21 = 4.1). However, as shown by the larger terminal phase half life (t1/2β) compared with the elimination half life (t1/2elim), the rate of distribution from the peripheral compartment limited the rate of elimination from the flap. Similar to the results with the NCA, the systemic clearance (k10*V1) was approximately 1 ml/min and reflected the perfusion flow rate used in the study. There was insufficient data to determine if the Ag distribution from the Ag-citrate nanoparticles differed significantly from Ag-silica.
Table 3.
PK parameters for 2 compartmental model fit of Ag perfusion dataa
| Nanoparticle | n | t1/2α (min) | t1/2β (min) | k12 (h−1) | k21 (h−1) | k10 (h−1) | t1/2elim (min) | V1 (ml) | V2 (ml) |
|---|---|---|---|---|---|---|---|---|---|
| Ag-citrate | 5 | 2.4 ± 2.2 | 81 ± 38 | 0.26 ± 0.12 | 0.53 ± 0.25 | 17 ± 0.23 | 2.4 ±.2.2 | 6.1 ± 4.9 | 2.7 ± 0.67 |
| Ag-silica | 2 | 5.4 | 59 | 0.56 | 0.78 | 7.2 | 5.8 | 9.7 | 7.1 |
| 1.5 | 377 | 0.46 | 0.11 | 28 | 1.5 | 2.2 | 9.2 |
Values for Ag-citrate are the X ± SDof the parameters estimated for the individual flaps, while the individual values for the 2 flaps are listed for Ag-silica. The parameters estimated include the half lives for the distribution and terminal phases, t1/2α and t1/2β, transfer rate constants between the central and peripheral compartments, k12 and k21, the elimination rate constant k10, the half life of elimination, t1/2elim, volume of the central compartment V1, and volume of the peripheral compartment V2.
DISCUSSION
As the use of nanoparticles in consumer products increases, the potential for accidental exposure from environmental contamination in addition to intentional exposure due to cosmetic or medical use increases. Currently the lifecycle of nanoparticles from source to distribution in the environment leading to exposure and ultimately target tissue dose is poorly defined, although there have been recent efforts to begin to fill in critical data gaps (Gottschalk and Nowack, 2011). Ag is the most widely used nanoparticle in consumer products (Woodrow Wilson International Center for Scholars, 2011) and there have been recent studies of its pharmacokinetics in vitro and in vivo, including development of a preliminary PBPK model in rodents (Lankveld et al. 2010), to better aid in prediction of target tissue doses from exposure to Ag nanoparticles. The purpose of this research was to quantitate the biodistribution of two types of Ag nanoparticles in an ex vivo skin model, to begin to provide quantitative information to help determine the dose response relationship of Ag exposure and potential toxicity.
Soluble forms of Ag have been shown to distribute systemically from ingestion, inhalation or dermal exposure (Drake and Hazelwood, 2005). One of the target tissues for Ag is the skin, in which it results in argyria, noted by a bluish gray discoloration. Historically cases of argyria were noted from medical treatments and occupational exposure, and more recently are being noted from consumption of Ag colloids in dietary supplements and from use of Ag-coated wound dressings. There have been recent reports in the literature of individuals who have developed argyria following ingestion of colloidal Ag for alternative medicinal purposes (Drake and Hazelwood, 2005). The US Food and Drug Administration recently issued a consumer advisory for dietary supplements containing Ag (U.S. Food and Drug administration, 2009). Vlachou et al. (2007) showed that Ag was systemically available in burn patients treated with Acticoat, a wound dressing coated with nanocrystalline Ag. The serum concentrations increased with increased exposure to Acticoat, with maximum concentrations ranging from 0.0048 to 0.23 mg/L (mean=0.0834 mg/L), but returned to normal within 6 months of treatment. Trop et al. (2007) noted the argyria-like symptoms and elevated Ag plasma (0.107 mg/L) in a burn patient treated with Acticoat. One difference in symptoms noted in the individuals treated with Ag-coated wound dressings is that the skin discoloration was reversible, whereas historically argyria has been considered an irreversible disorder with no known cure, including the use of metal chelators.
The current available data on the development of argyria following exposure to Ag is not adequate to define a dose response for ingestion or dermal exposure to Ag-containing products and development of argyria. The US Environmental Protection Agency has established a reference dose (RfD) of 0.005 mg/kg/day to be an estimate of a daily oral dose without appreciable deleterious effects over a lifetime (US Environmental Protection Agency, 1991), but the assessment is based on the dose response for argyria from a study of Ag in humans administered Ag arsphenamine intravenously (Gaul and Staud, 1935). As noted in the FDA advisory, argyria may develop quickly following large doses or slowly following chronic exposure to low doses. Pharmacokinetic data is needed on the distribution of Ag into the skin from exposure to Ag nanoparticles.
The infusion conditions used in the IPPSF in this study were similar to possible in vivo exposures of the skin compartment to systemically absorbed Ag nanoparticles. The flow rate in the flap was 1.0 ml/min, which was a normalized flow rate of 2.6 to 6.8 ml/min/100g. Regional blood flow rates for skin in humans have been reported to be 3.3 to 8.6 ml/min/100g (Williams and Leggett, 1989). In addition the media concentrations of the two Ag nanoparticles, 0.840 mg/L and 0.480 mg/L for Ag-citrate and Ag-silica, respectively, used in this study were a similar magnitude compared with plasma concentrations noted in humans exposed to Ag-containing products. Blood concentrations of Ag for argyria patients have been reported in the range of 0.005 mg/L to as high as 0.5 mg/L. Kim et al. (2009) reported serum concentrations of 0.381 mg/L in a woman who had been ingesting 0.63 mg/kg/day of Ag colloid for 16 month and was diagnosed with argyria.
Unlike previous infusions with nC60 particles (Leavens et al., 2010), the NCA analysis results indicated that the Ag from the nanoparticle infusions distributed outside of the vascular space, most likely into the interstitial fluid, since the normalized volumes of distribution at steady state (Vdss) were greater than 0.2 L/kg for both the Ag-citrate and Ag-silica. In addition to the Vdss being larger than 0.2 L/kg, the estimated terminal volume of distribution (Vz) was approximately 3 to 6 times greater than Vdss, indicating that the Ag in the perfusion media was distributing between multiple compartments within the flap. This distribution from the vascular space may represent either Ag ions or intact nanoparticles, since the ICP-OES method used in the study measured total Ag in the media. However, since the arterial capillaries of the flap, if intact, would be expected to be lined with continuous, nonfenestrated endothelial cells, the Ag ion is most likely the form diffusing across the membrane.
Although the venous concentration profiles for Ag did not reach steady state during the infusion so that an extraction ratio could be estimated, the estimated recovery of the infused Ag was essentially 100% for both types of Ag nanoparticles. In addition the estimated clearance of Ag from the flap was 1.0 ml/min, which was the flow rate of the media through the flap. Therefore, in this system there did not appear to be irreversible uptake of Ag into cells of the flap as has been seen in vitro with HEK cell cultures (Samberg et al., 2010). However if the rate of uptake into cells is slow, the length of infusion may not have been adequate to quantitate the rate of uptake. Based on the mechanism of action for the development of argyria in the skin following Ag exposure, Ag would be expected to be irreversibly distributed to cells. Lankveld et al. (2010) included both an irreversible fraction and freely distributed fraction of Ag in the tissues of their PBPK model for Ag. Their PBPK model did not specifically include skin because of the focus on the liver and brain and the responses in those tissues, but did include a remaining tissue compartment, which would include the skin. The predicted steady state concentration ratio between the central and peripheral compartment concentrations in this study, which equals k12*V1/k21*V2, range from 0.99 to 1.1, similar to the tissue blood partition value, which represents reversible distribution, for the remaining tissue compartment in the Lankveld PBPK model.
The results from this study can provide guidance for developing mathematical models to predict Ag distribution in vivo for use in dose response models for skin toxicity. For the skin compartment, the distribution of Ag between the blood and interstitial fluid will be best represented as a central and peripheral compartment with slow uptake into cells in the dermis. However this data is a preliminary step in the process, since the current work is similar to other pharmacokinetic studies with Ag nanoparticles and cannot distinguish the intact particle kinetics from those of the Ag ions (Johnston et al. 2010), which will be important to describe in vivo. The results of this study also did not indicate a difference in the distribution between the Ag-citrate and the Ag-silica particles, however the results for the Ag-silica infusions were highly variable. More research is needed to determine whether there will be pharmacokinetic differences among Ag nanoparticle types in vivo.
Acknowledgments
This work was funded by NIH GrantR01 ES016138.
References
- Bernstein EM. Psychologists for the Ethical Treatment of Animals. Saranac Lake, NY: 1987. Humane Innovations and Alternatives in Animal Experimentation: A Notebook; p. 7. [Google Scholar]
- Bowden LP, Royer MC, Hallman JR, Lewin-Smith M, Lupton GP. Rapid onset of argyria induced by a X-containing dietary supplement. J Cutan Pathol. 2011;38:832–835. doi: 10.1111/j.1600-0560.2011.01755.x. [DOI] [PubMed] [Google Scholar]
- Bowman KF, Monteiro-Riviere NA, Riviere JE. Development of surgical techniques for preparation of in vitro isolated perfused porcine skin flaps for percutaneous absorption studies. Am J Vet Res. 1991;52:75–82. [PubMed] [Google Scholar]
- Chen X, Schluesener HJ. Nanosilver: a nanoproduct in medical application. Toxicol Lett. 2008;176:1–12. doi: 10.1016/j.toxlet.2007.10.004. [DOI] [PubMed] [Google Scholar]
- Croteau MN, Misra SK, Luoma SN, Valsami-Jones E. Silver bioaccumulation dynamics in a freshwater invertebrate after aqueous and dietary exposures to nanosized and ionic Ag. Environ Sci Technol. 2011;45:6600–6607. doi: 10.1021/es200880c. [DOI] [PubMed] [Google Scholar]
- Drake PL, Hazelwood KJ. Exposure-related health effects of silver and silver compounds: A review. Ann Occup Hyg. 2005;49:575–585. doi: 10.1093/annhyg/mei019. [DOI] [PubMed] [Google Scholar]
- Farkas J, Christian P, Gallego-Urrea JA, Roos N, Hassellov M, Tollefsen KE, Thomas KV. Uptake and effects of manufactured X nanoparticles in rainbow trout (oncorhynchus mykiss) gill cells RID F-3693-2010. Aquat Toxicol. 2011;101:117–125. doi: 10.1016/j.aquatox.2010.09.010. [DOI] [PubMed] [Google Scholar]
- Garza-Ocanas L, Ferrer DA, Burt J, Diaz-Torres LA, Cabrera MR, Rodriguez VT, Rangel RL, Romanovicz D, Jose-Yacaman M. Biodistribution and long-term fate of X nanoparticles functionalized with bovine serum albumin in rats. Metallomics. 2010;2:204–210. doi: 10.1039/b916107d. [DOI] [PubMed] [Google Scholar]
- Gaul LE, Staud AH. Clinical spectroscopy. Seventy cases of generalized argyrosis following organic and colloidal Ag medication. JAMA. 1935;104:1387–1390. [Google Scholar]
- Gottschalk F, Nowack B. The release of engineered nanomaterials to the environment. J Environ Monit. 2011;13:1145–1155. doi: 10.1039/c0em00547a. [DOI] [PubMed] [Google Scholar]
- Hagens WI, Oomen AG, de Jong WH, Cassee FR, Sips AJ. What do we (need to) know about the kinetic properties of nanoparticles in the body? Regul Toxicol Pharmacol. 2007;49:217–29. doi: 10.1016/j.yrtph.2007.07.006. [DOI] [PubMed] [Google Scholar]
- Sheffer M, editor. International Programme on Chemical Safety. Characterization and application of physiologically based pharmacokinetic models in risk assessment. Geneva: World Health Organization; 2010. p. 91. (Harmonization project document; no. 9) [Google Scholar]
- Johnston HJ, Hutchison G, Christensen FM, Peters S, Hankin S, Stone V. A review of the in vivo and in vitro toxicity of silver and gold particulates: Particle attributes and biological mechanisms responsible for the observed toxicity. Crit Rev Toxicol. 2010;40:328–346. doi: 10.3109/10408440903453074. [DOI] [PubMed] [Google Scholar]
- Kim YS, Kim JS, Cho HS, Rha DS, Kim JM, Park JD, Choi BS, Lim R, Chang HK, Chung YH, Kwon IH, Jeong J, Han BS, Yu IJ. Twenty-eight-day oral toxicity, genotoxicity, and gender-related tissue distribution of X nanoparticles in sprague-dawley rats. Inhal Toxicol. 2008;20:575–583. doi: 10.1080/08958370701874663. [DOI] [PubMed] [Google Scholar]
- Kim Y, Song M, Park J, Song K, Ryu H, Chung Y, Chang H, Lee J, Oh K, Kelman BJ, Hwang IK, Yu IJ. Subchronic oral toxicity of silver nanoparticles. Part Fibre Toxicol. 2010;7:20. doi: 10.1186/1743-8977-7-20. [DOI] [PMC free article] [PubMed] [Google Scholar]
- Kim Y, Suh HS, Cha HJ, Kim SH, Jeong KS, Kim DH. A case of generalized argyria after ingestion of colloidal silver solution. Am J Ind Med. 2009;52:246–250. doi: 10.1002/ajim.20670. [DOI] [PubMed] [Google Scholar]
- Kittler S, Greulich C, Diendorf J, Köller M, Epple M. Toxicity of Ag nanoparticles increases during storage because of slow dissolution under release if Ag ions. Chem Mater. 2010;22:4548–4554. [Google Scholar]
- Lankveld DPK, Oomen AG, Krystek P, Neigh A, Troost-de Jong A, Noorlander CW, Van Eijkeren JCH, Geertsma RE, De Jong WH. The kinetics of the tissue distribution of Agnanoparticles of different sizes. Biomaterials. 2010;31:8350–8361. doi: 10.1016/j.biomaterials.2010.07.045. [DOI] [PubMed] [Google Scholar]
- Leavens T, Xia X, Lee H, Monteiro-Riviere N, Brooks J, Riviere J. Evaluation of perfused porcine skin as a model system to quantitate tissue distribution of fullerene nanoparticles. Toxicol Lett. 2010;197:1–6. doi: 10.1016/j.toxlet.2010.03.1119. [DOI] [PubMed] [Google Scholar]
- Lee HA, Imran M, Monteiro-Riviere NA, Colvin VL, Yu WW, Riviere JE. Biodistribution of quantum dot nanoparticles in perfused skin: evidence of coating dependency and periodicity in arterial extraction. Nano Lett. 2007;7:2865–70. doi: 10.1021/nl071563c. [DOI] [PubMed] [Google Scholar]
- Lee HA, Leavens TL, Mason SE, Monteiro-Riviere NA, Riviere JE. Comparison of quantum dot biodistribution with a blood-flow-limited physiologically based pharmacokinetic model. Nano Lett. 2009;9:794–9. doi: 10.1021/nl803481q. [DOI] [PubMed] [Google Scholar]
- Lin P, Chen J, Chang LW, Wu J, Redding L, Chang H, Yeh T, Yang C, Tsai Mm, Wang H, Kuo Y, Yang R. Computational and ultrastructural toxicology of a nanoparticle, quantum dot 705, in mice. Environ Sci Technol. 2008;42:6264–6270. doi: 10.1021/es800254a. [DOI] [PubMed] [Google Scholar]
- Park EJ, Bae E, Yi J, Kim Y, Choi K, Lee SH, Yoon J, Lee BC, Park K. Repeated-dose toxicity and inflammatory responses in mice by oral administration of Ag nanoparticles. Environ Toxicol Pharmacol. 2010;30:162–168. doi: 10.1016/j.etap.2010.05.004. [DOI] [PubMed] [Google Scholar]
- Riviere JE. Pharmacokinetics of nanomaterials: an overview of carbon nanotubes, fullerenes and quantum dots. Wires Nanomed Nanobiotechnol. 2009;1:26–34. doi: 10.1002/wnan.24. [DOI] [PubMed] [Google Scholar]
- Riviere JE, Bowman KF, Monteiro-Riviere NA, Dix LP, Carver MP. The isolated perfused porcine skin flap (IPPSF). I A novel in vitro model for percutaneous absorption and cutaneous toxicology studies. Fundam Appl Toxicol. 1986;7:444–453. doi: 10.1016/0272-0590(86)90094-1. [DOI] [PubMed] [Google Scholar]
- Riviere JE, Monteiro-Riviere NA. The isolated perfused porcine skin flap as an in vitro model for percutaneous absorption and cutaneous toxicology. CRC Cr Rev Toxicol. 1991;21:329–344. doi: 10.3109/10408449109019570. [DOI] [PubMed] [Google Scholar]
- Samberg ME, Oldenburg SJ, Monteiro-Riviere NA. Evaluation of silver nanoparticle toxicity in skin in vivo and keratinocytes in vitro. Environ Health Perspect. 2010;118:407–413. doi: 10.1289/ehp.0901398. [DOI] [PMC free article] [PubMed] [Google Scholar]
- Trop M, Novak M, Rodl S, Hellbom B, Kroell W, Goessler W. Ag-coated dressing acticoat caused raised liver enzymes and argyria-like symptoms in burn patient. J Trauma. 2006;60:648–652. doi: 10.1097/01.ta.0000208126.22089.b6. [DOI] [PubMed] [Google Scholar]
- U.S. Environmental Protection Agency. [Last accessed 09/20/2011];Integrated Risk Information System. 1991 Ag (CASRN 7440-22-4). http://www.epa.gov/iris/subst/0099.htm#reforal.
- U.S. Food and Drug Agency. Consumer advisory: dietary supplements containing Ag may cause permanent discoloration of the skin and mucous membranes (argyria) College Park, MD: Department of Health and Human Services; 2009. [Last accessed 9/20/2011]. ( http://www.fda.gov/Food/DietarySupplements/Alerts/ucm184087.htm) [Google Scholar]
- Vlachou E, Chipp E, Shale E, Wilson YT, Papini R, Moiemen NS. The safety of nanocrystalline silver dressings on burns: A study of systemic silver absorption. Burns. 2007;33:979–985. doi: 10.1016/j.burns.2007.07.014. [DOI] [PubMed] [Google Scholar]
- Williams LR, Leggett RW. Reference values for resting blood flow to organs of man. Clin Phys Meas. 1989;10:187–217. doi: 10.1088/0143-0815/10/3/001. [DOI] [PubMed] [Google Scholar]
- Woodrow Wilson International Center for Scholars. [Last accessed 12/14/2011];A nanotechnology consumer products inventory. 2011 Available at http://www.nanotechproject.org/inventories/consumer/analysis_draft/
- World Health Organization. Harmonization Project Document No 9: Characterization and application of physiologically based pharmacokinetic models in risk assessment. 2011. [Google Scholar]