

Abstract
Neuroblastoma is a cancer of the sympathetic nervous system that accounts for approximately 10% of all pediatric oncology deaths1. Here we report on a genome-wide association study of 2,817 neuroblastoma cases and 7,473 controls. We identified two new associations at 6q16, the first within HACE1 (rs4336470; combined P = 2.7 × 10⁻¹¹, odds ratio 1.26, 95% CI: 1.18–1.35) and the second within LIN28B (rs17065417; combined P = 1.2 × 10⁻⁸, odds ratio 1.38, 95% CI: 1.23–1.54). Expression of LIN28B and let-7 miRNA correlated with rs17065417 genotype in neuroblastoma cell lines, and we observed significant growth inhibition upon depletion of LIN28B specifically in neuroblastoma cells homozygous for the risk allele. Low HACE1 and high LIN28B expression in diagnostic primary neuroblastomas were associated with worse overall survival (P = 0.008 and 0.014, respectively). Taken together, we show that common variants in HACE1 and LIN28B influence neuroblastoma susceptibility and that both genes likely play a role in disease progression.
Neuroblastoma is a malignancy derived from the developing sympathetic nervous system. The median age at diagnosis is 17 months, and the survival rate for the most aggressive subset remains approximately 50% despite intensive multi-modal cytotoxic therapy1 and recent advances in immunotherapy2. The genetic etiology of familial neuroblastoma, which accounts for approximately 1% of cases, has recently come into focus3-6; however, the genetic and environmental factors that cause sporadic neuroblastoma remain largely unknown. We have recently reported common SNPs within or upstream of LINC00340 and FLJ44180, BARD1, LMO1, DUSP12, HSD17B12 and DDX4-IL31RA and a common CNV within NBPF23 as each being highly associated with neuroblastoma7-11. Collectively, however, these variants still account for only a small portion of neuroblastoma heritability, and it is likely that additional predisposition loci remain to be discovered.
To identify additional variants associated with neuroblastoma, we expanded our previous genome-wide association study (GWAS) discovery cohort and analyzed 2,101 neuroblastoma cases accrued through the North American-based Children’s Oncology Group (Supplementary Table 1) with 4,202 control subjects of European ancestry matched genetically and by genotyping array version to minimize genomic inflation (see Online Methods and Supplementary Figs. 1 and 2). All subjects were genotyped using the Illumina HumanHap550 or Quad610 Beadchip. We restricted our analysis to the SNPs present on both platforms that passed our quality control metrics; the genomic control inflation factor was 1.14 (Supplementary Fig. 3). Evaluation of the first three principal components in cases and controls confirmed that the slightly high inflation factor was not due to gross population stratification (Supplementary Fig. 4). Clusters of SNPs from six genomic loci reached genome-wide significance (P-values ranged from 7.8 × 10⁻¹⁶ to 4.8 × 10⁻⁸; Supplementary Fig. 1 and Supplementary Table 2), including three SNPs within LINC00340 and FLJ44180 at 6p22 (P-values ranged from 7.8 × 10⁻¹⁶ to 1.7 × 0−14), ten SNPs within or near BARD1 at 2q35 (P-values ranged from 4.1 × 10⁻¹⁴ to 3.7 × 10⁻⁸), two SNPs within LMO1 at 11p15 (P-values ranged from 1.2 × 10⁻¹³ to 3.8 × 10⁻¹⁰) and one SNP within HSD17B12 at 11p11 (P = 4.8 × 10⁻⁸), further confirming our previous reports7-10. In addition, we identified one SNP (rs4696715) at chromosome 4p16 and two SNPs (rs4336470 and rs9404576) at 6q16 that have not been reported previously (P-values ranged from 1.8 × 10⁻⁸ to 3.4 × 10⁻⁸; Table 1). Several genotyped SNPs in strong linkage disequilibrium (LD) with rs4696715 at 4p16 did not show evidence for association with neuroblastoma; therefore, this SNP was not considered further here.
Table 1.
Significantly associated genotyped SNPs at the HACE1 and LIN28B loci at 6q16
| Discovery cohorta European ancestry |
Italian replicationa (TaqMan) |
CHOP replicationa African American |
Combined | |||||||||
|---|---|---|---|---|---|---|---|---|---|---|---|---|
| SNP | A1/A2 (protective/ risk allele) |
Freq A1 cases (n = 2,101 ) |
Freq A1 controls (n = 4,202) |
P b | Freq A1 cases (n = 351 ) |
Freq A1 controls (n = 780) |
P b | Freq A1 cases (n = 365) |
Freq A1 controls (n = 2,491 ) |
P c | Meta Pd |
ORe (95% CIf) |
| HACE1 | ||||||||||||
| rs4336470 | T/C | 0.30 | 0.35 | 1.8 × 10⁻⁸ | 0.30 | 0.34 | 0.060 | 0.62 | 0.70 | 1.4 × 10⁻³ | 2.7 × 10⁻¹¹ | 1.26 (1.18–1.35) |
| rs9404576 | G/T | 0.30 | 0.35 | 3.4 × 10⁻⁸ | - | - | - | 0.62 | 0.70 | 1.3 × 10⁻³ | 1.8 × 10⁻¹⁰ | 1.27 (1.18-1.36) |
| rs4079063 | G/A | 0.43 | 0.47 | 4.0 × 10⁻⁵ | - | - | - | 0.70 | 0.78 | 1.3 × 10⁻⁴ | 1.3 × 10⁻⁷ | 1.20 (1.12-1.29) |
| rs2499663 | C/T | 0.43 | 0.47 | 4.5 × 10⁻⁵ | - | - | - | 0.70 | 0.78 | 1.5 × 10⁻⁴ | 1.6 × 10⁻⁷ | 1.21 (1.13-1.29) |
| rs2499667 | G/A | 0.43 | 0.47 | 2.6 × 10⁻⁵ | - | - | - | 0.71 | 0.78 | 2.6 × 10⁻⁴ | 1.2 × 10⁻⁷ | 1.21 (1.13-1.29) |
| LIN28B | ||||||||||||
| rs17065417 | C/A | 0.08 | 0.11 | 1.8 × 10⁻⁷ | 0.08 | 0.11 | 0.033 | 0.09 | 0.11 | 0.129 | 1.2 × 10⁻⁸ | 1.38 (1.23-1.54) |
No deviations from Hardy-Weinberg equilibrium were observed (P > 0.001) in all cohorts.
P-values were calculated by allelic test.
P-values were calculated by logistic regression with percent African admixture as covariate12.
Meta-analysis P-value calculated using METAL14.
OR, odds ratio of risk allele based on meta-analysis.
CI, confidence interval.
Closer examination of the 6q16 locus identified four additional SNPs that showed association (P < 1 × 10⁻⁴) with neuroblastoma (Table 1 and Supplementary Table 3). Three of these SNPs mapped to introns of the HECT domain and ankyrin repeat containing, E3 ubiquitin protein ligase 1 gene (HACE1) and exhibited a moderate degree of LD with rs4336470. The fourth SNP (rs17065417; P = 1.8 × 10⁻⁷) mapped to an intron of the lin-28 homolog B gene (LIN28B) and showed very little evidence for LD with rs4336470 in multiple HapMap populations (Supplementary Fig. 5). To ensure these results were not influenced by subtle substructure in the discovery phase, we included the first 20 principal components as covariates in a logistic regression analysis. This reduced the inflation factor to 1.04 but did not alter our conclusions regarding regions reaching genome-wide significance, and the P-values for SNPs at the newly identified 6q16 locus were essentially unchanged (Supplementary Table 4). Finally, we conditioned the analysis of the 6q16 SNPs on rs4336470 to investigate if there might be more than one independent association signal at 6q16. As expected, SNPs in modest LD with rs4336470 were no longer statistically significant after conditioning and clearly represent one signal (Supplementary Table 5). In contrast, while the signal at rs17065417 was attenuated, it remained significant (P = 2.5 × 10⁻⁴; Supplementary Table 5), suggesting that rs4336470 and rs17065417 may contribute independently to neuroblastoma risk. No association was observed between rs4336470 or rs17065417 genotypes and clinical or biological covariates (Supplementary Tables 6 and 7), and we observed only weak evidence for epistasis at the other significant loci (Supplementary Tables 8 and 9), suggesting that each may act independently to confer risk.
We next sought to replicate the rs4336470 and rs17065417 associations in an Italian cohort of 351 cases and 780 controls using PCR-based genotyping. Both SNPs showed evidence for association in the same direction seen in the discovery effort (Table 1 and Supplementary Table 3). To assess whether these variants influence susceptibility in other ethnic groups, and to seek additional replication, we analyzed a third independent case series comprised of 365 African American neuroblastoma cases and 2,491 genetically matched controls, all genotyped on the Illumina HumanHap550 or Quad610 BeadChip. After accounting for African admixture in logistic regression analysis, the genomic inflation factor was 1.02, as described previously12 (Online Methods and Supplementary Fig. 6). Consistent with the lower incidence rate of neuroblastoma in African Americans13, the rs4336470 protective allele (T) is actually the major allele in African Americans, whereas it is the minor allele in individuals of European ancestry. Despite these observed differences in allele frequencies, all SNPs mapped to HACE1 replicated robustly in the African American cohort (P-values ranged from 1.3 × 10⁻⁴ to 1.4 × 10⁻³; Table 1 and Supplementary Table 3), and all associations were in the same direction. Allele frequencies for the LIN28B SNP rs17065417 were comparable across ethnic populations and showed a trend toward association in African Americans in the same direction as the European American discovery and Italian replication cohorts (Table 1 and Supplementary Table 3). Combined analysis using the weighted inverse-variance method in METAL14 demonstrated that all six genotyped SNPs had P values beyond or approaching the conservative Bonferroni adjusted genome-wide significance threshold (P-values ranged from 2.7 × 10⁻¹¹ to 1.6 × 10⁻⁷; Table 1).
To identify variants at the 6q16 locus not assayed directly on the Illumina SNP arrays, we performed genotype imputation in our discovery cohort using data from the 1000 Genomes project. This analysis identified ten additional genome-wide significant SNPs (P-values ranged from 4.4 × 10⁻⁹ to 5.7 × 10⁻⁸; Fig. 1). Five of these imputed SNPs were in strong LD with rs4336470 (r2 > 0.8 in 1000 Genomes EUR population); three mapped to introns of HACE1 and the other two were located just downstream of HACE1 (Fig. 1a). The remaining five imputed SNPs reaching genome-wide significance were in strong LD with rs17065417 (r2 > 0.8 in 1000 Genomes EUR population) and were located within introns of LIN28B (Fig. 1b). In total, we identified 46 imputed SNPs that showed strong evidence for association (P < 1.0 × 10⁻⁶, Supplementary Table 10). To further evaluate whether two independent association signals exist at 6q16, we conditioned the regional association analysis on either rs4336470 or rs17065417 and found that neither could fully account for the observed associations (Supplementary Fig. 7). The signal at 6q16 was only abolished across the entire region after conditioning on both rs4336470 and rs17065417 (Supplementary Fig. 8). While we cannot rule out the possibility that both SNPs may be tagging the same underlying risk variant, these data are consistent with the presence of two independent association signals at 6q16, one implicating HACE1 and the other LIN28B.
Figure 1.

Regional association plots at the HACE1 and LIN28B loci. Regional association plots including both genotyped and imputed SNPs for the HACE1 and LIN28B loci generated by LocusZoom36. Plotted are the significance of association (-log10 transformed P values) and the recombination rate. SNPs are color-coded based on pair-wise linkage disequilibrium (r2) with the most significant genotyped SNP in the EUR (European) 1000 Genomes Interim Phase I release genotypes. The most significant genotyped SNP and associated P-value are labeled, and the SNP is shown in purple. (a) HACE1 locus (b) LIN28B locus.
The HACE1 gene encodes an E3 ubiquitin-protein ligase that was first identified in a sporadic Wilms tumor that harbored a t(6:15)(q21;q21) translocation15. The rearrangement was associated with decreased HACE1 expression, and further study showed that HACE1 is silenced in the majority of Wilms tumors via hypermethylation of two CpG islands upstream of the transcriptional start site15. Similar epigenetic silencing has been reported in advanced colorectal cancer16 and gastric carcinoma17. Indeed HACE1 is down-regulated in multiple human tumors and maps to a region of common deletion or LOH, consistent with a tumor suppressor function. Hace1 null mice form spontaneous tumors in a wide array of tissues and are susceptible to additional cancer triggers, both genetic and environmental18. Through its E3 ubiquitin ligase function, HACE1 has been shown to suppress cell growth and anchorage independence of human tumor cells, including the neuroblastoma cell line IMR32 (ref. 18). Studies suggest that HACE1 inhibits cell cycle progression during stress via regulation of cyclin D1 degradation18 and that HACE1 also regulates retinoic acid receptor (RAR) activity19. In addition to multiple somatic alterations involving the HACE1 locus, a constitutional t(5;6)(q21;q21) translocation that disrupts HACE1 was recently identified, making it a putative Wilms tumor susceptibility gene20.
The LIN28B gene encodes a developmentally regulated RNA binding protein and is a key repressor of the let-7 family of microRNAs21. Both LIN28A and LIN28B function as oncogenes that promote cellular transformation when ectopically over-expressed22-24, and high levels of expression of LIN28A or LIN28B have been observed in several human cancers and correlate with low let-7 levels22,24. Post-transcriptional regulation of let-7 by LIN28A is required for normal development and contributes to the pluripotent state by preventing let-7–mediated differentiation of embryonic stem cells21,25,26. Over-expressing LIN28 or inhibiting let-7 with antisense RNA promotes reprogramming of human and mouse fibroblast to pluripotent stem cells26,27. In a panel of 60 pediatric cancer cell lines28, LIN28B was consistently expressed at high levels in neuroblastoma (Supplementary Fig. 9). Recently, LIN28B and let-7 were also identified as key regulators of glucose homeostatis29 and hematopoiesis30. To date, GWAS studies have identified variants in LIN28B associated with human height31 and the age of onset of puberty32 and menarche33. In addition, a recent candidate gene study identified a putative association with epithelial ovarian cancer34.
To investigate the functional relevance of neuroblastoma-associated SNPs within HACE1 and LIN28B, we first analyzed a set of 12 neuroblastoma cell lines with matched genome-wide SNP genotyping and mRNA expression data. No correlation between rs4336470 and HACE1 mRNA expression was observed (P = 0.30), but LIN28B expression was significantly higher in cell lines homozygous for the rs17065417 risk allele (A) compared to heterozygous cell lines (P = 0.02; Fig. 2a). No cell lines tested were homozygous for the rs17065417 protective allele (C). LIN28A was not expressed in neuroblastoma cell lines, consistent with recent reports that LIN28A and LIN28B may be mutually exclusive in terms of their expression in cancer cells21. In addition to a correlation between rs17065417 genotype and LIN28B expression, we observed a strong positive correlation with MYCN expression (P = 0.0003; Fig. 2b). We next confirmed LIN28B protein levels by western blot in four cell lines at the extremes of LIN28B mRNA expression (Fig. 2c). Cell lines expressing high LIN28B showed lower let-7 expression across the entire miRNA family (Fig. 2d). Transient knockdown of LIN28B resulted in significant growth inhibition in neuroblastoma cells homozygous for the rs17065417 risk allele and with high LIN28B expression (Fig. 3a-d), but not in the heterozygous cell line SKNAS with low LIN28B expression (Fig. 3e,f). Taken together, these data are consistent with the hypothesis that LIN28B promotes neuroblastoma tumorigenesis in part through repression of let-7 miRNAs, and that the risk alleles are associated with growth advantage through increased LIN28B expression; however, additional studies with larger sample sizes are needed to confirm this.
Figure 2.

LIN28B risk alleles correlate with increased LIN28B expression and decreased let-7 miRNA expression. (a) LIN28B mRNA expression is significantly higher in neuroblastoma cell lines homozygous for the rs17065417 risk allele (AA) compared to neuroblastoma cell lines heterozygous for the risk allele (CA). Given the MAF of rs17065417, we did not identify any cell lines homozygous for the protective allele (CC). (b) Neuroblastoma cell lines homozygous for the rs17065417 risk allele show high expression of MYCN. (c) Western blot confirms increased protein expression of LIN28B in neuroblastoma cell lines homozygous for the rs17065417 risk allele. (d) Neuroblastoma cell lines homozygous for the rs17065417 risk allele and with high LIN28B expression show decreased or absent expression of the let-7 miRNAs.
Figure 3.
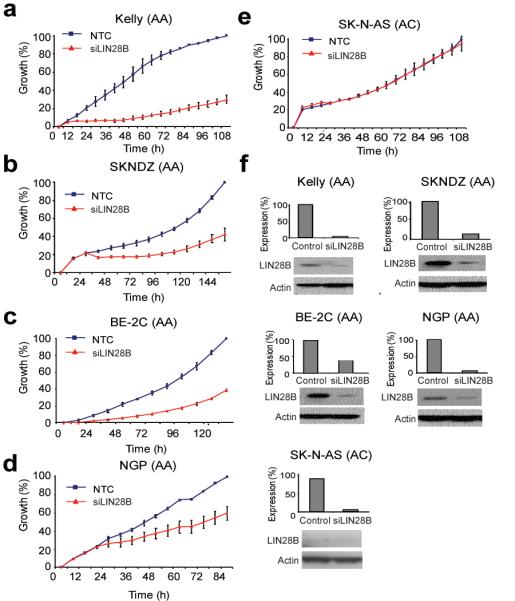
Transient knockdown of LIN28B influences neuroblastoma cell growth in an expression-specific manner. (a-d) In cells homozygous for neuroblastoma risk alleles and with higher LIN28B expression levels, LIN28B knockdown leads to significant growth inhibition. (e) In cells heterozygous for the risk allele (carrying one protective allele) and with low LIN28B expression, LIN28B knockdown does not affect cell growth. (f) LIN28B knockdown as measured by quantitative reverse transcription PCR and western blot for experiments a–e.
To examine the relevance of HACE1 and LIN28B in tumor samples, we assayed expression of both genes by real-time quantitative RT-PCR in a representative set of 87 primary tumors obtained at time of diagnosis (Supplementary Table 1). HACE1 expression was significantly lower (P = 0.002; Fig. 4a) and LIN28B expression was significantly higher (P = 0.032; Fig. 4b) in the high-risk tumors. Accordingly, low HACE1 expression was associated with a worse overall survival (P = 0.008; Fig. 4c), as was high LIN28B expression (P = 0.015; Fig. 4d). Analysis of four independent mRNA expression array datasets comprising 517 neuroblastoma tumors provided robust replication of these observations (Fig. 4e-h and Supplementary Figs. 10-12). These data support the hypothesis that HACE1 may function as a tumor suppressor, and LIN28B as an oncogene, in advanced neuroblastomas.
Figure 4.

HACE1 and LIN28B expression are associated with advanced disease and poor outcome in neuroblastoma. (a) HACE1 mRNA expression is significantly lower in high-risk neuroblastoma tumors. Bar graph is shown for Children’s Oncology Group (COG) risk groups. (error bars: s.e.m.). (b) LIN28B mRNA expression is significantly increased in high-risk neuroblastoma tumors. Bar graph is shown for Children’s Oncology Group (COG) risk groups. (error bars: s.e.m.). (c) Decreased HACE1 expression in primary tumors obtained at diagnosis is associated with worse overall survival. Kaplan-Meier analysis is shown, with patients grouped by tertiles of HACE1 expression. Log rank P-value is shown. (d) Increased LIN28B expression in primary tumors obtained at diagnosis is associated with worse overall survival. Kaplan-Meier analysis is shown, with patients grouped by tertiles of LIN28B expression. Log rank P-value is shown. (e) Replication of decreased HACE1 in advanced stage neuroblastoma using published Affymetrix U133 plus v2 array data (R2 bioinformatics tool). Bar graph is shown for INSS stage 1-4 (error bars: s.e.m.). (f) Replication of increased LIN28B in advanced stage neuroblastoma (R2 bioinformatics tool). Bar graph is shown for INSS stage 1-4 (error bars: s.e.m.). (g) Decreased expression of HACE1 is associated with worse outcome in dataset from e. Kaplan-Meier is analysis shown, with patients grouped by tertiles of HACE1 expression. Log rank P-value is shown. (h) Increased expression of LIN28B is associated with worse outcome in dataset from f. Kaplan-Meier analysis is shown, with patients grouped by tertiles of LIN28B expression. Log rank P-value is shown. ****P < 0.0001, ***P < 0.001, **P < 0.01, *P < 0.05.
In conclusion, here we have identified common variants within HACE1 and LIN28B that are associated with neuroblastoma. Similar to other genes identified in our ongoing GWAS efforts8,9,35, it is likely that the germline susceptibility variants identified here play an important role not only in tumor initiation but also in disease progression via cis-effects on major cancer genes. Further study of HACE1 and LIN28B in neuroblastoma is warranted and may lead to new insights into the genetic and epigenetic mechanisms underlying an aggressive clinical phenotype.
Supplementary Material
ACKNOWLEDGMENTS
This work was supported in part by NIH Grants R01-CA124709 (J.M.M.), K99-CA151869 (S.J.D.), P30-HD026979 (M.D.), the Giulio D’Angio Endowed Chair (J.M.M.), the Alex’s Lemonade Stand Foundation (J.M.M.), Andrew’s Army Foundation (J.M.M.), the PressOn Foundation (J.M.M.), the Abramson Family Cancer Research Institute (J.M.M.), K08-CA136979 (K.A.C.), Fondazione Italiana per la Lotta al Neuroblastoma and Associazione Italiana per la Ricerca sul Cancro (M.C.) and the Center for Applied Genomics at the Children’s Hospital of Philadelphia Research Institute (H.H.). We thank Patrick Sleiman for useful discussions regarding meta-analysis using METAL.
Footnotes
COMPETING FINANCIAL INTEREST The authors declare no competing financial interest.
AUTHOR CONTRIBUTIONS S.J.D and J.M.M. designed the experiment and drafted the manuscript. S.J.D. analyzed SNP data, performed SNP association study and analyzed mRNA and miRNA expression data. M.C. and A.I. replicated SNP associations in Italian cohort. V.L. and M.D. replicated SNP associations in African American cohort. E.L.C. and H.L. confirmed LIN28B protein expression by western blot. R.S. and C.W. performed siRNA knockdown experiments of LIN28B. E.F.A. generated miRNA expression array data including low-level summary values. K.A.C. performed RT-PCR in primary tumors. M.D. and C.H. organized samples and genotyped cases. H.H. generated and provided all control data for GWAS. M.D. and H.H. contributed to overall study design. All authors commented on or contributed to the current manuscript.
Accession numbers. The genotyping data are deposited in dbGaP under accession number phs000124.
URLs. dbGaP, http://www.ncbi.nlm.nih.gov/gap
LocusZoom, http://csg.sph.umich.edu/locuszoom
1000 Genomes Project, http://www.1000genomes.org
R2 bioinformatics tool, http://r2.amc.nl
NCI Oncogenomics, http://home.ccr.cancer.gov/oncology/oncogenomics
EdSumm (same for AOP and issue): John Maris and colleagues identify common variants at 6q16 associated with neuroblastoma susceptibility. The risk variants are located near the HACE1 and LIN28B genes, both of which show altered expression in advanced neuroblastomas.
REFERENCES
- 1.Maris JM. Recent advances in neuroblastoma. N. Engl. J. Med. 2010;362:2202–2211. doi: 10.1056/NEJMra0804577. [DOI] [PMC free article] [PubMed] [Google Scholar]
- 2.Yu AL, et al. Anti-GD2 antibody with GM-CSF, interleukin-2, and isotretinoin for neuroblastoma. N. Engl. J. Med. 2010;363:1324–1334. doi: 10.1056/NEJMoa0911123. [DOI] [PMC free article] [PubMed] [Google Scholar]
- 3.Mosse YP, et al. Identification of ALK as a major familial neuroblastoma predisposition gene. Nature. 2008;455:930–935. doi: 10.1038/nature07261. [DOI] [PMC free article] [PubMed] [Google Scholar]
- 4.Janoueix-Lerosey I, et al. Somatic and germline activating mutations of the ALK kinase receptor in neuroblastoma. Nature. 2008;455:967–970. doi: 10.1038/nature07398. [DOI] [PubMed] [Google Scholar]
- 5.Trochet D, et al. Germline mutations of the paired-like homeobox 2B (PHOX2B) gene in neuroblastoma. Am. J. Hum. Genet. 2004;74:761–764. doi: 10.1086/383253. [DOI] [PMC free article] [PubMed] [Google Scholar]
- 6.Mosse YP, et al. Germline PHOX2B mutation in hereditary neuroblastoma. Am. J. Hum. Genet. 2004;75:727–730. doi: 10.1086/424530. [DOI] [PMC free article] [PubMed] [Google Scholar]
- 7.Maris JM, et al. Chromosome 6p22 locus associated with clinically aggressive neuroblastoma. N. Engl. J. Med. 2008;358:2585–2593. doi: 10.1056/NEJMoa0708698. [DOI] [PMC free article] [PubMed] [Google Scholar]
- 8.Capasso M, et al. Common variations in BARD1 influence susceptibility to high-risk neuroblastoma. Nat. Genet. 2009;41:718–723. doi: 10.1038/ng.374. [DOI] [PMC free article] [PubMed] [Google Scholar]
- 9.Wang K, et al. Integrative genomics identifies LMO1 as a neuroblastoma oncogene. Nature. 2010;469:216–220. doi: 10.1038/nature09609. [DOI] [PMC free article] [PubMed] [Google Scholar]
- 10.Nguyen LB, et al. Phenotype restricted genome-wide association study using a gene-centric approach identifies three low-risk neuroblastoma susceptibility loci. PLoS Genet. 2011;7:e1002026. doi: 10.1371/journal.pgen.1002026. [DOI] [PMC free article] [PubMed] [Google Scholar]
- 11.Diskin SJ, et al. Copy number variation at 1q21.1 associated with neuroblastoma. Nature. 2009;459:987–991. doi: 10.1038/nature08035. [DOI] [PMC free article] [PubMed] [Google Scholar]
- 12.Latorre V, et al. Replication of neuroblastoma SNP association at the BARD1 locus in African-Americans. Cancer Epidemiol. Biomarkers Prev. 2012;21:658–663. doi: 10.1158/1055-9965.EPI-11-0830. [DOI] [PMC free article] [PubMed] [Google Scholar]
- 13.Henderson TO, et al. Racial and ethnic disparities in risk and survival in children with neuroblastoma: a Children’s Oncology Group study. J. Clin. Oncol. 2010;29:76–82. doi: 10.1200/JCO.2010.29.6103. [DOI] [PMC free article] [PubMed] [Google Scholar]
- 14.Willer CJ, Li Y, Abecasis GR. METAL: fast and efficient meta-analysis of genomewide association scans. Bioinformatics. 2010;26:2190–2191. doi: 10.1093/bioinformatics/btq340. [DOI] [PMC free article] [PubMed] [Google Scholar]
- 15.Anglesio MS, et al. Differential expression of a novel ankyrin containing E3 ubiquitin-protein ligase, Hace1, in sporadic Wilms’ tumor versus normal kidney. Hum. Mol. Genet. 2004;13:2061–2074. doi: 10.1093/hmg/ddh215. [DOI] [PubMed] [Google Scholar]
- 16.Hibi K, et al. Aberrant methylation of the HACE1 gene is frequently detected in advanced colorectal cancer. Anticancer Res. 2008;28:1581–1584. [PubMed] [Google Scholar]
- 17.Sakata M, et al. Methylation of HACE1 in gastric carcinoma. Anticancer Res. 2009;29:2231–2233. [PubMed] [Google Scholar]
- 18.Zhang L, et al. The E3 ligase HACE1 is a critical chromosome 6q21 tumor suppressor involved in multiple cancers. Nat. Med. 2007;13:1060–1069. doi: 10.1038/nm1621. [DOI] [PubMed] [Google Scholar]
- 19.Zhao J, Zhang Z, Vucetic Z, Soprano KJ, Soprano DR. HACE1: A novel repressor of RAR transcriptional activity. J. Cell. Biochem. 2009;107:482–493. doi: 10.1002/jcb.22146. [DOI] [PMC free article] [PubMed] [Google Scholar]
- 20.Slade I, et al. Constitutional translocation breakpoint mapping by genome-wide paired- end sequencing identifies HACE1 as a putative Wilms tumour susceptibility gene. J. Med. Genet. 2009;47:342–347. doi: 10.1136/jmg.2009.072983. [DOI] [PubMed] [Google Scholar]
- 21.Piskounova E, et al. Lin28A and Lin28B inhibit let-7 microRNA biogenesis by distinct mechanisms. Cell. 2011;147:1066–1079. doi: 10.1016/j.cell.2011.10.039. [DOI] [PMC free article] [PubMed] [Google Scholar]
- 22.Iliopoulos D, Hirsch HA, Struhl K. An epigenetic switch involving NF-κB, Lin28, Let-7 microRNA, and IL6 links inflammation to cell transformation. Cell. 2009;139:693–706. doi: 10.1016/j.cell.2009.10.014. [DOI] [PMC free article] [PubMed] [Google Scholar]
- 23.West JA, et al. A role for Lin28 in primordial germ-cell development and germ-cell malignancy. Nature. 2009;460:909–913. doi: 10.1038/nature08210. [DOI] [PMC free article] [PubMed] [Google Scholar]
- 24.Viswanathan SR, et al. Lin28 promotes transformation and is associated with advanced human malignancies. Nat. Genet. 2009;41:843–848. doi: 10.1038/ng.392. [DOI] [PMC free article] [PubMed] [Google Scholar]
- 25.Martinez NJ, Gregory RI. MicroRNA gene regulatory pathways in the establishment and maintenance of ESC identity. Cell Stem Cell. 2010;7:31–35. doi: 10.1016/j.stem.2010.06.011. [DOI] [PMC free article] [PubMed] [Google Scholar]
- 26.Melton C, Judson RL, Blelloch R. Opposing microRNA families regulate self-renewal in mouse embryonic stem cells. Nature. 2010;463:621–626. doi: 10.1038/nature08725. [DOI] [PMC free article] [PubMed] [Google Scholar]
- 27.Yu J, et al. Induced pluripotent stem cell lines derived from human somatic cells. Science. 2007;318:1917–1920. doi: 10.1126/science.1151526. [DOI] [PubMed] [Google Scholar]
- 28.Neale G, et al. Molecular characterization of the pediatric preclinical testing panel. Clin. Cancer Res. 2008;14:4572–4583. doi: 10.1158/1078-0432.CCR-07-5090. [DOI] [PMC free article] [PubMed] [Google Scholar]
- 29.Zhu H, et al. The Lin28/let-7 axis regulates glucose metabolism. Cell. 2011;147:81–94. doi: 10.1016/j.cell.2011.08.033. [DOI] [PMC free article] [PubMed] [Google Scholar]
- 30.Yuan J, Nguyen CK, Liu X, Kanellopoulou C, Muljo SA. Lin28b reprograms adult bone marrow hematopoietic progenitors to mediate fetal-like lymphopoiesis. Science. 2012;335:1195–1200. doi: 10.1126/science.1216557. [DOI] [PMC free article] [PubMed] [Google Scholar]
- 31.Widen E, et al. Distinct variants at LIN28B influence growth in height from birth to adulthood. Am. J. Hum. Genet. 2010;86:773–782. doi: 10.1016/j.ajhg.2010.03.010. [DOI] [PMC free article] [PubMed] [Google Scholar]
- 32.Ong KK, et al. Genetic variation in LIN28B is associated with the timing of puberty. Nat. Genet. 2009;41:729–733. doi: 10.1038/ng.382. [DOI] [PMC free article] [PubMed] [Google Scholar]
- 33.Sulem P, et al. Genome-wide association study identifies sequence variants on 6q21 associated with age at menarche. Nat. Genet. 2009;41:734–738. doi: 10.1038/ng.383. [DOI] [PubMed] [Google Scholar]
- 34.Permuth-Wey J, et al. LIN28B polymorphisms influence susceptibility to epithelial ovarian cancer. Cancer Res. 2011;71:3896–3903. doi: 10.1158/0008-5472.CAN-10-4167. [DOI] [PMC free article] [PubMed] [Google Scholar]
- 35.Bosse KR, et al. Common variation at BARD1 results in the expression of an oncogenic isoform that influences neuroblastoma susceptibility and oncogenicity. Cancer Res. 2012;72:2068–2078. doi: 10.1158/0008-5472.CAN-11-3703. [DOI] [PMC free article] [PubMed] [Google Scholar]
- 36.Pruim RJ, et al. LocusZoom: regional visualization of genome-wide association scan results. Bioinformatics. 2010;26:2336–2337. doi: 10.1093/bioinformatics/btq419. [DOI] [PMC free article] [PubMed] [Google Scholar]
- 37.Brodeur GM, et al. Revisions of the international criteria for neuroblastoma diagnosis, staging, and response to treatment. J. Clin. Oncol. 1993;11:1466–1477. doi: 10.1200/JCO.1993.11.8.1466. [DOI] [PubMed] [Google Scholar]
- 38.Shimada H, et al. The International Neuroblastoma Pathology Classification (Shimada) System. Cancer. 1999;86:364–372. [PubMed] [Google Scholar]
- 39.Mathew P, et al. Detection of MYCN gene amplification in neuroblastoma by fluorescence in situ hybridization: a Pediatric Oncology Group study. Neoplasia. 2001;3:105–109. doi: 10.1038/sj.neo.7900146. [DOI] [PMC free article] [PubMed] [Google Scholar]
- 40.Look AT, et al. Clinical relevance of tumor cell ploidy and N-myc gene amplification in childhood neuroblastoma: a Pediatric Oncology Group study. J. Clin. Oncol. 1991;9:581–591. doi: 10.1200/JCO.1991.9.4.581. [DOI] [PubMed] [Google Scholar]
- 41.Gunderson KL, Steemers FJ, Lee G, Mendoza LG, Chee MS. A genome-wide scalable SNP genotyping assay using microarray technology. Nat. Genet. 2005;37:549–554. doi: 10.1038/ng1547. [DOI] [PubMed] [Google Scholar]
- 42.Steemers FJ, et al. Whole-genome genotyping with the single-base extension assay. Nat. Methods. 2006;3:31–33. doi: 10.1038/nmeth842. [DOI] [PubMed] [Google Scholar]
- 43.Howie BN, Donnelly P, Marchini J. A flexible and accurate genotype imputation method for the next generation of genome-wide association studies. PLoS Genet. 2009;5:e1000529. doi: 10.1371/journal.pgen.1000529. [DOI] [PMC free article] [PubMed] [Google Scholar]
- 44.Howie B, Marchini J, Stephens M. Genotype imputation with thousands of genomes. G3. 2011;1:457–470. doi: 10.1534/g3.111.001198. [DOI] [PMC free article] [PubMed] [Google Scholar]
- 45.Marchini J, Howie B, Myers S, McVean G, Donnelly P. A new multipoint method for genome-wide association studies by imputation of genotypes. Nat. Genet. 2007;39:906–913. doi: 10.1038/ng2088. [DOI] [PubMed] [Google Scholar]
- 46.Cole KA, et al. A functional screen identifies miR-34a as a candidate neuroblastoma tumor suppressor gene. Mol. Cancer Res. 2008;6:735–742. doi: 10.1158/1541-7786.MCR-07-2102. [DOI] [PMC free article] [PubMed] [Google Scholar]
- 47.Kaplan EL, Meier P. Nonparametric estimation from incomplete observations. J. Am. Stat. Assn. 1958;53:457–481. [Google Scholar]
Associated Data
This section collects any data citations, data availability statements, or supplementary materials included in this article.