Abstract
Background:
Gingival inflammation may be caused by injury or plaque-related disease and reduction in inflammation can be a useful indicator of gingival recovery. There has been little research on development of non-index method to measure gingival condition. The study aimed to investigate the quantitative analysis of gingival swelling and color characteristics of gingiva by digital images before and after treatment of individual patients.
Material and Methods:
Twenty volunteers with gingival inflammation were recruited and digital images were taken. Duplicate measurements were made on the first visit by the same examiner. At a subsequent visit (1 month) following scaling and root planing, second images were taken. Gingival changes were determined by assessing redness and tooth surface area visible between the level of the inter-proximal papillae and the gingival margin.
Results:
Significant difference was found between the pre-operative and post-operative photographs with regard to swelling and gingival redness.
Conclusion:
Thus this method aids in quantitative analysis of swelling and color characteristics of gingiva by digital images may become a valuable, objective, practicable non-index and inexpensive evaluation procedure of gingival inflammation.
Keywords: Gingival inflammation, image analysis, non-index method
INTRODUCTION
Gingival inflammation may be caused by plaque-related disease or injury and reduction of inflammation is a good indicator of gingival recovery. Presence of gingival inflammation is assessed subjectively. Way back during the 1950s, it was grouped as good/medium or poor. Later, the index methods were introduced, which were widely used in general practice and in epidemiological studies as well. The World Health Organization (WHO) promoted the development of the Periodontal Index which was widely used up to the later part of the 20th century.[1] This index was the first used in the longitudinal studies to show that scores lowered after treatment as the gingival inflammation index scoring was reversible.
In the presence of gingival inflammation, the gingiva is red, edematous, bleeds on slight provocation or spontaneously, and is swollen/enlarged associated with loss of stippling. Electronic measurement of gingival color by digital image is a non-invasive reproducible inexpensive method of assessment. Gingival swelling was scored as 0–3 according to Harris and Ewalt[2] or as development by Syemour et al,[3] Ellis et al,[4] projected the photographs of the patient and then gave the scores as given earlier. However, this again is a subjective method of grading the gingival enlargement.
Thus, this study was aimed to investigate the quantitative analysis of gingival swelling and color characteristics of gingiva by digital images before and after treatment of individual patients.
MATERIALS AND METHODS
Study group
Twenty-four volunteer patients, who had signs of gingival inflammation, aged between 15 and 55 years, were explained about the study and those who agreed to participate were recruited in the study. Informed consent was obtained from them. Patients who were medically compromised or who consumed any drug that caused gingival enlargement were excluded from the study. Since absence of gingival bleeding on probing was considered as the gold standard of gingival health,[4] assessment of gingival health was done with the mouth mirror and probe and it was checked for gingival bleeding presence/absence. Pre-treatment photos were taken [Figure 1] by positioning the patient in the cephalometric head positioning apparatus and the camera was located on a tripod with fixed distance between the cephalometric head positioning and patient in all the cases.[5] Kodak easy share P712 zoom digital camera [Figure 2], CCD, ISO of 800 selectable only in 1.2 MP resolution with Schneider-Kreuznach Variogon lens, 12 optical zoom, and electronic flash (auto flip-up), extended flash range with Kodak external flash unit was used to take the photos; flash light was as well standardized. Scaling and root planning was done, patients were recalled after 1 month, and photographs were again taken [Figure 3] maintaining similar standardization measures.
Figure 1.
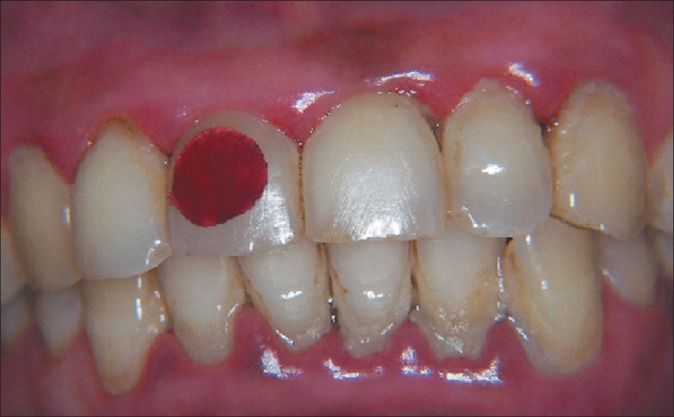
Pre-treatment photos of inflamed gingiva
Figure 2.
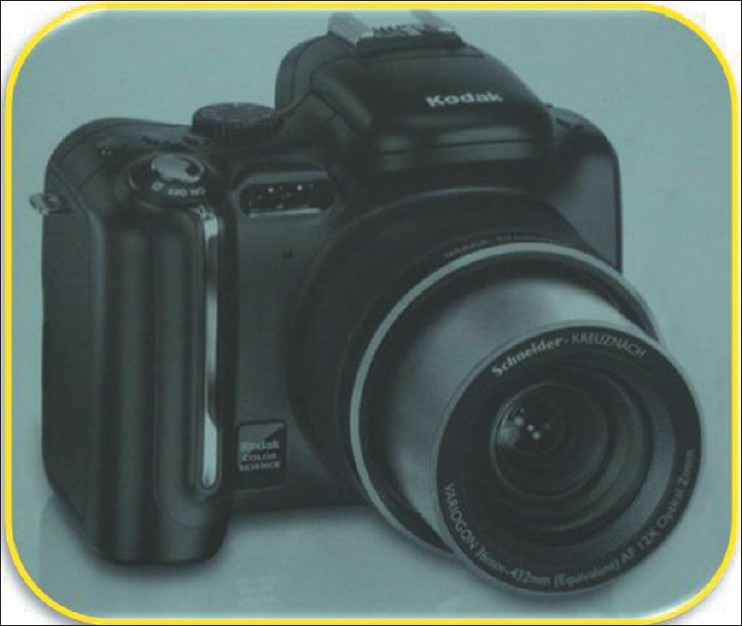
Camera used in the study
Figure 3.
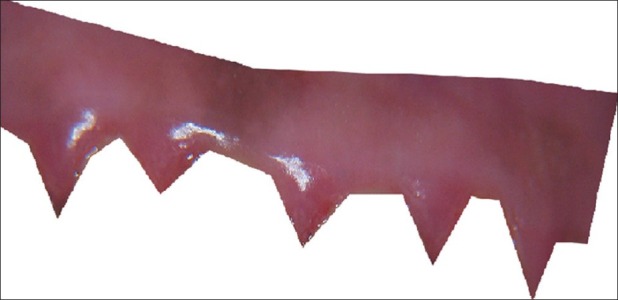
Inflamed area of gingiva was cropped to obtain histogram reading
Image analysis
Calibration and analysis of image for gingival redness and gingival swelling was carried out using Serif photo pluse-6 software. The histogram option in the Serif photo pluse-6 software was selected, which gave the mean, standard deviation, and pixels of the selected gingival area. Red disk of known size was placed in patient's upper central left incisor; this disk was incorporated for color and photo size calibration and standardizing. All the red disks were cut from the same sheet of red articular paper using a sterilized hole punch.[6] The red disk in each photo gave identical pixel value when checked before the photos were used for calibration and analysis of image for gingival redness and gingival swelling.
To get the actual histogram reading of the inflamed gingiva, only the inflamed area of gingiva was cropped [Figures 4 and 5] and the histogram reading [Figure 6] for mean, standard deviation, pixels of red/white, highest level of pixel count, and total pixel counts was obtained and noted. This was repeated for the post-treatment photographs as well. In the presence of gingival swelling, part of tooth surface is encroached upon by gingiva, which will be uncovered in the absence of gingival inflammation, so as to say that the visible tooth surface area will be increased in the absence of inflammation. Thus, tooth surface area was assessed by quantifying the amount of white pixels of the cropped tooth surface area. This process was repeated in the post-operative photo as well [Figures 7 and 8].
Figure 4.
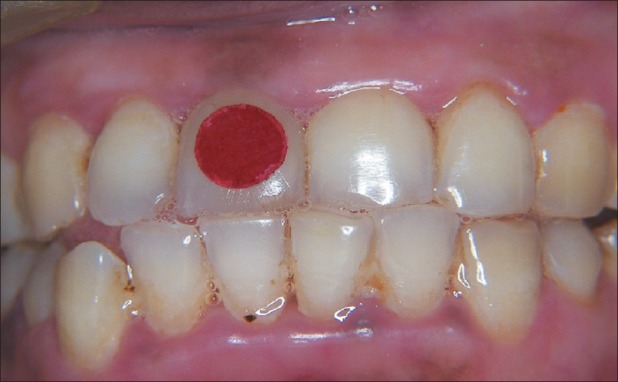
Post-treatment photograph of healthy gingiva taken after a month
Figure 5.
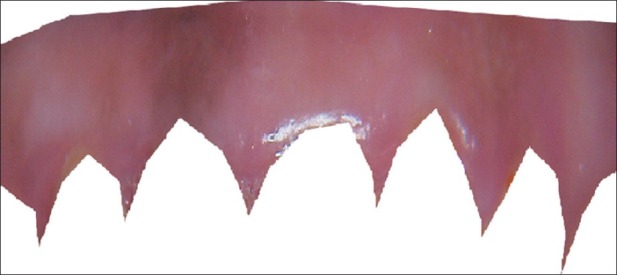
Area of healthy gingiva was cropped to obtain histogram reading
Figure 6.
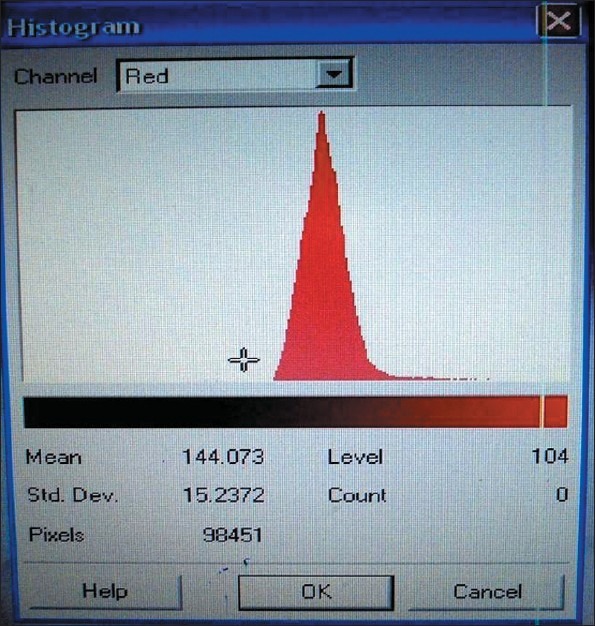
Histogram reading showing mean, standard deviation, pixels of red/white, highest level of pixel count, total pixel counts obtained for each photo
Figure 7.

Area of the tooth which was covered by gingiva
Figure 8.
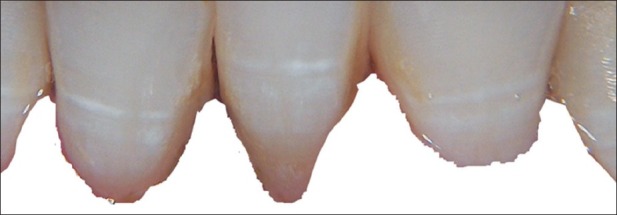
Increase in the area of the tooth which was uncovered by gingiva due to reduction in the gingival inflammation after 1 month
Statistical analysis
The histogram reading [Figure 6] for mean, standard deviation, pixels of red/white, highest level of pixel count, and total pixel counts was obtained for each photo for both the gingival redness and gingival swelling assessments and was subjected to statistical evaluation. Paired t-test was used to evaluate the difference between the pre-treatment and post-treatment groups for both the gingival redness and gingival swelling assessments.
RESULTS
In case of gingival redness assessment [Table 1], borderline significant difference was found in red pixel counts which were measured at the highest level pixels during evaluation, with the graph plotted in the histogram for before and after treatment groups. In case of gingival swelling assessment [Table 2], statistical difference was found in relation to all the parameters measured, except while assessing the highest level pixels measured during evaluation, with the graph plotted in the histogram for the cropped teeth area for the surface area of the tooth not covered by gingiva between the pre-treatment and post-treatment groups.
Table 1.
Paired t-test used to evaluate the pre- and post-treatment changes in gingival redness

Table 2.
Paired t-test used to evaluate the pre- and post-treatment changes in gingival swelling

DISCUSSION
The variables chosen for this study were derived keeping the current technology and the need to provide objective results as far as possible in mind.[7] According to some reports, the camera-based digital imaging system was shown to be a reproducible and reliable means of measuring tooth color in both in vitro and in vivo experiments.[8,9] Therefore, the choice of assessing color and area change considered in this study seemed reasonable.
A standard red color disk was used as there can be minute positional and illumination difference between the images, which cannot be totally removed even in our standardization system.[7] Subtraction of the red disk mean red pixel value from that of the visible gingiva on all visits enabled any systematic difference to be accounted for. Therefore, the remaining changes could be attributed to changes in gingival inflammation.[7]
In gingival redness assessment [Table 1], borderline significant difference was found in red pixel counts, which was obtained at the highest level of pixels measured in graph for before and after treatment groups. However, no statistically significant difference was found in relation to the gingival mean redness, standard deviation of the redness of the gingiva of the cropped area, total amount of red pixels of the cropped area, in the highest level of pixels measured in the graph plotted by the histogram for the pre-treatment and post-treatment groups.
In gingival swelling assessment [Table 2], statistically significant difference was found in relation to the teeth mean white pixels, standard deviation of the white pixels in the histogram, total count of white pixels obtained at the highest level of the graph plotted by the histogram, except for the highest level of pixels measured in the graph plotted for the cropped teeth area between the pre-treatment and post-treatment groups.
In the group of patients examined, whilst good measurable improvements were seen for some patients, the overall results within the group may have been adversely affected by some patients showing a poor response to treatment. There are restrictions of the image assessment due to selection of the area of interest and only anterior part of the oral cavity can be assessed. Although the main inflammatory response is pronounced and largely limited to the gingival margin,[10] the method used total red pixel values from the cropped gingival area which included marginal and attached gingiva, but this included subtle changes from other parts of gingiva as well, i.e. attached gingiva.[7] As the method was reliable, this inclusion should not mask the changes at the gingival margin.
As reported in some studies done earlier in relation to the gingival redness, gingival swelling, plaque, etc., there was no statistical difference between the two examiners and within the examiners. It was decided that one examiner will be taking the photos of the area of interest. Since it is not a new method, it was not validated/compared against an established/standard method of assessment.
Clinical significance
This method helps in providing pictorial data confirmed with the objective data, which match the clinical changes in color and size of the gingiva, which otherwise usually will be recorded using the standard index method by giving suitable scores in which there is a chance of subjective error due to giving higher or lower score. Thus, it helps to motivate the patients for regular follow-ups.
Limitations
Much better patient sample would have given a better clinical picture in relation to gingival redness. Image analysis using MATLAB software would give more precise readings than the software used in this study.
CONCLUSION
Quantitative analysis of swelling and color characteristics of gingiva by digital images may become a valuable, objective, predictable, non-index, and inexpensive evaluation procedure of gingival inflammation.
ACKNOWLEDGMENT
We hereby declare that there is no financial support from whatsoever sources and no conflict of interest.
Footnotes
Source of Support: Nil
Conflict of Interest: None declared
REFERENCES
- 1.Russell AL. A system of classification and scoring for prevalence surveys of periodontal disease. J Dent Res. 1956;35:350–9. doi: 10.1177/00220345560350030401. [DOI] [PubMed] [Google Scholar]
- 2.Harris TH, Ewalt JR. Complications following the use of sodium diphenyldantoinate (dilatin) therapy. J Okla State Med Assoc. 1942;35:365–70. [Google Scholar]
- 3.Seymour RA, Smith DG, Turnbull DN. The effect of phenytoin and sodium volproate on the periodontal health of adult epileptic patients. J Clin Periodontol. 1985;12:413–9. doi: 10.1111/j.1600-051x.1985.tb01377.x. [DOI] [PubMed] [Google Scholar]
- 4.Ellis JS, Seymour RA, Robertson P, Butler TJ, Thomason JM. Photographic scoring of gingival overgrowth. J Clin Periodontol. 2001;28:81–5. doi: 10.1034/j.1600-051x.2001.280112.x. [DOI] [PubMed] [Google Scholar]
- 5.Smith RN, Brook AH, Elcock C. The quantification of dental plaque using an image analysis system: Reliability and validation. J Clin Periodontol. 2001;28:1158–62. doi: 10.1034/j.1600-051x.2001.281211.x. [DOI] [PubMed] [Google Scholar]
- 6.Smith RN, Rawlinson A, Lath D, Elcock C, Walsh TF, Brook AH. Quantification of dental plaque on lingual tooth surfaces using image analysis: Reliability and validation. J Clin Periodontol. 2004;31:569–73. doi: 10.1111/j.1600-051X.2004.00523.x. [DOI] [PubMed] [Google Scholar]
- 7.Smith RN, Lath DL, Rawlinson A, Karmo M, Brook AH. Gingival inflammation assessment by image analysis: measurement and validation. J Dent Hygiene. 2008;6:137–42. doi: 10.1111/j.1601-5037.2008.00294.x. [DOI] [PubMed] [Google Scholar]
- 8.Smith RN, Collins LZ, Naeeni M, Joiner A, Philpotts CJ, Hopkinson I, et al. The in vitro and in vivo validation of a mobile non-contact camera-based digital imaging system for tooth colour measurement. J Dent. 2008;36(Suppl 1):S15–20. doi: 10.1016/j.jdent.2008.02.002. [DOI] [PubMed] [Google Scholar]
- 9.Luo W, Westland S, Brunton P, Ellwood R, Pretty IA, Mohan N. Comparison of the ability of different colour indices to assess changes in tooth whiteness. J Dent. 2007;35:109–16. doi: 10.1016/j.jdent.2006.06.006. [DOI] [PubMed] [Google Scholar]
- 10.Claffey N. Plaque induced gingival disease. In: Lindhe J, Karring T, Lang NP, editors. Clinical Periodontology And Implant Dentistry. 4th ed. New Delhi: Jaypee Brothers Medical Publishers; 2010. pp. 198–201. [Google Scholar]


