

Abstract
Background
Risk scores calculated from electronic patient records can be used to predict the risk of adults developing diabetes in the future.
Aim
To use a risk-prediction model on GPs’ electronic health records in three inner-city boroughs, and to map the risk of diabetes by locality for commissioners, to guide possible interventions for targeting groups at high risk.
Design and setting
Cross-sectional analysis of electronic general practice records from three deprived and ethnically diverse inner-city boroughs in London.
Method
A cross-sectional analysis of 519 288 electronic primary care records was performed for all people without diabetes aged 25–79 years. A validated risk score, the QDScore, was used to predict 10-year risk of developing type 2 diabetes. Descriptive statistics were generated, including subanalysis by deprivation and ethnicity. The proportion of people at high risk (≥20% risk) per general practice was geospatially mapped.
Results
Data were obtained from 135 out of 145 general practices (91.3%); 1 in 10 people in this population were at high risk (≥20%) of developing type 2 diabetes within 10 years. Of those with known cardiovascular disease or hypertension, approximately 50% were at high risk. Male sex, increasing age, South Asian ethnicity, deprivation, obesity, and other comorbidities increased the risk. Geospatial mapping revealed hotspots of high risk.
Conclusion
Individual risk scores calculated from electronic records can be aggregated to produce population risk profiles to inform commissioning and public health planning. Specific localities were identified (the ‘East London diabetes belt’), where preventive efforts should be targeted. This method could be used for other diseases and risk states, to inform targeted commissioning and preventive research.
Keywords: diabetes mellitus, type 2; risk; QDScore, QDiabetes, electronic medical record; general practice; public health
INTRODUCTION
The prevalence of diabetes is increasing rapidly, with current projections estimating a global increase in prevalence of 50.7% between 2011 and 2030.1 The growing burden of diabetes, alongside other non-communicable diseases such as cardiovascular disease, respiratory disease, and cancers, has been met with a call from the United Nations General Assembly to strengthen population-wide interventions, primary care services, and disease monitoring across the whole population.2
Currently in England, approximately 3.1 million people aged 16 years and above have diabetes. This figure is expected to increase to 4.6 million by 2030, as a result of ageing, changes in the ethnic composition of the population, and rising obesity levels.3 Social and ethnic differences are prominent. For example, South Asian and black groups have a rate of type 2 diabetes that is six- and threefold greater than the white population respectively,4 and those in the most affluent quintile of the population (<55 years) have half the prevalence of those in the most deprived quintile.5
There has been much interest in predicting the risk of developing type 2 diabetes and other non-communicable diseases, with the aim of preventing disease and reducing the burden on the health service.6–8 A recent systematic review identified 145 different models and scores for predicting the risk of developing type 2 diabetes and highlighted seven, suitable for routine use, that had a balanced combination of statistical accuracy and usability.9 Some were suitable for use with population-wide electronic primary care records. One of these, the QDScore,7 also had high adaptability in socially complex populations, as its variables take account of ethnic diversity and socioeconomic deprivation. It is available online, as an integral part of EMIS Web (Egton Medical Information System),10 is open source (www.qdscore.org/), and has recently been renamed QDiabetes.
The aim of this cross-sectional study was to use the QDScore on an entire set of electronic primary care records in three deprived and ethnically-diverse inner-city boroughs, to generate population estimates of risk to inform possible interventions for targeting subgroups at high risk.
METHOD
The research was undertaken on 519 288 electronic primary care records across 135 out of 145 general practices in the boroughs of Tower Hamlets, Newham, and City and Hackney, in London, UK. The methods have been previously described.11,12 In summary, a cross-sectional analysis was undertaken in August 2011 of all adults aged 25–79 years without diabetes. Individuals with a Read Code for diabetes were excluded.
Anonymised data were extracted from electronic health records in general practices using EMIS Web, via NHS N3 networks, and securely held by the Clinical Effectiveness Group at Queen Mary, University of London. The 10 clinical variables needed to calculate the QDScore7 were extracted from the records: age, sex, ethnicity, Townsend score of deprivation, family history of diabetes, personal history of cardiovascular disease, smoking status, hypertension treated with pharmacological therapy, current corticosteroid use, and body mass index (BMI). The additional clinical variables: QRisk score (www.qrisk.org — in those aged >30 years), diagnosed hypertension without pharmacological therapy, and estimated glomerular filtration rate (eGFR) were also extracted.
How this fits in
Individual risk scores can be aggregated and used to map overall risk in a population. Identifying populations at high risk of chronic disease could improve targeting of risk-reduction interventions. Accurate description of subgroups at risk has a high potential to inform commissioning. The methodology described here could help support further research into interventions aimed at reducing the risk of chronic diseases.
The QDScore, which undergoes regular updates, was supplied as an electronic batch processor by the authors (J Hippisley-Cox, personal communication, 2011) and used to calculate the 10-year risk of developing type 2 diabetes.7 Basic descriptive statistics were compiled using Stata (version 10). The risk of type 2 diabetes was categorised as low (0–9.99% risk at 10 years), medium (10–19.99%), or high (≥20%).
Subgroup analyses using descriptive statistics, with variables used to calculate the QDScore (age, sex, ethnicity, deprivation, personal history of cardiovascular disease, hypertension treated with pharmacological therapy, and BMI), and the additional clinical variables not included in the score, were undertaken. These variables were selected after discussion among the research team, local GPs, and public health specialists, as to which would be most useful to inform commissioning of public health interventions.
Subgroups with higher risk were not unexpected, as certain predictor variables within the QDScore lead to a higher score (for example, certain ethnicities). Therefore, statistical collinearity between the outcome (% risk) and the predictor variables rendered tests of significance misleading.
Additionally, geospatial maps were created to further assess the usefulness for commissioning. Using the EMIS code of each general practice, it was possible to identify all registered patients aged 25–79 years at high risk of diabetes per practice (as the numerator), and all patients aged 25–79 years without diabetes as the denominator, therefore allowing determination of the proportion at high risk for each general practice. The proportions of high-risk individuals per practice were mapped using a Kriging procedure in ArcGIS, which generated a heat map on the basis of a semi-variogram algorithm.13
Further details on methodology, including how missing values are handled, can be found in Appendix 1.
RESULTS
Clinical variables for risk calculation were extracted from 135 out of 145 practices. Of the 10 practices not included in the study, one did not share data, four used non-EMIS-based systems, and five had technical problems that prevented access to data. A small number of individual records were classified as confidential and could not be accessed. Table 1 shows the flow of data through the study.
Table 1.
Flow of data through the study
| Population size | |
|---|---|
| Registered with a general practice | 881 896 |
| Aged 25–79 years | 568 843 |
| Free from known diabetes | 530 448 |
| Data available for analysis | 519 288 |
The distribution of the QDScore was heavily skewed to the right. Overall, one in 10 people (n = 51 061) in this inner-city population were at high risk (≥20%) of developing type 2 diabetes within 10 years (Table 2). The risk of developing type 2 diabetes rose with age, from 2.1% of 25–39 year olds (n = 6225) at high risk to 20.1% of 40–79 year olds (n = 44 842). More than twice as many South Asian individuals (16.4%) were at high risk compared to the white (7.5%) population.
Table 2.
Proportion of individuals at low, high, and medium risk of developing type 2 diabetes over the next 10 years
| 10-year risk of developing type 2 diabetes (%) | Number of people in category | % of sample | Sex, % male | Median score | Median age, years | White % (n = 214 542) | South Asian % (n = 135 000) | Black % (n = 82 036) |
|---|---|---|---|---|---|---|---|---|
| 0–9.9 (low) | 410 801 | 79.1 | 53.0 | 1.8 | 34 | 83.2 | 69.4 | 72.4 |
| 10–19.9 (medium) | 57 426 | 11.1 | 55.4 | 13.8 | 49 | 9.4 | 14.2 | 15.3 |
| 20–100 (high) | 51 061 | 9.8 | 56.4 | 30.9 | 54 | 7.5 | 16.4 | 12.3 |
| Total | 519 288 | 100 | 53.6 | 2.8 | 37 | 100 | 100 | 100 |
South Asian ethnicity was a strong contributor to risk in non-deprived subpopulations. The most affluent South Asians (Townsend score –6 to 3) had a higher proportion of individuals at high risk than the most deprived at high risk from all ethnic groups, demonstrating the contribution of ethnicity to risk (Figure 1).
Figure 1.
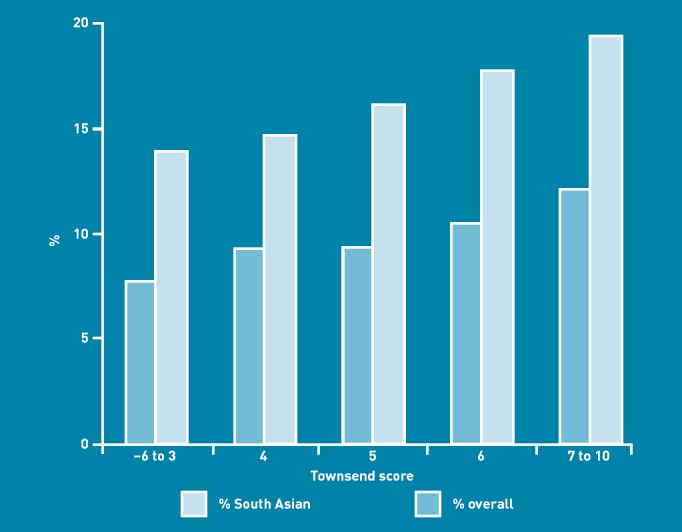
Proportion of adults at high risk of developing type 2 diabetes in each Townsend score band.
Cardiovascular risk as estimated by QRisk was closely associated with high risk of type 2 diabetes. For QRisk 0–9, 9.7% (n = 15 516) were at high risk for type 2 diabetes, compared to 31.1% (n = 12 487) for QRisk 10–19, and 47.7% (n = 9839) for QRisk ≥20 (Figure 2).
Figure 2.
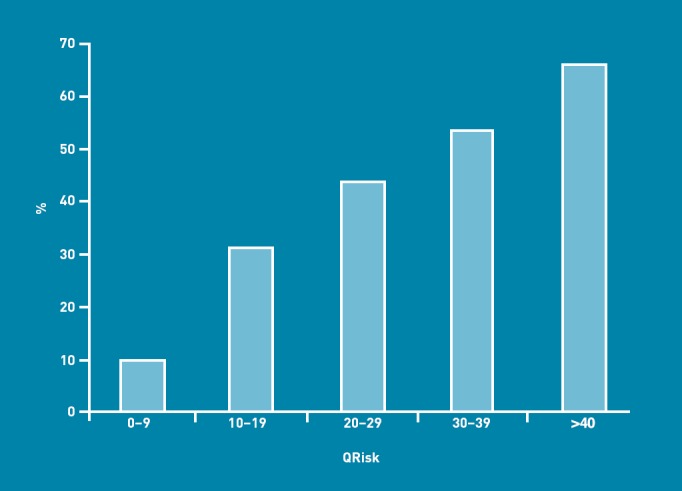
Proportion of adults aged >30 years in each QRisk band at high risk of developing type 2 diabetes.
Similarly, vascular comorbidity, eGFR (<60 ml/min/1.73 m2, chronic kidney disease stage >3), and increasing BMI all increased the chance of being high risk for developing type 2 diabetes (Table 3). QRisk, eGFR and diagnosed hypertension without pharmacological therapy were not included as predictor variables in the QDScore. All other variables presented were also predictor variables; therefore, the results are not unexpected.
Table 3.
Proportion of people at high risk in various comorbidity groups
| Number of people at high risk | Number of people in category | Proportion at high risk | |
|---|---|---|---|
| CVD (IHD/stroke/TIA) | 5637 | 9864a | 57.1 |
| BMI ≥30 kg/m2 | 32 564 | 76 162 | 42.8 |
| Hypertension (diagnosed ± pharmacological therapy) | 23 102 | 48 169b | 48.0 |
| eGFR<60 ml/min/1.73 m2 | 2905 | 7026 | 41.3 |
| QRisk≥20 | 9839 | 20 629 | 47.7 |
CVD = cardiovascular disease. eGFR = estimated glomerular filtration rate. IHD = ischaemic heart disease. TIA = transient ischaemic attack.
9805 of 9864 had the diagnosis included in the QDScore calculator, as nine codes were added later for subgroup analysis which should have been included in the original score calculation.
37 394 had treated hypertension with pharmacological therapy and this diagnosis was included in the QDscore calculation.
Figure 3 shows the proportion of people at the level of an individual general practice at high risk of developing type 2 diabetes within 10 years. The prevalence of high diabetes risk varied from 4.1% to 16.7% across the region. The ‘East London diabetes belt’ stretches from Tower Hamlets in the west, with a large Bangladeshi population, to north-east Newham, where there is a high proportion of South Asian and black ethnic groups. Affluent riverside properties in the south, and parkside residences in the north, show low levels of risk for type 2 diabetes.
Figure 3.
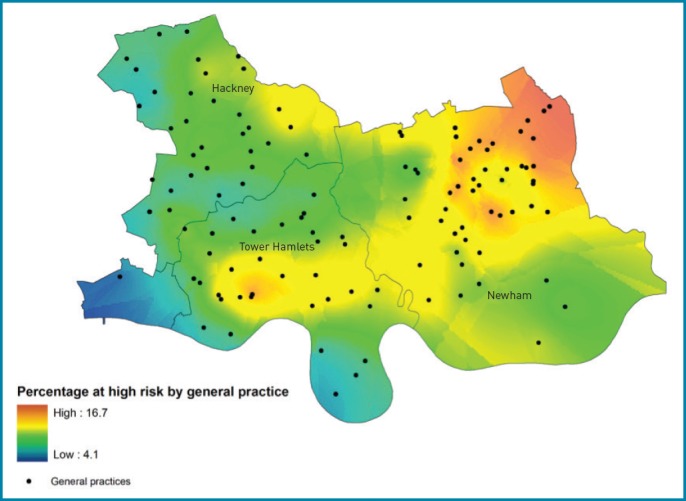
Proportion of people at high risk of type 2 diabetes (≥20%) by general practice: The ‘East London diabetes belt’.
DISCUSSION
Summary
This research successfully used a risk-prediction model on half a million electronic records to describe the socially patterned risk of developing type 2 diabetes for an entire inner-city population. Overall risk was high, with 10% of all adults aged 25–79 years at high risk of developing type 2 diabetes; this is in addition to 7% of the population who are already known to have type 2 diabetes.11 Male sex, increasing age, South Asian and black ethnicity, deprivation, cardiovascular comorbidity, and obesity were all associated with increased risk. The overlap with QRisk was extensive. The extent of these findings locally was quantified. Although the results are not surprising, as QDScore assigns higher values to known risk factors, detailed population subgroup analyses have high potential to inform targeted interventions. Mapping risk revealed the ‘East London diabetes belt’ which, like the ‘diabetes belt’ in the southern states of the US,14 corresponds to high prevalence of known risk factors in the local population and has high potential to inform the work of commissioners locally and nationally, with a view to taking action to reduce the incidence of type 2 diabetes through locality-based interventions, particularly in regard to the ‘Olympic legacy, which holds the promotion of healthier lifestyles and the reduction of premature causes of death as key actions to be implemented by 2015. The predicted positive impacts on individual health will likely decrease diabetes risk across the east London population.15 In some areas, almost one in six adults fell into the ‘high-risk’ category.
Strengths and limitations
The study dataset had high completeness due to previous investment and long-standing supportive collaboration between the university, general practices, and the primary care trusts. This study demonstrates the type of population statistics that can be generated using a risk-prediction model on electronic records, and the rich level of detail that subgroup analysis can generate. For example, knowing the proportion of an ethnic group at high risk has the potential to inform targeted preventive measures and social marketing.
The QDScore has only been validated to estimate the risk of diabetes for individuals aged 25–79 years. A large proportion of those registered with a GP (n = 313 053; 35.5%) was outside this age range, reflecting the young population. Type 2 diabetes is increasingly common in younger age groups, making this a weakness of the study.
Collinearity between outcome and predictor variables prevented tests of statistical significance, but as the principle purpose of the descriptive statistics is for service planning, and trends were very clear (for example, association with ethnicity), this is unlikely to impact on the routine use of such data.
The QDScore is also available for incorporation into the routine electronic primary care record system, which is informative for individual patient consultations. The use of the score for individual patient management was outwith the scope of this population-level research. It was also not the intention to validate the score or assess the impact of components on risk, as this has already been undertaken in prospective independent samples.7,16
Comparison with existing literature
While many studies describing risk models and scores exist,9,17,18 relatively few validated scores have described ‘real-world’ applications as in this study. The Finnish Type 2 Diabetes Risk Score (FINDRISC) was used in a survey of 400 adults aged 20–73 years in Libya; approximately 12% were at high or very high risk of developing diabetes over 10 years.19 Both FINDRISC and the Indian Diabetes Risk Score were used on 198 migrants in Norway identified through mosques, Norwegian classes, and directly in shops and on the street; with FINDRISC, 29% were at great/extreme risk (the two highest categories) over 10 years.20 However, these studies were small and exploratory, and were focused mainly on identifying individuals rather than managing risk in entire populations.
Despite the emerging ability to quantify diabetes risk, reliable information on evaluated and effective interventions for those at high risk is lacking. The evidence base for public health interventions that reliably reduce the risk (and therefore incidence) of type 2 diabetes is currently mainly limited to those with abnormal glycaemic indices. People with impaired glucose tolerance can reduce their risk of developing type 2 diabetes via lifestyle interventions that promote dietary improvement and more physical activity, and by pharmacological therapy.21 At the population level for individuals without diabetes (who may or may not have abnormal glycaemic indices), research indicates that the more behavioural goals that can be attained over time (controlling weight, diet, and physical activity), the lower the incidence of type 2 diabetes in the long term.22 The effectiveness of population-level strategies for reducing the risk of type 2 diabetes could benefit from further study and evaluation.
Implications for practice and research
In May 2011, the UK National Institute for Health and Clinical Excellence (NICE) produced guidance on population and community interventions aimed at preventing diabetes.4
Several generic principles relevant to many public health areas underpin the NICE guidance for populations and communities:4
behaviour change through education;
supportive personal health plans;
weight management through healthier eating (for example ‘five a day’) and interventions aimed at weight reduction that are measured, specific, and individual;
physical activity including 30 minutes 5 days a week; and
cultural sensitivity to ensure that interventions take account of language, educational barriers, religion, and cultural norms.
Eleven specific recommendations are made. Many are expressed in generic terms, covering strategy, health promotion, education, physical activity, healthy eating, and targeted prevention.
NICE concluded that less expensive population-wide interventions have to be combined with effective individual interventions targeted at those at high risk.4 This approach is consistent with the Marmot review’s recommendation of proportionate universalism: that is, in order to tackle health inequalities across all of society, public health action should be appropriate for everyone, but proportionally more for those whose need is highest.23
This study offers an approach that could be used to help achieve this dual objective. Black and minority ethnic groups and people from deprived areas are known to be at much greater risk of type 2 diabetes, and the presence of pre-existing cardiovascular disease puts such people in ‘triple jeopardy’. Analysis of electronic records allows health planners to identify ‘locality hotspots’, specific high-risk individuals, and the level of risk across the entire population, with a view to achieving proportionate universalism in a chosen disease area.
Although beyond the findings in this paper, it is of interest that a second set of NICE guidelines specifically considers interventions for individuals at high risk.24 The recommendations in this report consider two broad areas: identification of high-risk individuals; and individual interventions to reduce risk. The former, using a validated algorithm such as the QDScore, could be incorporated into the English NHS Health Check programme (http://www.healthcheck.nhs.uk/). Using a validated tool such as the QDScore could result in more accurate identification of high-risk individuals for further follow-up and interventions. The use of electronic ‘batch processors’ to calculate population estimates of risk at practice or small area level, for use by providers and commissioners, thus complements individual risk ascertainment by informing neighbourhood and practice risk profiles.
This study has demonstrated the significant overlap between being at high risk of diabetes and being at high risk of cardiovascular disease. For example, of those with a QRisk score ≥20 (meaning ≥20% risk of developing cardiovascular disease in 10 years), 48% were also at high risk (≥20%) for developing type 2 diabetes. This underlines a potential need to combine preventive interventions for these common conditions with overlapping risk factors, pending further study.
At local level, risk-scoring systems can illustrate detailed population-level risk distributions, including high-risk groups, and have the potential to guide targeted interventions for high-risk neighbourhoods and ethnic groups. These descriptive findings have high potential for informing local populations, commissioners, and also future studies of population-level interventions.
Appendix 1. Data supplement
The QDScore electronic batch processor (risk engine v. 1.0.0.1; 2009.05.06) was used. Missing values for certain variables are handled by the QDScore by assigning the risk associated with an imputed or default value: ethnicity defaults to white; smoking status defaults to non-smoker;a Townsend score of deprivation defaults to a score of 0 (the national average); BMI is substituted with an imputed value based on a prediction algorithm using age, sex, ethnicity, smoking status, treated hypertension, and cardiovascular disease. BMI values <15 or >54 were substituted with these values respectively. Other values only contributed to the risk score if positive.
Completeness of variables that were routinely collected on the general practice electronic records (n = 519 288) was as follows: age (100%), sex (100%), ethnicity (91.6%), Townsend deprivation score (99.8%), BMI (76.5%), and smoking status (96.4%). Other predictor variables were only recorded if positive: family history of diabetes (22.9%), personal history of cardiovascular disease (1.9%), treated hypertension with pharmacological therapy (7.2%), and current corticosteroid usage (1.0%). Additional variables were also only recorded if positive: diagnosed hypertension without pharmacological therapy (2.1%), and estimated glomerular filtration rate <60 (1.4%). QRisk was recorded for 53.8% of individuals >30 years (n = 410 874), and 24.2% of the sample were smokers. Of the predictor variables with missing values where a substituted value was used: ethnicity defaulted to white (10.7%);b smoking was classified as smoker (3.6%); Townsend score defaulted to 0 (0.2%); BMI used an imputed value (23.5%; ranging from BMI 21.8–31.4); BMI of 15 or 54 was substituted for values above (0.14%) or below (0.08%) these thresholds.
In this dataset missing smoking status (n = 18 550; 3.6%) was classified as smoker rather than non-smoker. Replacing the missing status with non-smoker had no substantial effect on our results. Category of risk remained the same to one decimal place (low 79.1%; medium 11.1%; high 9.8%). Median risk for the entire dataset remained the same at 2.84. Effect on imputed BMIs was also very small (mean BMI increased from 26.21 to 26.25, and proportion at high risk with a BMI ≥30 decreased from 42.76% to 42.74%).
Includes not stated, refused or unusable code.
Funding
The study was funded by Tower Hamlets, Newham, and City and Hackney Primary Care Trusts, and an MRC fellowship (G0802447) for Dianna Smith. The primary care trusts funded the research in return for a separate report on diabetes risk. The funders had no role in the analysis of data or the content of the final manuscript.
Ethical approval
The study did not require research ethics approval because it consisted of anonymised extraction of routinely held data with aggregated reporting and was therefore covered by existing arrangements held by the clinical effectiveness group.
Provenance
Freely submitted; externally peer reviewed.
Competing interests
John Robson was an author of the QDScore. The other authors have declared no competing interests.
Discuss this article
Contribute and read comments about this article on the Discussion Forum: http://www.rcgp.org.uk/bjgp-discuss
REFERENCES
- 1.Whiting DR, Guariguata L, Weil C, Shaw J. IDF diabetes atlas: global estimates of the prevalence of diabetes for 2011 and 2030. Diabetes Res Clin Pract. 2011;94(3):311–321. doi: 10.1016/j.diabres.2011.10.029. [DOI] [PubMed] [Google Scholar]
- 2.United Nations General Assembly. Political declaration of the High-level Meeting of the General Assembly on the Prevention and Control of Non-communicable Diseases. http://www.un.org/ga/search/view_doc.asp?symbol=A/66/L.1 (accessed 3 Sep 2012)
- 3.Holman N, Forouhi NG, Goyder E, Wild SH. The Association of Public Health Observatories (APHO) Diabetes Prevalence Model: estimates of total diabetes prevalence for England, 2010–2030. Diabet Med. 2011;28(5):575–582. doi: 10.1111/j.1464-5491.2010.03216.x. [DOI] [PubMed] [Google Scholar]
- 4.National Institute for Health and Clinical Excellence. Preventing type 2 diabetes: population and community interventions. Public health guidance 35. London: NICE; 2011. http://guidance.nice.org.uk/PH35 (accessed 21 Aug 2012) [Google Scholar]
- 5.National, Clinical, Audit, Support, Programme. National diabetes audit executive summary 2008/9. London: NHS National Information Centre; 2009. [Google Scholar]
- 6.Hippisley-Cox J, Coupland C. Predicting the risk of chronic kidney disease in men and women in England and Wales: prospective derivation and external validation of the QKidney Scores. BMC Fam Pract. 2010;11:49. doi: 10.1186/1471-2296-11-49. [DOI] [PMC free article] [PubMed] [Google Scholar]
- 7.Hippisley-Cox J, Coupland C, Robson J, et al. Predicting risk of type 2 diabetes in England and Wales: prospective derivation and validation of QDScore. BMJ. 2009;338:b880. doi: 10.1136/bmj.b880. [DOI] [PMC free article] [PubMed] [Google Scholar]
- 8.Hippisley-Cox J, Coupland C, Vinogradova Y. Predicting cardiovascular risk in England and Wales: prospective derivation and validation of QRISK2. BMJ. 2008;336(7659):1475–1482. doi: 10.1136/bmj.39609.449676.25. [DOI] [PMC free article] [PubMed] [Google Scholar]
- 9.Noble D, Mathur R, Dent T, et al. Risk models and scores for type 2 diabetes: systematic review. BMJ. 2011;343:d7163. doi: 10.1136/bmj.d7163. [DOI] [PMC free article] [PubMed] [Google Scholar]
- 10.Egton Medical Information Systems Ltd. EMIS Web. Leeds: EMIS. http://www.emis-online.com/emis-web (accessed 21 Aug 2012)
- 11.Clinical Effectiveness Group. Diabetes risk 2011. London: Barts and the London School of Medicine and Dentistry; 2011. http://www.icms.qmul.ac.uk/chs/Docs/63543.pdf (accessed 21 Aug 2012) [Google Scholar]
- 12.Noble D, Smith D, Mathur R, et al. Feasibility study of geospatial mapping of chronic disease risk to inform public health commissioning. BMJ Open. 2012;2(1):e000711. doi: 10.1136/bmjopen-2011-000711. http://bmjopen.bmj.com/content/2/1/e000711.full (accessed 21 Aug 2012) [DOI] [PMC free article] [PubMed] [Google Scholar]
- 13.Childs C. Interpolating surfaces in ArcGIS Spatial Analyst. ArcUser. 2004:32–35. July–September. [Google Scholar]
- 14.Barker LE, Kirtland KA, Gregg EW, et al. Geographic distribution of diagnosed diabetes in the U.S.: a diabetes belt. Am J Prev Med. 2011;40(4):434–439. doi: 10.1016/j.amepre.2010.12.019. [DOI] [PubMed] [Google Scholar]
- 15.Wales R, Roberts C, Pipe J, et al. An Olympic legacy for the host boroughs. London: 2009. Strategic Regeneration Framework. http://www.hackney.gov.uk/Assets/Documents/strategic-regeneration-framework-report.pdf (accessed 4 Sep 2012) [Google Scholar]
- 16.Collins GS, Altman DG. External validation of QDSCORE((R)) for predicting the 10-year risk of developing Type 2 diabetes. Diabet Med. 2011;28(5):599–607. doi: 10.1111/j.1464-5491.2011.03237.x. [DOI] [PubMed] [Google Scholar]
- 17.Buijsse B, Simmons RK, Griffin SJ, Schulze MB. Risk assessment tools for identifying individuals at risk of developing type 2 diabetes. Epidemiol Rev. 2011;33(1):46–62. doi: 10.1093/epirev/mxq019. [DOI] [PMC free article] [PubMed] [Google Scholar]
- 18.Collins GS, Mallett S, Omar O, Yu LM. Developing risk prediction models for type 2 diabetes: a systematic review of methodology and reporting. BMC Med. 2011;9:103. doi: 10.1186/1741-7015-9-103. [DOI] [PMC free article] [PubMed] [Google Scholar]
- 19.Abduelkarem AR, Sharif SI, Hammrouni AM, Aldouibi SS, et al. Risk calculation of developing type 2 diabetes in Libyan adults. Practical Diabetes International. 2009;26(4):148–151. [Google Scholar]
- 20.Hjellset VT, Bjorge B, Eriksen HR, Hostmark AT. Risk factors for type 2 diabetes among female Pakistani immigrants: the InvaDiab-DEPLAN study on Pakistani immigrant women living in Oslo, Norway. J Immigr Minor Health. 2011;13(1):101–110. doi: 10.1007/s10903-009-9290-3. [DOI] [PubMed] [Google Scholar]
- 21.Gillies CL, Abrams KR, Lambert PC, et al. Pharmacological and lifestyle interventions to prevent or delay type 2 diabetes in people with impaired glucose tolerance: systematic review and meta-analysis. BMJ. 2007;334(7588):299. doi: 10.1136/bmj.39063.689375.55. [DOI] [PMC free article] [PubMed] [Google Scholar]
- 22.Simmons RK, Harding AH, Jakes RW, et al. How much might achievement of diabetes prevention behaviour goals reduce the incidence of diabetes if implemented at the population level? Diabetologia. 2006;49(5):905–911. doi: 10.1007/s00125-006-0163-1. [DOI] [PubMed] [Google Scholar]
- 23.Marmot M. Fair society healthy lives (the Marmot review) London: UCL Institute of Health Equity; 2010. http://www.instituteofhealthequity.org/projects/fair-society-healthy-lives-the-marmot-review (accessed 21 Aug 2012) [Google Scholar]
- 24.National Institute for Health and Clinical Excellence. Preventing type 2 diabetes — risk identification and interventions for individuals at high risk. Public health guidance PH38. London: NICE; 2012. http://guidance.nice.org.uk/PH38 (accessed 21 Aug 2012) [Google Scholar]