

PTEN is a widely recognized negative regulator of insulin/PI3K signaling. However, little is known about its role in neuronal insulin signaling and insulin resistance. The present study provides evidence that PTEN, paradoxically, positively regulates neuronal insulin signaling and insulin resistance.
Abstract
Lipid and protein tyrosine phosphatase, phosphatase and tension homologue (PTEN), is a widely known negative regulator of insulin/phosphoinositide 3-kinase signaling. Down-regulation of PTEN is thus widely documented to ameliorate insulin resistance in peripheral tissues such as skeletal muscle and adipose. However, not much is known about its exact role in neuronal insulin signaling and insulin resistance. Moreover, alterations of PTEN in neuronal systems have led to discovery of several unexpected outcomes, including in the neurodegenerative disorder Alzheimer's disease (AD), which is increasingly being recognized as a brain-specific form of diabetes. In addition, contrary to expectations, its neuron-specific deletion in mice resulted in development of diet-sensitive obesity. The present study shows that PTEN, paradoxically, positively regulates neuronal insulin signaling and glucose uptake. Its down-regulation exacerbates neuronal insulin resistance. The positive role of PTEN in neuronal insulin signaling is likely due to its protein phosphatase actions, which prevents the activation of focal adhesion kinase (FAK) and extracellular signal-regulated kinase (ERK), the kinases critically involved in neuronal energy impairment and neurodegeneration. Results suggest that PTEN acting through FAK, the direct protein substrate of PTEN, prevents ERK activation. Our findings provide an explanation for unexpected outcomes reported earlier with PTEN alterations in neuronal systems and also suggest a novel molecular pathway linking neuronal insulin resistance and AD, the two pathophysiological states demonstrated to be closely linked.
INTRODUCTION
In addition to its varied role in peripheral tissues, insulin has profound effects in the CNS, where it regulates various key physiological functions, such as food intake, energy homeostasis, reproductive endocrinology, sympathetic activity, peripheral insulin actions, and even learning and memory (Zhao and Alkon, 2001; Plum et al., 2005). Dysfunction of the insulin-signaling pathway in the CNS has been reported to contribute to number of pathophysiological conditions, including hyperphagia, obesity, and type 2 diabetes (Plum et al., 2005). To add to the complications, there is widening recognition that impaired insulin signaling and glucose metabolism in the brain acts as a mediator of the chronic neurodegenerative disorder Alzheimer's disease (AD; de la Monte and Wands, 2008; Deng et al., 2009). Findings that in AD brains the expression/activation of multiple players of the insulin signal transduction cascade such as insulin receptor (IR), phosphatidylinositol 3-kinase (PI3K), Akt, and glycogen synthase kinase 3β (GSK3β) are altered has led to qualification of AD as a brain-specific form of diabetes, and the term “type 3 diabetes” has been proposed for AD (Steen et al., 2005). The molecular mechanism of insulin resistance in neurons remains largely unknown, in contrast to that in peripheral tissues such as skeletal muscle, liver, and adipose, and consequently drug development to treat neuronal insulin resistance and complications associated with it has been nonproductive.
The phosphatases phosphatase and tension homologue (PTEN) and Src homology 2 domain containing inositol 5′ phosphatase 2 (SHIP2) have been widely implicated as negative regulators of insulin/PI3K signaling (Sasaoka et al., 2006). SHIP2 is a lipid phosphatase that hydrolyzes the PI3K product phosphatidylinositol 3,4,5-triphosphate (PI(3,4,5)P3), which serves as a crucial lipid second messenger in various metabolic effects of insulin, to phosphatidylinositol 3,4-biphosphate (PI(3,4)P2), whereas PTEN is a dual-specificity phosphatase that recognizes both lipid and protein substrates (Yamada and Araki, 2001). As a lipid phosphatase PTEN hydrolyzes PI(3,4,5)P3 to PI(4,5)P2, and as a protein phosphatase it directly binds and dephosphorylates focal adhesion kinase (FAK; Besson et al., 1999; Hlobilkova et al., 2003). PTEN has been the focus of intense interest because of its central role as a tumor suppressor. PTEN is one of the most frequently mutated/deleted tumor suppressors in human cancers. It has been reported to regulate a variety of other cellular functions, such as cell division, cell survival, apoptosis, and cell migration. It modulates cell migration and invasion by negatively regulating the signals generated at the focal adhesions, through direct dephosphorylation and inhibition of its protein substrate, FAK (Besson et al., 1999; Hlobilkova et al., 2003).
Because of their lipid phosphatase actions, PTEN and SHIP2 also have negative effects on insulin resistance (Sasaoka et al., 2006). Down-regulation of PTEN in skeletal muscle and adipose tissue protects against insulin resistance and diabetes (Kurlawalla-Martinez et al., 2005; Wijesekara et al., 2005). PTEN and SHIP2 are also expressed in neurons; however, their role in regulation of neuronal insulin resistance has not been demonstrated. Although not much is known about the role of SHIP2 in neurons, loss of PTEN has been shown to result in hyperphosphorylation of tau and neurofilaments (Kerr et al., 2006; Nayeem et al., 2007), the hallmark characteristic associated with AD pathology. These observations were contrary to expectations; in connection with it being considered a negative regulator of insulin/PI3K signaling, PTEN deletion/mutation was expected to improve tau pathologies. In addition, contrary to expectations, deletion of PTEN in pro-opiomelanocortin (POMC) neurons in mice resulted in hyperphagia and development of diet-sensitive obesity (Plum et al., 2006).
The present study investigates the role of the phosphatases PTEN and SHIP2 in the regulation of neuronal insulin resistance, using a drug-validated in vitro neuronal insulin-resistance model (Gupta et al., 2011) and primary cortical neurons.
RESULTS
RNA interference–mediated down-regulation of endogenous PTEN and SHIP2 levels
To examine the role of the phosphatases PTEN and SHIP2 in regulating neuronal insulin resistance, we used RNA interference to suppress endogenous PTEN or SHIP2 levels in a drug-validated, N2A-cell–based, neuronal insulin-resistance model (Gupta et al., 2011). Small interfering RNA (siRNA) duplexes of the sequence specific to PTEN (denoted P1 in Materials and Methods) showed a dose-dependent silencing of PTEN, with maximal silencing at 100 pmol (unpublished data). PTEN-specific siRNA (100 pmol) demonstrated significant PTEN down-regulation (80.2 ± 0.05%) after it was normalized with similar concentration of scrambled siRNA (to determine nonspecific silencing), without affecting cellular morphology and viability as seen by phase contrast microscopy and 3-(4,5-dimethylthiazol-2-yl)-2,5-diphenyltetrazolium bromide (MTT) assay (unpublished data). Similarly, siRNA specific to SHIP2 (denoted S1 in Materials and Methods) showed significant silencing of SHIP2 (73.1 ± 0.06%) at 100 pmol after normalizing it with similar concentration of scrambled siRNA, without affecting cellular morphology and viability (unpublished data).
We next examined the effect of PTEN- or SHIP2-specific or nonspecific (scrambled) siRNA transfection on PTEN and SHIP2 expression in N2A cells differentiated under insulin-sensitive (MF) and insulin-resistant (MFI) conditions, with or without insulin stimulation. The level of PTEN in PTEN siRNA–transfected cells remained down-regulated (∼ 80%) under all the conditions as compared with scrambled siRNA–transfected cells (Figure 1A, panel A, and Figure 1B). Down-regulation of PTEN under all the conditions showed no effect on SHIP2 expression (Figure 1A, panel B, and Figure 1C). Similarly, transfection with SHIP2-specific siRNA resulted in marked reduction (∼70%) of SHIP2 expression under all the conditions as compared with scrambled siRNA–transfected cells (Figure 1A, panel B, and Figure 1C) without any effect on PTEN expression (Figure 1A, panel A, and Figure 1B). No significant change in PTEN and SHIP2 expression was observed under MF and MFI conditions, with or without insulin stimulation (Figure 1, A– C).
FIGURE 1:

Effect of PTEN or SHIP2 down-regulation on impaired Akt and GSK3β phosphorylation. Scrambled or PTEN- or SHIP2-specific siRNA–transfected N2A cells were differentiated in the absence (MF) or chronic presence (MFI) of insulin for 3 d and stimulated with or without insulin (100 nM) for 30 min. (A) Cell lysates were subjected to Western immunoblotting and probed with anti-PTEN (panel A), anti-SHIP2 (panel B), anti-actin (panel C), anti–phospho-Akt (Ser-473; panel D), anti-Akt (panel E), anti-phospho GSK3β (Ser-9; panel F), or anti-GSK3β (panel G) antibodies. (B) Bar diagram representing relative densitometric values of PTEN expression after normalizing with actin expression (PTEN/actin). (C) Bar diagram representing relative densitometric values of SHIP2 expression after normalizing with actin expression (SHIP2/actin). (D) Bar diagram representing relative densitometric values of pAkt (Ser-473) after normalizing with Akt expression (pAkt/Akt). (E) Bar diagram representing relative densitometric values of pGSK3β (Ser-9) after normalizing with GSK3β expression (pGSK3β/GSK3β). All the experiments were repeated thrice, and a representative result is shown. Values are mean ± SE. **p < 0.01 compared with lane 1; $$p < 0.01 compared with lane 2; ##p < 0.01 compared with lane 3; θθp < 0.01 compared with lane 4. Open bars, MF; solid bars, MFI. IB, immunoblotted.
Effect of down-regulation of PTEN or SHIP2 expression on impaired Akt and GSK3β phosphorylation under neuronal insulin resistance
Because of their ability to hydrolyze PI(3,4,5)P3 (i.e., lipid phosphatase action), PTEN and SHIP2 are known to negatively regulate PI(3,4,5)P3-dependent serine/threonine kinase, Akt, and its downstream signaling (Sasaoka et al., 2006). We thus examined Akt (Ser-473) phosphorylation under PTEN or SHIP2 down-regulated conditions. A distinct reduction in insulin-stimulated phosphorylation of Akt was observed under the MFI condition (Figure 1A, panel D, and Figure 1D; lanes 3 and 4 vs. lanes 1 and 2). Down-regulation of PTEN expression resulted in marked enhancement of Akt phosphorylation under both MF and MFI conditions, with or without insulin stimulation (Figure 1A, panel D, and Figure 1D; p < 0.01). Moreover, the impaired Akt phosphorylation observed under the MFI condition was effectively ameliorated (increased by 172.2 ± 0.4%) with PTEN silencing (Figure 1A, panel D, and Figure 1D; lane 8 vs. lane 4, p < 0.01), resulting in comparable Akt phosphorylation to that observed under MF conditions (Figure 1D, lane 8 vs. lane 2). Silencing SHIP2, however, had no significant effect on Akt phosphorylation under all the conditions as compared with respective scrambled siRNA–transfected controls (Figure 1A, panel D, and Figure 1D).
Downstream of Akt, the impaired insulin-stimulated phosphorylation of GSK3β under the MFI condition (Figure 1A, panel F, and Figure 1E) was also effectively ameliorated by PTEN silencing, as evident by an increase of 95.8 ± 0.25% in insulin-stimulated GSK3β phosphorylation as compared with scrambled siRNA–transfected MFI cells stimulated with insulin (Figure 1A, panel F, and Figure 1E). Consistent with Akt results, silencing SHIP2 had no significant effect on GSK3β phosphorylation under all the conditions tested as compared with respective scrambled siRNA–transfected controls (Figure 1E).
Effect of down-regulation of PTEN or SHIP2 on impaired 2-deoxy glucose uptake under neuronal insulin resistance
We next assessed the functional contribution of altered PTEN or SHIP2 expression on glucose uptake. Surprisingly, instead of an expected improvement in 2-deoxy glucose (2-DOG) uptake with PTEN down-regulation, we observed that the impaired insulin-stimulated glucose uptake under the MFI condition was further worsened (Figure 2A, lane 8 vs. lane 4; p < 0.01). In addition, PTEN silencing under the MF condition resulted in complete impairment of insulin-induced glucose uptake (decreased by 37.4 ± 0.06%), similar to that observed under the MFI condition (Figure 2A). As expected, SHIP2 silencing had no effect on 2-DOG uptake under all the conditions as compared with respective scrambled siRNA–transfected controls (Figure 2A). These results were further confirmed by silencing PTEN and SHIP2 using another PTEN-specific (denoted P2 in Materials and Methods) or SHIP2-specific siRNA (denoted S2 in Materials and Methods). PTEN down-regulation with another set of siRNAs (P2) also showed nearly the same decrease in 2-DOG uptake, whereas SHIP2 down-regulation with S2 siRNA had no effect on 2-DOG uptake (unpublished data).
FIGURE 2:

Effect of PTEN or SHIP2 down-regulation on glucose uptake and insulin signaling upstream of Akt. Scrambled or PTEN- or SHIP2-specific siRNA–transfected N2A cells were differentiated in the absence (MF) or chronic presence (MFI) of insulin for 3 d and stimulated with or without insulin (100 nM) for 30 min. (A) Uptake of 2-DOG was measured in 40-μg cell lysates. Uptake of each sample was measured in duplicate. Bar represents fold change in 2-DOG uptake. (B) The cytosolic fractions were isolated, subjected to Western immunoblotting, and probed with anti-GLUT4 (panel A) or anti-tubulin (panel B) antibodies. Total cell lysates (500 μg) were immunoprecipitated with anti–IR-β (for panels C and D) or anti-IRS1 (for panels E and F) antibodies, subjected to Western immunoblotting, and probed with anti-phosphotyrosine (panels C and E), anti–IR-β (panel D), or anti-IRS1 (panel F) antibodies. For checking knockdown of PTEN and SHIP2, cell lysates were subjected to Western immunoblotting and probed with anti-PTEN (panel G), anti-SHIP2 (panel H), or anti-actin (panel I) antibodies. (C) Bar diagram representing relative densitometric values of GLUT4 expression in cytosolic fractions. (D) Primary cortical neurons were transfected with scrambled or PTEN-specific siRNA, and 2-DOG uptake was measured in 40-μg cell lysates. Uptake of each sample was measured in duplicate. Bar represents fold change in 2-DOG uptake. (E) Bar diagram representing relative densitometric values of pIR-β after normalizing with IR-β expression (pIR-β/IR-β). (F) Bar diagram representing relative densitometric values of pIRS1 after normalizing with IRS1 expression (pIRS1/IRS1). (G) Cell lysates (500 μg) were immunoprecipitated with anti-IRS1 antibody, and PI3K activity was measured. Bar represents change in IRS1-associated PI3K activity. All the experiments were repeated thrice, and a representative result is shown. Values are mean ± SE. **p < 0.01 compared with lane 1; *p < 0.05 compared with lane 1; $$p < 0.01 compared with lane 2; ##p < 0.01 compared with lane 3; θθp < 0.01 compared with lane 4. Open bars, MF; solid bars, MFI. IB, immunoblotted; IP, immunoprecipitated.
GLUT4 is an insulin-responsive glucose transporter in neuronal cells (Benomar et al., 2006). Supporting the foregoing observations, significant increases in GLUT4 levels were observed in the cytosolic fraction of PTEN-silenced cells as compared with respective scrambled siRNA–transfected cells (Figure 2B, panel A, and Figure 2C), highlighting impaired translocation of GLUT4 to the plasma membrane (Supplemental Figure S1) and thereby causing reduced glucose uptake under PTEN-silenced conditions. SHIP2 silencing had no significant effect on cytosolic GLUT4 levels under all the conditions (Figure 2B, panel A, and Figure 2C). Total GLUT4 expression was found to be unaltered under all the conditions (unpublished data). The results thus surprisingly highlight positive regulation of glucose uptake by PTEN.
Effect of down-regulation of PTEN on glucose uptake in primary cortical neurons
To further examine the functional relevance of PTEN in regulating glucose uptake in neurons, we measured 2-DOG uptake in PTEN-silenced mouse primary cortical neurons. Consistent with the results obtained in N2A cells, PTEN silencing in primary cortical neurons showed significant decrease (21.4 ± 0.32%) in glucose uptake as compared with scrambled siRNA–transfected primary neurons (Figure 2D; p < 0.01), emphasizing the paradoxical role of PTEN as a positive regulator of glucose uptake in neurons.
Effect of down-regulation of PTEN or SHIP2 on insulin signaling upstream to Akt
After finding these unexpected results of 2-DOG uptake with PTEN silencing, we next accessed the effect of down-regulation of PTEN or SHIP2 on the expression/activation of other important insulin signaling molecules that are upstream to Akt, under MF and MFI conditions, with or without insulin stimulation.
A marked reduction (92.1 ± 2.1%) in insulin-stimulated tyrosine phosphorylation of IRβ was observed under the MFI condition (Figure 2B, panel C, and Figure 2E). PTEN or SHIP2 down-regulation had no significant effect on tyrosine phosphorylation of IR-β under all the conditions as compared with respective scrambled siRNA–transfected cells (Figure 2B, panel C, and Figure 2E). Expression of IR-β was also unaltered by PTEN or SHIP2 silencing (Figure 2B, panel D). However, a marked impairment in insulin-stimulated tyrosine phosphorylation of IRS1 was observed with PTEN silencing under both MF and MFI conditions (Figure 2B, panel E, and Figure 2F). PTEN down-regulation under the MF condition resulted in complete impairment of insulin-induced IRS1 tyrosine phosphorylation, analogous to that observed under the MFI condition (Figure 2B, panel E, and Figure 2F). Expression of IRS1 was unaltered by PTEN silencing (Figure 2B, panel F). SHIP2 silencing had no effect on tyrosine phosphorylation of IRS1 under all the conditions (Figure 2F). Parallel to decrease in tyrosine phosphorylation of IRS1, significant decrease in IRS1-associated PI3K activity was also observed with PTEN silencing under all the conditions (Figure 2G). Results so far thus highlight that although SHIP2 appears to have no role in regulation of neuronal insulin signaling, PTEN is required for normal neuronal insulin signal transduction and glucose uptake, as down-regulation of PTEN expression under the insulin-sensitive condition impairs insulin signaling, and down-regulating its expression under neuronal insulin resistance worsens the condition.
Effect of down-regulation of PTEN on mitogen-activated protein kinase activation
Various studies have shown involvement of mitogen-activated protein kinases (MAPKs) in regulation of glucose uptake in peripheral tissues such as skeletal muscle and adipose (Kumar and Dey, 2002; Fujishiro et al., 2003), although their involvement in regulation of glucose uptake in neuronal systems is not known. Thus to gain further insights into the mechanism(s) resulting in impaired glucose uptake with PTEN down-regulation, we tested effects of PTEN silencing on all three MAPK (extracellular signal-regulated kinase [ERK] 1/2, p38, and Jun N-terminal kinase [JNK]) activation by using phosphospecific antibodies against their activation sites. The effect of SHIP2 down-regulation on MAPK activation was also tested as an additional control.
Instead of its well-known role as a promoter of cell survival, the ERK1/2 pathway has been shown to be involved in the induction of cell death in neurons (Subramaniam et al., 2004; Haddad, 2005), and insulin (by activating PI3K signaling) has been reported to act antagonistically on the ERK pathway to promote cell survival in neurons (van der Heide et al., 2006). We also observed significant reduction in ERK1/2 phosphorylation with insulin stimulation under the insulin-sensitive condition (Figure 3A, panel A, and Figure 3B; lane 2 vs. lane 1; p < 0.01). However, under the MFI condition this decrease in ERK1/2 phosphorylation was considerably impaired (Figure 3A, panel A, and Figure 3B; lane 4 vs. lane 3), resulting in ∼100% increase in their activities. Under the basal MFI condition also, significant increases in ERK1/2 phosphorylation was observed (Figure 3B), demonstrating activation of ERK1/2 under the MFI conditions. Of interest, we observed that PTEN down-regulation resulted in additional activation of ERK1/2 (Figure 3A, panel A, and Figure 3B). Down-regulation of PTEN expression caused striking enhancements of ERK1/2 phosphorylation under both MF and MFI conditions, with or without insulin stimulation, as compared with respective scrambled siRNA–transfected control (Figure 3A, panel A, and Figure 3B). Expression of ERK was unaltered by down-regulation of PTEN (Figure 3A, panel B). Although p38 and JNK were also significantly activated under MFI conditions, PTEN silencing showed no further effect on their activities (Figure 3A, panels C and E, respectively, and Figure 3C). SHIP2 silencing, however, had no significant effect on any of the three MAPKs (Figure 3, A–C).
FIGURE 3.
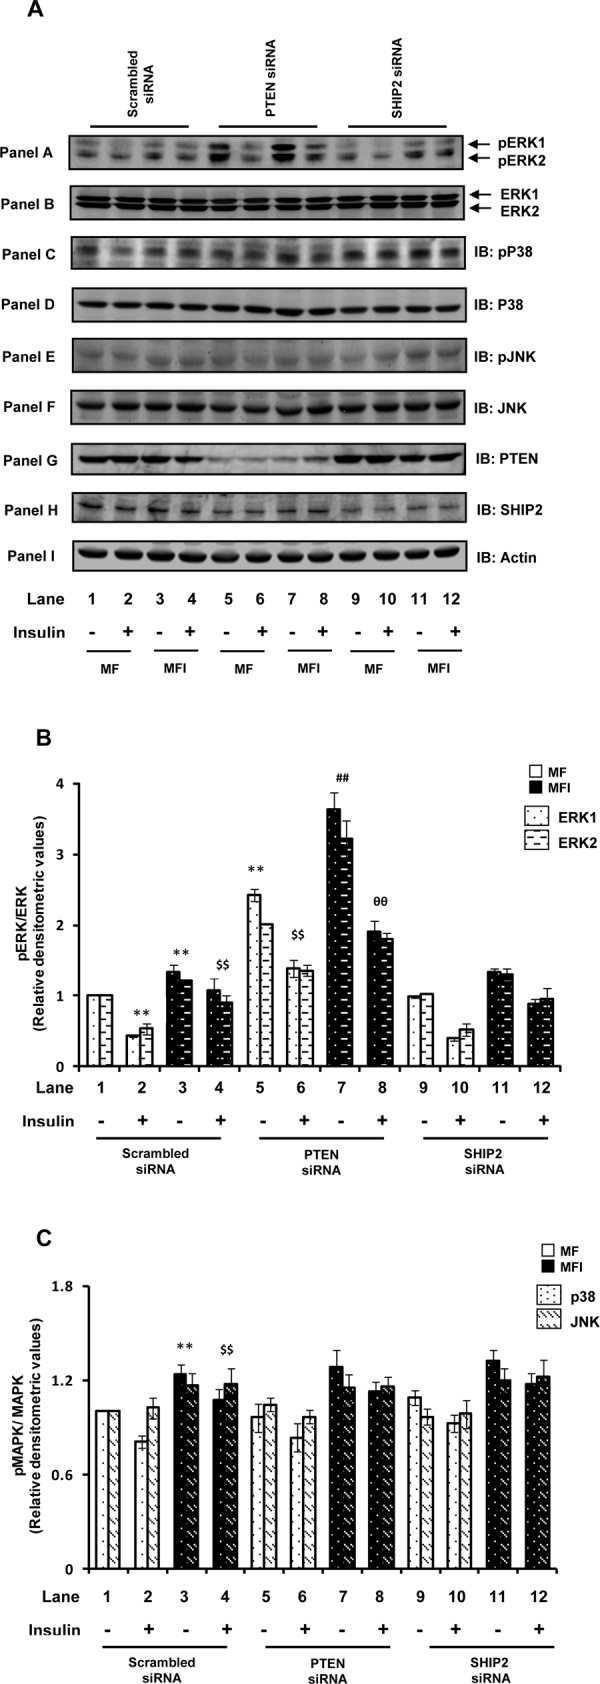
Effect of PTEN or SHIP2 down-regulation on MAPK activation. Scrambled or PTEN- or SHIP2-specific siRNA–transfected N2A cells were differentiated in the absence (MF) or chronic presence (MFI) of insulin for 3 d and stimulated with or without insulin (100 nM) for 30 min. (A) Cell lysates were subjected to Western immunoblotting and probed with anti–phospho-ERK (panel A), anti-ERK (panel B), anti–phospho-p38 (panel C), anti-p38 (panel D), anti–phospho-JNK (panel E), or anti-JNK (panel F) antibodies. For checking knockdown of PTEN and SHIP2, cell lysates were subjected to Western immunoblotting and probed with anti-PTEN (panel G), anti-SHIP2 (panel H), or anti-actin (panel I) antibodies. (B) Bar diagram representing relative densitometric values of pERK after normalizing with ERK expression (pERK/ERK). (B) Bar diagram representing relative densitometric values of pp38/pJNK after normalizing with p38/JNK expression (pMAPK/MAPK). All experiments were repeated thrice, and a representative result is shown. Values are mean ± SE. **p < 0.01 compared with lane 1; $$p < 0.01 compared with lane 2; ##p < 0.01 compared with lane 3; θθp < 0.01 compared with lane 4. Open bars, MF; solid bars, MFI. IB, immunoblotted.
Effect on 2-DOG uptake by ERK inhibition in PTEN–down-regulated conditions
We next asked whether the decrease in glucose uptake with PTEN down-regulation is due to activation of ERK, that is, whether ERK is playing a negative role in regulating neuronal glucose uptake. To address this issue, we inhibited ERK under PTEN–down-regulated conditions using an ERK-specific pharmacological inhibitor, U0126 (25 μM; Harmon et al., 2004; Hayashi et al., 2008), and examined its effect on 2-DOG uptake. Almost complete inhibition of ERK1 and ERK 2 was observed with U0126 pretreatment as compared with respective dimethyl sulfoxide (DMSO; vehicle)–treated cells (Figure 4A, panel A). U0126 treatment showed no effect on phosphorylation of p38 or JNK (Figure 4A, panels C and E, respectively). We observed that ERK inhibition in scrambled siRNA–transfected cells led to marked increase in glucose uptake (Figure 4B). Moreover, ERK inhibition under the MFI condition distinctly ameliorated (increased by 60.4 ± 0.07%) the impaired insulin-stimulated glucose uptake (Figure 4B, lane 8 vs. lane 4). Of interest, the decreased glucose uptake observed under MF conditions with PTEN down-regulation was also restored to normal levels by ERK inhibition (Figure 4B). In addition, the impaired glucose uptake observed under PTEN siRNA–transfected MFI conditions was restored to normal levels (MF) on ERK inhibition (Figure 4B). However, the extent of increase in glucose uptake with ERK inhibition under PTEN siRNA–transfected conditions was not as high as that of ERK inhibited-scrambled siRNA–transfected cells (Figure 4B). This may be due to additional regulation of glucose uptake independent of ERK under PTEN-silenced conditions. The results thus highlight a negative role of ERK in neuronal glucose uptake and suggest that ERK activation is the principal cause for PTEN-down-regulation–mediated impairment of glucose uptake.
FIGURE 4:

Effect of ERK inhibition on PTEN-down-regulation–mediated impaired insulin signaling and glucose uptake. N2A cells were differentiated in the absence (MF) or chronic presence (MFI) of insulin for 3 d and pretreated with vehicle (DMSO) or U0126 (25 μM) for 1 h before stimulation with or without insulin (100 nM) for 30 min. (A) Cell lysates were subjected to Western immunoblotting and probed with anti–phospho-ERK (panel A), anti-ERK antibody (panel B), anti–phospho-p38 (panel C), anti-p38 (panel D), anti–phospho-JNK (panel E), or anti-JNK (panel F) antibodies. (B) Uptake of 2-DOG was measured in the presence of vehicle or U0126 (25 μM). Uptake of each sample was measured in 40-μg cell lysates in duplicate. Bar represents fold change in 2-DOG uptake. (C) Cell lysates (500 μg) were immunoprecipitated with anti-IRS1 antibody, subjected to Western immunoblotting, and probed with anti-phosphotyrosine or anti-IRS1 antibodies. Bar represents relative densitometric values of pIRS1 after normalizing with IRS1 expression (pIRS1/IRS1). (D) Cell lysates (500 μg) were immunoprecipitated with anti-IRS1 antibody, and PI3K activity was measured. Bar represents fold change in IRS1-associated PI3K activity. (E) Cell lysates were subjected to Western immunoblotting and probed with anti–phospho-Akt (Ser-473; panel A), anti-Akt (panel B), anti–phospho-GSK3β (Ser-9; panel C), or anti-GSK3β (panel D) antibodies. (F) Bar diagram representing relative densitometric values of pAkt (Ser-473) after normalizing with Akt expression (pAkt/Akt). (G) Bar diagram representing relative densitometric values of pGSK3β (Ser-9) after normalizing with GSK3β expression (pGSK3β/GSK3β). All experiments were repeated thrice, and a representative result is shown. Values are mean ± SE. **p < 0.01 compared with lane 1; $$p < 0.01 compared with lane 2; ##p < 0.01 compared with lane 3; θθp < 0.01 compared with lane 4, ≠≠p < 0.01 compared with lane 9; γγp < 0.01 compared with lane 10; μμp < 0.01 compared with lane 11; ∆∆p < 0.01 compared with lane 12. Open bars, MF; solid bars, MFI. IB, immunoblotted; IP, immunoprecipitated.
Effect of inhibition of ERK on impaired insulin signaling under neuronal insulin resistance
We next tested the effect of ERK inhibition on impaired insulin signaling under neuronal insulin resistance. ERK has been shown to impair insulin signaling by abrogating IRS1 activation via its serine phosphorylation (Gual et al., 2005). Of interest, consistent with the observed increase in ERK activity with PTEN knockdown, we observed an increase in IRS1 serine phosphorylation under both MF and MFI conditions with down-regulation of PTEN expression (Supplemental Figure S2). We thus tested the effect of ERK inhibition on IRS1 activation in N2A cells differentiated under MF and MFI conditions. A significant increase in IRS1 tyrosine phosphorylation was observed with ERK inhibition under both MF and MFI conditions (Figure 4C). This followed a considerable increase in PI3K activity associated with IRS1 (Figure 4D). Distinct enhancements in Akt and GSK3β phosphorylation were also observed with ERK inhibition under both MF and MFI conditions (Figure 4, E– G), markedly ameliorating the impaired insulin-induced Akt and GSK3β phosphorylation under the MFI condition (Figure 4, E– G). The results thus strongly suggest that inhibition of ERK under the insulin-resistant condition ameliorates the impaired insulin signaling and glucose uptake, at least in part, through the IRS1–PI3K pathway. They also suggest that activation of ERK is a major contributor for impairment of the IRS1–PI3K pathway and glucose uptake with PTEN down-regulation.
Role of PI(3,4,5)P3 in PTEN-down-regulation–mediated activation of ERK
Lipid phosphatase action of PTEN is widely acknowledged for its negative role in insulin signaling, and thus down-regulation of PTEN expression (resulting in increased PI(3,4,5)P3 levels) is known to ameliorate insulin resistance in peripheral tissues. In the present study, however, although down-regulation of PTEN expression increased Akt and GSK3β phosphorylation—the downstream effectors of PI(3,4,5)P3 signaling—its down-regulation exacerbated glucose uptake (due to activation of ERK) under neuronal insulin resistance. We thus next attempted to clarify the role of PI(3,4,5)P3 in PTEN-down-regulation–mediated activation of ERK, which leads to impairment of insulin-induced neuronal glucose uptake. The specific PI3K inhibitor wortmannin inhibits PI3K activity and thereby abrogates PI(3,4,5)P3 production (Okada et al., 1994). Thus we used wortmannin to alter PI(3,4,5)P3 levels under our experimental conditions (Benomar et al., 2006). As expected, wortmannin treatment resulted in complete inhibition of insulin-induced Akt and GSK3β phosphorylation in scrambled siRNA–transfected MF cells (Figure 5A, panels B and D, respectively; lane 3 vs. lane 1). However, with wortmannin treatment in PTEN-silenced conditions a small increase in insulin-induced Akt and GSK3β phosphorylation was still observed (Figure 5A, panels B and D, respectively; lane 4 vs. lane 3). These results are consistent with the fact that the total PI(3,4,5)P3 levels will be higher in PTEN–down-regulated conditions as compared with the control siRNA–treated cells even after wortmannin treatment. Thus the results suggest that the increase in Akt and GSK3β observed with PTEN silencing under our experimental conditions is due to increased PI(3,4,5)P3 levels (i.e., due to the lipid phosphatase action of PTEN).
FIGURE 5:

Role of PI(3,4,5)P3 in PTEN-down-regulation–mediated activation of ERK. Scrambled or PTEN-specific siRNA–transfected N2A cells were differentiated under MF conditions for 3 d and pretreated with vehicle (DMSO) or wortmannin (1 μM) for 30 min before stimulation with insulin (100 nM) for 30 min. (A) Cell lysates were subjected to Western immunoblotting and probed with anti-PTEN (panel A), anti–phospho-Akt (Ser-473; panel B), anti-Akt (panel C), anti–phospho-GSK3β (Ser-9; panel D), anti-GSK3β (panel E), or anti-tubulin (panel F) antibodies. (B) Cell lysates were subjected to Western immunoblotting and probed with anti–phospho-ERK or anti-ERK antibodies. Bar diagram represents relative densitometric values of pERK after normalizing with ERK expression (pERK/ERK). (C) Uptake of 2-DOG was measured in 40-μg cell lysates. Uptake of each sample was measured in duplicate. Bar represents fold change in 2-DOG uptake. All experiments were repeated thrice, and a representative result is shown. Values are mean ± SE. **p < 0.01 compared with lane 1; $$p < 0.01 compared with lane 2. Open bars, vehicle; solid bars, wortmannin. IB, immunoblotted.
It has been reported that in neuronal systems PI3K plays an antagonistic role with regard to the ERK pathway (van der Heide et al., 2006). Consistent with these reports, we observed that wortmannin treatment in scrambled siRNA–transfected cells resulted in a striking increase (∼15-fold) of ERK1/2 phosphorylation (Figure 5B, lane 3 vs. lane 1). Of interest, we observed that wortmannin treatment under the PTEN-silenced condition resulted in further augmentation of ERK1 and ERK2 phosphorylation (increased by 32.4 ± 0.96 and 35.6 ± 1.28%, respectively; Figure 5B, lane 4 vs. lane 3). These results suggest that the activation of ERK observed as a function of PTEN down-regulation is not due to the enhanced PI(3,4,5)P3 production, that is, lipid phosphatase action, because if PI(3,4,5)P3 is involved in PTEN-down-regulation–mediated ERK activation, then wortmannin treatment in PTEN-silenced cells (which will eventually decrease total PI(3,4,5)P3 levels) should have normalized ERK phosphorylation. In conjunction with increased ERK phosphorylation, an impairment of insulin-stimulated glucose uptake was observed with wortmannin treatment in scrambled siRNA–transfected cells (Figure 5C), which was further decreased (22.0 ± 0.03%) with wortmannin treatment under the PTEN-silenced condition (Figure 5C, lane 4 vs. lane 3). The results thus suggest that the ERK-induced impairment of glucose uptake due to PTEN down-regulation is not due to the lipid phosphatase activity of PTEN. Involvement of PTEN's protein phosphatase activity in these effects is a possibility. A decrease in glucose uptake with PTEN silencing, despite an increase of Akt and GSK3β phosphorylation, suggests that some pathway might be getting activated due to ERK activation, which is altering the activity of Akt, probably by its nitration, and so on (Wu et al., 2009; Csibi et al., 2010).
Effect of down-regulation of PTEN on FAK phosphorylation
We next attempted to explore the role of PTEN's protein phosphatase actions in regard to the aforementioned effects. FAK is a widely reported direct protein substrate of PTEN (Besson et al., 1999; Hlobilkova et al., 2003), and thus PTEN has been implicated in regulating signaling pathways that involve FAK (Tamura et al., 1999). Moreover, studies have suggested that PTEN acting through FAK could regulate MAPK signaling pathways (Gu et al., 1998). FAK has emerged as a crucial regulator of insulin signaling in peripheral tissues such as skeletal muscle, liver, adipose, and pancreatic beta cells (Bisht et al., 2008; Cai et al., 2012). A decrease in FAK activity/expression has been shown to lead to insulin resistance (Bisht et al., 2007, 2008). It has been shown that PTEN, in addition to acting through PI(3,4,5)P3, also regulates insulin resistance through FAK, that is, it dephosphorylates FAK and thereby impairs insulin signaling (Gupta and Dey, 2009). The FAK that is expressed in neurons, however, has been reported to be quite different from that expressed in nonneuronal cells in various aspects (described later), although the functional consequences of these differences are not well known (Girault et al., 1999). Our recent study (Gupta et al., 2012) demonstrated that in contrast to peripheral tissues (where FAK acts as a positive regulator of insulin/PI3K signaling), FAK in neurons acts as a negative regulator of insulin/PI3K signaling, in which increase in its activity precedes development of neuronal insulin resistance. We wondered whether the positive role of PTEN in neuronal insulin signaling occurs because PTEN (by its protein phosphatase action) plays a protective role in FAK-mediated negative regulation of neuronal insulin signaling. We thus tested the tyrosine phosphorylation status of FAK with PTEN down-regulation. Down-regulation of PTEN expression under the MF condition resulted in an aberrant increase of FAK tyrosine phosphorylation (Figure 6A). Moreover, the FAK that was already hyperphosphorylated under the MFI condition was additionally phosphorylated with PTEN down-regulation (Figure 6A). The results thus highlight a protective role of PTEN in FAK-mediated negative regulation of neuronal insulin signaling. Furthermore, we observed that down-regulating FAK expression under our experimental conditions resulted in moderate reduction of ERK1/2 phosphorylation (Figure 6B; p < 0.01), suggesting that FAK mediates the activation of ERK. The results thus suggest that the ERK-induced impairment of neuronal glucose uptake observed with PTEN down-regulation is mediated by FAK. Taken together, the results highlight a probable role of PTEN's protein phosphatase actions for its positive role in neuronal insulin signaling and insulin resistance. The results suggest that PTEN, likely by its protein phosphatase action, prevents the activation of the FAK–ERK pathway, which is critically involved in negative regulation of neuronal insulin signaling, and thus that it positively regulates neuronal insulin signaling and insulin resistance.
FIGURE 6:

Role of PTEN in FAK-mediated negative regulation of neuronal insulin signaling. (A) Scrambled or PTEN-specific siRNA–transfected N2A cells were differentiated in the absence (MF) or chronic presence (MFI) of insulin. Cell lysates were subjected to Western immunoblotting and probed with anti-phosphotyrosine or anti-FAK antibodies. Bar represents relative densitometric values of pFAK after normalizing with FAK expression (pFAK/FAK). Open bars, MF; solid bars, MFI. (B) Scrambled or FAK-specific siRNA–transfected N2A cells were differentiated in the chronic presence of insulin (MFI) for 3 d and stimulated with or without insulin (100 nM) for 30 min. Cell lysates were subjected to Western immunoblotting and probed with anti–phospho-ERK (panel A), anti-ERK (panel B), anti-FAK (panel C), or anti-tubulin (panel D) antibodies. Bar represents relative densitometric values of pERK after normalizing with ERK expression (pERK/ERK). (C) N2A cells were differentiated in the absence (MF) or chronic presence (MFI) of insulin for 3 d and pretreated with vehicle (DMSO) or wortmannin (1 μM) for 30 min before stimulation with insulin (100 nM) for 30 min. Cell lysates (500 μg) were immunoprecipitated with anti-FAK antibody, subjected to Western immunoblotting, and probed with anti–phosphotyrosine or anti-FAK antibodies. (D) N2A cells were differentiated in the absence (MF) or chronic presence (MFI) of insulin for 3 d and stimulated with or without insulin (100 nM) for 30 min. Cell lysates were subjected to Western immunoblotting and probed with anti–phospho-PTEN (Ser-380/Thr-382/383) or anti-PTEN antibodies. Bar represents relative densitometric values of phospho-PTEN after normalizing with PTEN expression (pPTEN/PTEN). All experiments were repeated thrice, and a representative result is shown. Values are mean ± SE. **p < 0.01 compared with lane 1; $p < 0.01 compared with lane 3; $p < 0.05 compared with lane 2. IB, immunoblotted; IP, immunoprecipitated.
We also observed a striking increase in FAK phosphorylation with PI3K inhibition (Figure 6C). Inhibition of PI3K under the MFI condition further increased FAK phosphorylation (Figure 6C). The results thus suggest that, in addition to its known role to act antagonistically on the ERK pathway in neuronal systems (van der Heide et al., 2006), PI3K also acts antagonistically on FAK. This highlights an important role of PI3K in the regulation of neuronal insulin resistance by its ability to inhibit FAK and ERK activation. Overall these results highlight the FAK–ERK pathway as major route involved in impairment of neuronal insulin signaling and suggests an important role of PTEN and PI3K in preventing activation of the FAK–ERK pathway. This regulatory effect of PTEN seems to be by its protein phosphatase activity. This also provides the underlying molecular mechanism of PTEN-mediated positive regulation of neuronal insulin signaling.
Determination of PTEN activity under neuronal insulin resistance
Given that the results highlight a protective role of PTEN in neuronal insulin resistance, it would be informative to know the status of PTEN activity under neuronal insulin-resistant conditions. Dephosphorylation of PTEN at the C-terminus–tail Ser-380, Thr-382, and Thr-383 residues represents an increase of PTEN activity (Das et al., 2003). The activity of PTEN under MF and MFI conditions, with or without insulin stimulation, was determined by immunoblotting with anti–phospho-PTEN (Ser-380/Thr-382/383) antibody. We observed a moderate decrease (50.2 ± 0.03%) in PTEN phosphorylation under the MFI condition (Figure 6D, lane 3 vs. lane 1; p < 0.01). Of interest, insulin stimulation under the MF condition also led to a small but significant decrease of 29.3 ± 0.02% (Figure 6D, lane 2 vs. lane 1; p < 0.01), whereas it did not show any further significant decrease in PTEN phosphorylation under the MFI condition (Figure 6D). The results thus imply an increased activity of PTEN under neuronal insulin-resistant conditions. Based on above results, these observations suggest that the increase in PTEN activity observed under the neuronal insulin-resistant condition is a defense mechanism to protect the cell from further FAK-ERK–mediated impairment of insulin signaling and thus prevent cell death. This conclusion is supported by the fact that when PTEN is down-regulated under MFI conditions it further exacerbates neuronal insulin signaling and glucose uptake. To further strengthen these assumptions, we performed a time-course assay to detect the activity alteration of PTEN. We observed a time-dependent increase of PTEN activity under MFI conditions, whereas we found no significant change in PTEN activity under MF conditions (Supplemental Figure S3). The results thus emphasize the involvement of PTEN in positive regulation of neuronal insulin resistance.
Effect of PTEN down-regulation on AD-associated hallmark neuropathological characteristics
As mentioned earlier, there is increasing recognition that an insulin-resistant brain state forms the core of the neurodegenerative disorder AD (de la Monte and Wands, 2008). However, the unexpected (PTEN being assumed also to be a negative regulator of neuronal insulin signaling) increase in tau pathologies with PTEN down-regulation has obscured the underlying link between the insulin/PI3K pathway and AD-type neurodegeneration. Of interest, similar to our observations of increased PTEN activity under neuronal insulin resistance (as a defense mechanism), previous studies reported increased activity of PTEN in brains of AD patients (Rickle et al., 2006) and found loss of PTEN expression during the end stages of AD (Griffin et al., 2005). Given that the present findings suggest that PTEN, paradoxically, positively regulates neuronal insulin signaling and glucose metabolism, we next sought to determine the effect of down-regulation of PTEN expression on hallmark characteristics of AD under our experimental conditions to gain better insights into the underlying link between the insulin/PI3K/PTEN pathway and AD-type neurodegeneration. We previously showed (Gupta et al., 2011) that prolonged hyperinsulinemic conditions (MFI), in addition to generating insulin resistance, also lead to development of hallmark AD-associated neuropathological changes in N2A cells. Tau hyperphosphorylation is a hallmark neuropathological characteristic associated with AD (Blennow et al., 2006). A manifest increase (approximately twofold) in tau Ser-396 phosphorylation, a site known to be critical for AD pathogenesis (Bramblett et al., 1993), was observed in cells cultured under MFI conditions (Figure 7A). Similar to previous reports (Nayeem et al., 2007), we observed that PTEN down-regulation results in a marked increase (∼2.2-fold) of tau (Ser-396) phosphorylation (Figure 7A). Its down-regulation under MFI conditions led to a further increase (35.2 ± 0.05%) in tau phosphorylation (Figure 7A). As an additional control, the effect of SHIP2 silencing on tau phosphorylation was also monitored. No significant effect on tau (Ser-396) was observed when SHIP2 was silenced (Figure 7A).
FIGURE 7:

Effect of down-regulation of PTEN on AD-associated hallmark neuropathological characteristics. Scrambled or PTEN- or SHIP2-specific siRNA–transfected N2A cells were differentiated in the absence (MF) or chronic presence (MFI) of insulin. (A) Cells were differentiated in MF and MFI media for 7 d. Cell lysates were subjected to Western immunoblotting and probed with anti–phospho-tau (Ser-396), anti-tau, anti-PTEN, anti-SHIP2, or anti-tubulin antibodies. Bar represents relative densitometric values of ptau (Ser-396) after normalizing with tau expression (ptau/tau). (B) Cells were differentiated in MF and MFI media for 7 d. Conditioned media from the last 12 h of differentiation were collected, and secreted amyloid-β (1–42) levels were measured using an amyloid-β (1–42) colorimetric ELISA kit. Bar represents fold change in amyloid-β (1–42) levels. (C) Cells were differentiated in MF and MFI media for 3 d and were subjected to acetylcholinesterase assay. Bar represents fold change in acetylcholinesterase activity. (D) N2A cells were differentiated in the absence (MF) or chronic presence (MFI) of insulin for 7 d and pretreated with vehicle (DMSO) or U0126 (25 μM) for 24 h before lysis. Cell lysates were subjected to Western immunoblotting and probed with anti–phospho-tau (Ser-396) or anti-tau antibodies. Bar represents relative densitometric values of ptau (Ser-396) after normalizing with tau expression (ptau/tau). (E) Schematic representation of molecular pathways linking neuronal insulin resistance and AD-type neurodegeneration. Arrows represent activation, whereas bars represent inhibition. All experiments were repeated thrice, and a representative result is shown. Values are mean ± SE. **p < 0.01 compared with lane 1; $p < 0.05 compared with lane 2; $$p < 0.01 compared with lane 2; ##p < 0.01 compared with lane 3. Open bars, MF; solid bars, MFI; IB, immunoblotted.
The accumulation of extracellular plaques mainly comprising the small peptide amyloid-β is another key hallmark characteristic of AD (Blennow et al., 2006). We observed a marked increase (79.6 ± 0.13%) in secreted amyloid-β (1–42) levels with PTEN down-regulation in cells cultured under MF conditions (Figure 7B). However, no further significant increase was observed in amyloid-β (1–42) levels with PTEN silencing under MFI conditions (Figure 7B). An increase in acetylcholinesterase (AChE) activity has been reported in various AD models (Lester-Coll et al., 2006). Down-regulation of PTEN also significantly increased AChE activity under both MF and MFI conditions (Figure 7C), suggesting its crucial role in preventing AD-like changes.
Furthermore, activation of the FAK–ERK pathway was widely implicated in AD pathogenesis (Colucci-D'Amato et al., 2003; Caltagarone et al., 2007). Studies suggested that FAK, through ERK activation, mediates neuronal death (Caltagarone et al., 2007; Frasca et al., 2008). ERK is also a widely known tau kinase (Colucci-D'Amato et al., 2003). Of interest, as shown earlier, we observed hyperactivation of the FAK–ERK pathway with down-regulation of PTEN expression. We showed that ERK activation is the key mediator of PTEN-down-regulation–mediated impairment of neuronal insulin signaling and glucose uptake. Thus we also tested the effect of inhibition of ERK (using U0126) on tau phosphorylation. The elevated tau phosphorylation observed under MFI conditions was markedly decreased (by 51.6 ± 0.15%) with U0126 treatment (Figure 7D). Taken together, the results indicate that the impairment of neuronal insulin signaling and AD-type neurodegeneration are closely linked and suggest a novel molecular pathway linking the two (Figure 7E), highlighting a crucial role of PTEN in regulation of glucose metabolism and neurodegeneration by preventing the activation of FAK and ERK. Our results suggest that the loss of PTEN expression reported in AD brains (Griffin et al., 2005) could be a key reason for the complications associated with AD.
DISCUSSION
PTEN, a dual-function phosphatase that possesses both lipid and protein phosphatase activities through its lipid phosphatase action (i.e., by hydrolyzing the crucial lipid secondary messenger PI(3,4,5)P3 to PI(3,4)P2) negatively regulates insulin signaling. PTEN is also known to be a negative regulator of insulin resistance in peripheral tissues such as skeletal muscle and adipose tissue, where its down-regulation improves insulin sensitivity (Kurlawalla-Martinez et al., 2005; Wijesekara et al., 2005). In the present study, we provide evidence that PTEN, paradoxically, positively regulates neuronal insulin signaling and insulin resistance. The positive role of PTEN in neuronal insulin signaling is likely due to its protein phosphatase action, which prevents activation of the FAK–ERK pathway, which is critically involved in negative regulation of neuronal insulin signaling and glucose metabolism. This study demonstrates that another lipid phosphatase known for modulating insulin signaling, SHIP2, however, has no role in neuronal insulin signaling.
Ablation of insulin signaling in the brain is widely known to contribute to the pathophysiology of obesity and type 2 diabetes by impairing energy homeostasis, that is, by causing imbalance between food intake and energy expenditure. Thus agents that could ameliorate central insulin resistance are expected to improve the energy imbalance underlying obesity (Zhang et al., 2008). However, contrary to expectations, deletion of PTEN, the negative regulator of insulin signaling, in POMC neurons results in hyperphagia and diet-sensitive obesity in mice (Plum et al., 2006). The hyperphagic and obese phenotype observed with PTEN deletion in POMC neurons is due to the activation of ATP-sensitive potassium (KATP) channels in the brain (Plum et al., 2006). Of interest, activation of KATP channels has been proposed to be required for the emergency response to serve glucose deprivation in neurons (Levin et al., 2001). Reduced uptake and intracellular metabolism of glucose in neurons has been proposed to cause the opening (activation) of the KATP channels, leading to cell membrane hyperpolarization and cessation of firing in order to lower the metabolic demands on neurons (Levin et al., 2001). Indeed, the present study shows that inhibiting PTEN in neuronal cells leads to reduction in glucose uptake. Although our data may be specific to N2A cells, the aforementioned reports support our findings of involvement of PTEN in positive regulation of neuronal insulin signaling and glucose uptake.
FAK is a direct protein substrate of PTEN (Besson et al., 1999), and thus PTEN regulates signaling pathways that involve FAK (Tamura et al., 1999). Here we report that the observed positive role of PTEN in neuronal insulin signaling is likely due to the protein phosphatase action of PTEN, preventing the activation of the FAK–ERK pathway, which is involved in negative regulation of neuronal insulin signaling. Previous findings (Huang et al., 2006; Bisht et al., 2007, 2008; Gupta and Dey, 2009; Cai et al., 2012) in peripheral tissues like skeletal muscle, liver, adipose, and pancreatic beta cells strongly suggested the involvement of FAK as a positive regulator of insulin signaling, where a decrease in its expression/activity has been shown to lead to development of insulin resistance. However, specifically in neuronal cells, FAK is found to be involved in impairment of insulin signaling and glucose metabolism, where an increase in its activity has been shown to precede development of neuronal insulin resistance (Gupta et al., 2012). The obvious question that comes next is, What is so special about FAK, particularly in neurons? The FAK that is expressed in neurons has been reported to be quite different from those expressed in nonneuronal cells in various aspects, although the functional consequences of these differences are not well known.
FAK exists in various spliced isoforms that were conserved during evolution and are exclusively or preferentially found in the CNS (Burgaya and Girault, 1996; Burgaya et al., 1997; Girault et al., 1999). Several of the splice variants predict the insertion of short peptides in the coding sequence, a fact that accounts for the higher apparent molecular weight of FAK in brain than in other tissues (Serpente et al., 1996; Burgaya et al., 1997). Neurons mostly express the FAK +6,7 isoform (the number indicates the length of the peptide in amino acids encoded by additional exons; Toutant et al., 2000).
The presence of these additional exons has been shown to dramatically increase the autophosphorylation of FAK (Burgaya et al., 1997; Girault et al., 1999; Toutant et al., 2000), implying that this neuronal isoform is more readily activated than the nonneuronal isoform, although it is important to note that activation of this neuronal isoform of FAK is tightly regulated in vivo and that in adult brain FAK is largely unphosphorylated and increases dramatically only in response to some extracellular messengers or stress (Derkinderen et al., 1996; Serpente et al., 1996; Siciliano et al., 1996). This suggests that specific regulatory mechanisms controlling FAK activation exist in neurons (Toutant et al., 2000).
FAK is expressed at very high levels in the brain, but, in contrast to nonneural cells, FAK is not restricted to focal adhesion contacts. FAK is distributed throughout the neuron, including the cell body, dendritic tree, and axon (Burgaya et al., 1995; Grant et al., 1995; Serpente et al., 1996), suggesting that FAK has different mechanisms for subcellular localization in neural cells and as a consequence has novel targets (Grant et al., 1995).
In neurons that mostly expresses the FAK +6,7 isoform, phosphorylation of Tyr-397 (a critical residue for activation and function of FAK) by Src-family kinases, which normally leads to FAK activation and thus triggering of several signaling cascades, may not be possible (Toutant et al., 2000).
Pointing toward an additional difference with regard to the ubiquitous isoforms, FAK has been associated with protective (antiapoptotic) signaling (Huang et al., 2007; Schwock et al., 2010); however, in neurons its activation has been shown to lead to cell death (Williamson et al., 2002; Grace and Busciglio, 2003). Neurons have been classically recognized as postmitotic cells, and it is suggested that activated FAK may mediate cell cycle activation, thereby leading to neurodegeneration (Caltagarone et al., 2007; Frasca et al., 2008; Xu et al., 2009).
Taken together, these reports highlight a critical role of FAK in neuronal systems.
These observations raise the question of the specific functions of neuronal FAK. Our earlier findings (Gupta et al., 2012) demonstrate that in contrast to peripheral tissues (where FAK acts as a positive regulator of insulin/PI3K signaling), FAK in neurons acts as a negative regulator of insulin/PI3K signaling. As reported with neuronal cells, we observed very low basal levels of FAK phosphorylation under normal conditions (highlighting its tight regulation); however, this is aberrantly increased under the neuronal insulin-resistant condition, underpinning the “neuronal cell-type”–specific properties of FAK. The presence of protein tyrosine phosphatase(s) has been suggested to regulate the tyrosine phosphorylation of FAK in nervous tissues (Toutant et al., 2000). The present findings highlight that PTEN could be the protein phosphatase regulating FAK tyrosine phosphorylation and thus provide the probable reasons for the paradoxical role of PTEN in neuronal insulin signaling.
The literature also demonstrates a critical role of ERK in neurons. ERK has been known for cell survival effects; however, in neurons ERK has been reported to be involved in the induction of cell death (Subramaniam et al., 2004; Haddad, 2005); the mechanisms involved are not clear. ERK is a well-known kinase of tau, the principal mediator of AD-type neurodegeneration. In addition, the activity of ERK is increased in neurodegenerative diseases like AD, and its inhibitors are suggested as attractive therapeutic agents (Colucci-D'Amato et al., 2003). It was suggested that activation of the ERK pathway might mediate cell cycle activation, thereby leading to neurodegeneration (Caltagarone et al., 2007; Frasca et al., 2008). We found that inhibition of ERK under neuronal insulin-resistant conditions markedly ameliorated impaired insulin signaling and glucose uptake. Furthermore, hyperactivation of ERK by wortmannin treatment followed concomitant impairment of glucose uptake, pointing to its direct involvement in the regulation of neuronal insulin signaling and resistance. Taken together, our findings, along with the aforementioned reports, highlight a very interesting aspect of neuronal physiology by which FAK and ERK seem to be at an important convergence point of signaling pathways involved in neuronal energy impairment and neurodegeneration, that is, the two pathophysiological states that have been demonstrated to be closely linked (van der Heide et al., 2006). Our findings suggest that PTEN has the same functions (i.e., a lipid and protein phosphatase), but since in a neuronal context–dependent way the FAK–ERK pathway is the central pathway involved in neuronal energy impairment and PTEN by its protein phosphatase activity could prevent FAK–ERK pathway activation, PTEN has contrary effects on insulin signaling as compared with its action in peripheral tissue. This highlights a neuron-specific mechanism of regulation of insulin resistance by PTEN.
One important observation in the present study is that although PTEN silencing increased Akt and GSK3β phosphorylation in a PI(3,4,5)P3-dependent way, it still resulted in decreased glucose uptake. The activity of Akt is also regulated by other posttranslational modifications, such as its nitration and so on (Wu et al., 2009; Charbonneau and Marette, 2010). Studies suggested that nitration of Akt leads to its inactivation even when it is phosphorylated at Ser-473 and Thr-308 sites, which are known for its activation (Wu et al., 2009). Of interest, a recent finding (Csibi et al., 2010) suggests that ERK, by activating the iNOS oxidative stress pathway, leads to the production of peroxynitrite (ONOO−), which causes nitration of Akt and thereby inhibits translocation of GLUT4 to the plasma membrane. In addition, activation of ERK and the iNOS pathway leading to ONOO− production plays a critical role in neurological disorders, including AD (Pannu and Singh, 2006). Of interest, the neuronal insulin-resistant model used in the present study also displays hallmark AD-like characteristics (Gupta et al., 2011). It is tempting, therefore, to speculate that increased nitration of Akt due to increased ERK activity might be masking the effect of the lipid phosphatase activity of PTEN. Further studies are required to unravel the precise pathways for the observed effects.
The present study also highlighted an important role of PI3K in the regulation of the FAK–ERK pathway, as inhibition of PI3K resulted in marked elevation of FAK and ERK activity, followed by impairment of glucose uptake. This highlights the significance of PI3K activators in complications associated with neuronal insulin resistance, including neurodegenerative diseases such as AD, as it could inhibit FAK-ERK pathway–mediated energy impairment and cell death. Supporting this, we recently showed that metformin, by activating PI3K signaling (resulting in inhibition of the FAK–ERK pathway), ameliorates neuronal insulin resistance and AD-like characteristics (Gupta et al., 2011).
There is widening recognition that impaired insulin actions in the brain act as mediators of the neurodegenerative disorder AD (de la Monte and Wands, 2008; Talbot et al., 2012), and thus AD is also characterized as a brain-specific form of diabetes. The term “type 3 diabetes” has been proposed for AD (Steen et al., 2005). Moreover, peripheral insulin-sensitizer drugs like peroxisome proliferator-activated receptor agonists (Risner et al., 2006) and glucagon-like peptide-1 mimetics (McClean et al., 2011) have demonstrated therapeutic rescue in AD. In the present study we observed that PTEN silencing, along with impairing insulin signaling and glucose uptake, also resulted in development of hallmark characteristics of AD. Mutation of PTEN was believed to decrease tau phosphorylation by increasing Akt activity and subsequently decreasing the activity of GSK3β, a well-established tau kinase. However, contrary to expectations, phosphatase-null PTEN increased tau phosphorylation and its aggregation and impaired tau binding to microtubules, whereas PTEN overexpression in neuronal cells decreased tau phosphorylation, followed by increased tau–microtubule association and decreased formation of tau aggregates (Kerr et al., 2006; Zhang et al., 2006). ERK1/2 has been suggested to play a significant role in mediating the effects of PTEN on tau phosphorylation (Kerr et al., 2006). In the present study also, inhibition of ERK resulted in amelioration of tau hyperphosphorylation. Of interest, similar to our observations, an increase in PTEN activity in the brains of AD patients has been reported (Rickle et al., 2006), which again most likely represents a defense mechanism adopted by the affected neurons. These assumptions are further strengthened by the reports showing loss of PTEN expression at the end stages of AD (Griffin et al., 2005), thereby highlighting the essential role of PTEN in preventing molecular processes underlying AD pathology. Based on the foregoing reports, there has been uncertainty regarding the role of PI3K/Akt signaling and their activators in AD (as PTEN loss in AD brains followed increased Akt phosphorylation). The present findings highlight the exact role of PTEN in neuronal insulin signaling and suggest a novel molecular pathway linking neuronal insulin resistance to AD (Figure 7E), thereby providing an explanation for the unexpected observations reported earlier with PTEN alterations in brain.
Although liver-specific knockout mice showed improved systemic insulin sensitivity, recent evidence suggests that a decrease in PTEN expression in the liver impairs its insulin sensitivity (Vinciguerra et al., 2008). This is supported by the fact that down-regulation of PTEN expression in hepatoma cells, similar to our results, although it increased Akt phosphorylation, desensitized insulin signaling upstream of Akt (Vinciguerra et al., 2008). In addition, a lack of insulin responsiveness in terms of gene expression has been observed in PTEN-deficient hepatocytes (Vinciguerra et al., 2008). Although direct involvement of PTEN in the regulation of liver-specific insulin resistance has not been demonstrated, our study, to the best of our knowledge, is the first to demonstrate positive regulation of insulin resistance by PTEN. Our findings, along with the aforementioned reports, highlight tissue-specific regulation of insulin resistance by PTEN and thus strongly emphasize a note of caution in the use of pharmacological inhibitors of PTEN to improve insulin resistance. Our findings suggest that therapeutic interventions to increase PTEN expression in neurons could prevent/alleviate neuronal insulin resistance and complications associated with it, including AD.
MATERIALS AND METHODS
Materials
Minimum essential medium (MEM), nutrient mixture Ham's F-12, MCDB 201 medium, bovine albumin (cell culture grade), and [3H]2-deoxyglucose were purchased from Sigma-Aldrich (St. Louis, MO). Fetal bovine serum (FBS) was from Biological Industries (Kibbutz Beit, Haemek, Israel). Anti–phospho-Akt (Ser-473), anti-Akt, anti–phospho-GSK3β (Ser-9), anti-GSK3β, anti–phospho-PTEN (Ser-380/Thr-382/383), anti–phospho-tau (ser-396), anti-tau, and anti-GLUT4 antibodies were from Cell Signaling Technology (Beverly, MA). Anti-FAK and anti-PTEN antibodies were from Upstate Biotechnology (Lake Placid, NY). Anti-phosphotyrosine, anti–IR-β, anti-IRS1, anti-SHIP2, anti-actin, anti–phospho-ERK, anti-ERK, anti–phospho-p38, anti-p38, anti–phospho-JNK, and anti-JNK antibodies were from Santa Cruz Biotechnology (Santa Cruz, CA). Anti–α-tubulin was from Neomarkers (Fremont, CA). Bovine insulin was purchased from Calbiochem (La Jolla, CA). Nitrocellulose membranes were procured from Bio-Rad Laboratories (Hercules, CA). All the other reagents, unless attributed specifically, were from Sigma-Aldrich or Amresco (Solon, OH).
Cell culture
The mouse neuroblastoma cell line Neuro-2a (N2A) was cultured as described previously (Gupta et al., 2011). Confluent cells were differentiated in an equal mixture of two serum-free media (MCDB 201 and Ham's F-12 medium) in the absence (MF) or chronic presence (MFI) of 100 nM insulin for 3 d in the presence of 2% DMSO with a change of media after every 12 h (Gupta et al., 2011). For some experiments (as and when indicated) N2A cells were kept in MF or MFI medium for 7 d, with change of media after every 12 h. Cells were pretreated with U0126 (25 μM; Harmon et al., 2004; Hayashi et al., 2008) and wortmannin (1 μM; Benomar et al., 2006) as indicated in the figure legends. Mouse primary cortical neurons were cultured as described previously (Alano et al., 2010).
siRNA transfection
siRNA oligonucleotides were designed and synthesized by Qiagen (Hilden, Germany) to target the following cDNA sequences: nonspecific (scrambled) siRNA, 5′- AATTCTCCGAACGTGTCACGT; PTEN siRNA, P1, 5′-CAAGATGATGTTTGAAACTAT, and P2, 5′-GGCGCTATGTATATTATTATA; SHIP2 siRNA, S1, 5′-CTGGGTGAGCTTATAGGCCTA, and S2, 5′-ACCCAAGAACAGCTTCAATAA; FAK siRNA, 5′-TGCAATGGAACGAGTATTAAA. N2A cells were transfected with PTEN-specific (P1 or P2, as specified in the text), SHIP2-specific (S1 or S2, as specified in the text), or FAK-specific or nonspecific (scrambled) siRNA using RNAiFect Transfection Reagent (Qiagen) in reduced serum Opti-MEM media as described previously (Bisht et al., 2007).
Preparation of cell lysates for immunoblotting
N2A cells were transfected with siRNA as indicated and allowed to differentiate under MF or MFI conditions for 3 d. Cells were then incubated with or without insulin (100 nM) for 30 min (van der Heide et al., 2003) and lysed in cell lysis buffer as described previously (Gupta et al., 2011). Equal concentrations of all the samples were subjected to SDS–PAGE, followed by Western immunoblotting. The immunoblots were quantified using Quantity One 1-D analysis software as described previously (Gupta et al., 2011).
Glucose uptake assay
Glucose uptake assays were performed as described previously (Gupta et al., 2011) using [3H]2-DOG.
Phosphatidylinositol 3-kinase activity
PI3K activity associated with IRS1 was determined with a PI3K enzyme-linked immunosorbent assay (ELISA) kit (Echelon Biosciences, Salt Lake City, UT) according to the manufacturer's instructions and as reported previously (Gupta et al., 2011).
Subcellular fractionation
Subcellular fractionation was performed as described previously (Gupta et al., 2011).
Amyloid-β (1–42) measurement
The amyloid-β (1–42) level in the conditioned media was measured using an amyloid-β (1–42) colorimetric ELISA kit (Invitrogen, Camarillo, CA) as per the manufacturer's instructions.
Acetylcholinesterase activity
Cell lysates were assayed for acetylcholine esterase activity using the QuantiChrom Acetylcholinesterase Assay Kit (BioAssay Systems, Hayward, CA) as per the manufacturer's instructions. The enzyme activity was normalized with the protein concentration of samples.
Statistical analysis
All experiments were performed a minimum of three times, and a representative result is shown. Data are expressed as mean ± SE. The significance of difference between two groups (p-values) was calculated by two-tailed unpaired Student's t test. In all cases p < 0.05 was considered to be statistically significant; *p < 0.05 and **p < 0.01.
Supplementary Material
Acknowledgments
A.G. was the recipient of a Senior Research Fellowship from the Council of Scientific and Industrial Research, Government of India, New Delhi. This study was supported by a grant from the Department of Science and Technology, Government of India, New Delhi, to C.S.D. (SR/S2/3CB-24/2008, dated 12/30/2008).
Abbreviations used:
- AD
Alzheimer's disease
- ERK
extracellular signal-regulated kinase
- FAK
focal adhesion kinase
- PI3K
phosphoinositide 3-kinase
- PTEN
phosphatase and tension homologue
- SHIP2
Src homology-2 domain containing inositol 5’ phosphatase 2
Footnotes
This article was published online ahead of print in MBoC in Press (http://www.molbiolcell.org/cgi/doi/10.1091/mbc.E12-05-0337) on August 8, 2012.
Present addresses: *National Center for Biological Sciences, Tata Institute of Fundamental Research, Bangalore, Karnataka, India
†School of Biological Sciences, Indian Institute of Technology–Delhi, Hauz Khas, New Delhi 110 016, India.
REFERENCES
- Alano CC, Garnier P, Ying W, Higashi Y, Kauppinen TM, Swanson RA. NAD+ depletion is necessary and sufficient for poly(ADP-ribose) polymerase-1-mediated neuronal death. J Neurosci. 2010;30:2967–2978. doi: 10.1523/JNEUROSCI.5552-09.2010. [DOI] [PMC free article] [PubMed] [Google Scholar]
- Benomar Y, Naour N, Aubourg A, Bailleux V, Gertler A, Djiane J, Guerre-Millo M, Taouis M. Insulin and leptin induce Glut4 plasma membrane translocation and glucose uptake in a human neuronal cell line by a phosphatidylinositol 3-kinase- dependent mechanism. Endocrinology. 2006;147:2550–2556. doi: 10.1210/en.2005-1464. [DOI] [PubMed] [Google Scholar]
- Besson A, Robbins SM, Yong VW. PTEN/MMAC1/TEP1 in signal transduction and tumorigenesis. Eur J Biochem. 1999;263:605–611. doi: 10.1046/j.1432-1327.1999.00542.x. [DOI] [PubMed] [Google Scholar]
- Bisht B, Goel HL, Dey CS. Focal adhesion kinase regulates insulin resistance in skeletal muscle. Diabetologia. 2007;50:1058–1069. doi: 10.1007/s00125-007-0591-6. [DOI] [PubMed] [Google Scholar]
- Bisht B, Srinivasan K, Dey CS. In vivo inhibition of focal adhesion kinase causes insulin resistance. J Physiol. 2008;586:3825–3837. doi: 10.1113/jphysiol.2008.157107. [DOI] [PMC free article] [PubMed] [Google Scholar]
- Blennow K, de Leon MJ, Zetterberg H. Alzheimer's disease. Lancet. 2006;368:387–403. doi: 10.1016/S0140-6736(06)69113-7. [DOI] [PubMed] [Google Scholar]
- Bramblett GT, Goedert M, Jakes R, Merrick SE, Trojanowski JQ, Lee VM. Abnormal tau phosphorylation at Ser396 in Alzheimer's disease recapitulates development and contributes to reduced microtubule binding. Neuron. 1993;10:1089–1099. doi: 10.1016/0896-6273(93)90057-x. [DOI] [PubMed] [Google Scholar]
- Burgaya F, Girault JA. Cloning of focal adhesion kinase, pp125FAK, from rat brain reveals multiple transcripts with different patterns of expression. Brain Res Mol Brain Res. 1996;37:63–73. doi: 10.1016/0169-328x(95)00273-u. [DOI] [PubMed] [Google Scholar]
- Burgaya F, Menegon A, Menegoz M, Valtorta F, Girault JA. Focal adhesion kinase in rat central nervous system. Eur J Neurosci. 1995;7:1810–1821. doi: 10.1111/j.1460-9568.1995.tb00700.x. [DOI] [PubMed] [Google Scholar]
- Burgaya F, Toutant M, Studler JM, Costa A, Le Bert M, Gelman M, Girault JA. Alternatively spliced focal adhesion kinase in rat brain with increased autophosphorylation activity. J Biol Chem. 1997;272:28720–28725. doi: 10.1074/jbc.272.45.28720. [DOI] [PubMed] [Google Scholar]
- Cai EP, et al. In vivo role of focal adhesion kinase in regulating pancreatic β-cell mass and function through insulin signaling, actin dynamics, and granule trafficking. Diabetes. 2012;61:1708–1718. doi: 10.2337/db11-1344. [DOI] [PMC free article] [PubMed] [Google Scholar]
- Caltagarone J, Jing Z, Bowser R. Focal adhesions regulate Abeta signaling and cell death in Alzheimer's disease. Biochim Biophys Acta. 2007;1772:438–445. doi: 10.1016/j.bbadis.2006.11.007. [DOI] [PMC free article] [PubMed] [Google Scholar]
- Charbonneau A, Marette A. Inducible nitric oxide synthase induction underlies lipid-induced hepatic insulin resistance in mice: potential role of tyrosine nitration of insulin signaling proteins. Diabetes. 2010;59:861–871. doi: 10.2337/db09-1238. [DOI] [PMC free article] [PubMed] [Google Scholar]
- Colucci-D'Amato L, Perrone-Capano C, di Porzio U. Chronic activation of ERK and neurodegenerative diseases. Bioessays. 2003;25:1085–1095. doi: 10.1002/bies.10355. [DOI] [PubMed] [Google Scholar]
- Csibi A, Communi D, Muller N, Bottari SP. Angiotensin II inhibits insulin-stimulated GLUT4 translocation and Akt activation through tyrosine nitration-dependent mechanisms. PLoS One. 2010;5:e10070. doi: 10.1371/journal.pone.0010070. [DOI] [PMC free article] [PubMed] [Google Scholar]
- Das S, Dixon JE, Cho W. Membrane-binding and activation mechanism of PTEN. Proc Natl Acad Sci USA. 2003;100:7491–7496. doi: 10.1073/pnas.0932835100. [DOI] [PMC free article] [PubMed] [Google Scholar]
- de la Monte SM, Wands JR. Alzheimer's disease is type 3 diabetes—evidence reviewed. J Diabetes Sci Technol. 2008;2:1101–1113. doi: 10.1177/193229680800200619. [DOI] [PMC free article] [PubMed] [Google Scholar]
- Deng Y, Li B, Liu Y, Iqbal K, Grundke-Iqbal I, Gong CX. Dysregulation of insulin signaling, glucose transporters, O-GlcNAcylation, and phosphorylation of tau and neurofilaments in the brain: implication for Alzheimer's disease. Am J Pathol. 2009;175:2089–2098. doi: 10.2353/ajpath.2009.090157. [DOI] [PMC free article] [PubMed] [Google Scholar]
- Derkinderen P, Toutant M, Burgaya F, Le Bert M, Siciliano JC, de Franciscis V, Gelman M, Girault JA. Regulation of a neuronal form of focal adhesion kinase by anandamide. Science. 1996;273:1719–1722. doi: 10.1126/science.273.5282.1719. [DOI] [PubMed] [Google Scholar]
- Frasca G, Carbonaro V, Merlo S, Copani A, Sortino MA. Integrins mediate beta-amyloid-induced cell-cycle activation and neuronal death. J Neurosci Res. 2008;86:350–355. doi: 10.1002/jnr.21487. [DOI] [PubMed] [Google Scholar]
- Fujishiro M, et al. Three mitogen-activated protein kinases inhibit insulin signaling by different mechanisms in 3T3-L1 adipocytes. Mol Endocrinol. 2003;17:487–497. doi: 10.1210/me.2002-0131. [DOI] [PubMed] [Google Scholar]
- Girault JA, Costa A, Derkinderen P, Studler JM, Toutant M. FAK and PYK2/CAKbeta in the nervous system: a link between neuronal activity, plasticity and survival. Trends Neurosci. 1999;22:257–263. doi: 10.1016/s0166-2236(98)01358-7. [DOI] [PubMed] [Google Scholar]
- Grace EA, Busciglio J. Aberrant activation of focal adhesion proteins mediates fibrillar amyloid beta-induced neuronal dystrophy. J Neurosci. 2003;23:493–502. doi: 10.1523/JNEUROSCI.23-02-00493.2003. [DOI] [PMC free article] [PubMed] [Google Scholar]
- Grant SG, Karl KA, Kiebler MA, Kandel ER. Focal adhesion kinase in the brain: novel subcellular localization and specific regulation by Fyn tyrosine kinase in mutant mice. Genes Dev. 1995;9:1909–1921. doi: 10.1101/gad.9.15.1909. [DOI] [PubMed] [Google Scholar]
- Griffin RJ, Moloney A, Kelliher M, Johnston JA, Ravid R, Dockery P, O'Connor R, O'Neill C. Activation of Akt/PKB, increased phosphorylation of Akt substrates and loss and altered distribution of Akt and PTEN are features of Alzheimer's disease pathology. J Neurochem. 2005;93:105–117. doi: 10.1111/j.1471-4159.2004.02949.x. [DOI] [PubMed] [Google Scholar]
- Gu J, Tamura M, Yamada KM. Tumor suppressor PTEN inhibits integrin- and growth factor-mediated mitogen-activated protein (MAP) kinase signaling pathways. J Cell Biol. 1998;143:1375–1383. doi: 10.1083/jcb.143.5.1375. [DOI] [PMC free article] [PubMed] [Google Scholar]
- Gual P, Le Marchand-Brustel Y, Tanti JF. Positive and negative regulation of insulin signaling through IRS-1 phosphorylation. Biochimie. 2005;87:99–109. doi: 10.1016/j.biochi.2004.10.019. [DOI] [PubMed] [Google Scholar]
- Gupta A, Bisht B, Dey CS. Peripheral insulin-sensitizer drug metformin ameliorates neuronal insulin resistance and Alzheimer's-like changes. Neuropharmacology. 2011;60:910–920. doi: 10.1016/j.neuropharm.2011.01.033. [DOI] [PubMed] [Google Scholar]
- Gupta A, Bisht B, Dey CS. Focal adhesion kinase negatively regulates neuronal insulin resistance. Biochim Biophys Acta. 2012;1822:1030–1037. doi: 10.1016/j.bbadis.2012.02.011. [DOI] [PubMed] [Google Scholar]
- Gupta A, Dey CS. PTEN and SHIP2 regulates PI3K/Akt pathway through focal adhesion kinase. Mol Cell Endocrinol. 2009;309:55–62. doi: 10.1016/j.mce.2009.05.018. [DOI] [PubMed] [Google Scholar]
- Haddad JJ. N-methyl-D-aspartate (NMDA) and the regulation of mitogen-activated protein kinase (MAPK) signaling pathways: a revolving neurochemical axis for therapeutic intervention. Prog Neurobiol. 2005;77:252–282. doi: 10.1016/j.pneurobio.2005.10.008. [DOI] [PubMed] [Google Scholar]
- Harmon AW, Paul DS, Patel YM. MEK inhibitors impair insulin-stimulated glucose uptake in 3T3-L1 adipocytes. Am J Physiol Endocrinol Metab. 2004;287:E758–766. doi: 10.1152/ajpendo.00581.2003. [DOI] [PubMed] [Google Scholar]
- Hayashi H, Tsuchiya Y, Nakayama K, Satoh T, Nishida E. Down-regulation of the PI3-kinase/Akt pathway by ERK MAP kinase in growth factor signaling. Genes Cells. 2008;13:941–947. doi: 10.1111/j.1365-2443.2008.01218.x. [DOI] [PubMed] [Google Scholar]
- Hlobilkova A, Knillova J, Bartek J, Lukas J, Kolar Z. The mechanism of action of the tumour suppressor gene PTEN. Biomed Pap Med Fac Univ Palacky Olomouc Czech Repub. 2003;147:19–25. [PubMed] [Google Scholar]
- Huang D, Khoe M, Befekadu M, Chung S, Takata Y, Ilic D, Bryer-Ash M. Focal adhesion kinase mediates cell survival via NF-kappaB and ERK signaling pathways. Am J Physiol Cell Physiol. 2007;292:C1339–1352. doi: 10.1152/ajpcell.00144.2006. [DOI] [PubMed] [Google Scholar]
- Huang D, Khoe M, Ilic D, Bryer-Ash M. Reduced expression of focal adhesion kinase disrupts insulin action in skeletal muscle cells. Endocrinology. 2006;147:3333–3343. doi: 10.1210/en.2005-0382. [DOI] [PubMed] [Google Scholar]
- Kerr F, Rickle A, Nayeem N, Brandner S, Cowburn RF, Lovestone S. PTEN, a negative regulator of PI3 kinase signalling, alters tau phosphorylation in cells by mechanisms independent of GSK-3. FEBS Lett. 2006;580:3121–3128. doi: 10.1016/j.febslet.2006.04.064. [DOI] [PubMed] [Google Scholar]
- Kumar N, Dey CS. Metformin enhances insulin signalling in insulin-dependent and-independent pathways in insulin resistant muscle cells. Br J Pharmacol. 2002;137:329–336. doi: 10.1038/sj.bjp.0704878. [DOI] [PMC free article] [PubMed] [Google Scholar]
- Kurlawalla-Martinez C, Stiles B, Wang Y, Devaskar SU, Kahn BB, Wu H. Insulin hypersensitivity and resistance to streptozotocin-induced diabetes in mice lacking PTEN in adipose tissue. Mol Cell Biol. 2005;25:2498–2510. doi: 10.1128/MCB.25.6.2498-2510.2005. [DOI] [PMC free article] [PubMed] [Google Scholar]
- Lester-Coll N, Rivera EJ, Soscia SJ, Doiron K, Wands JR, de la Monte SM. Intracerebral streptozotocin model of type 3 diabetes: relevance to sporadic Alzheimer's disease. J Alzheimer's Dis. 2006;9:13–33. doi: 10.3233/jad-2006-9102. [DOI] [PubMed] [Google Scholar]
- Levin BE, Dunn-Meynell AA, Routh VH. Brain glucosensing and the K(ATP) channel. Nat Neurosci. 2001;4:459–460. doi: 10.1038/87405. [DOI] [PubMed] [Google Scholar]
- McClean PL, Parthsarathy V, Faivre E, Holscher C. The diabetes drug liraglutide prevents degenerative processes in a mouse model of Alzheimer's disease. J Neurosci. 2011;31:6587–6594. doi: 10.1523/JNEUROSCI.0529-11.2011. [DOI] [PMC free article] [PubMed] [Google Scholar]
- Nayeem N, Kerr F, Naumann H, Linehan J, Lovestone S, Brandner S. Hyperphosphorylation of tau and neurofilaments and activation of CDK5 and ERK1/2 in PTEN-deficient cerebella. Mol Cell Neurosci. 2007;34:400–408. doi: 10.1016/j.mcn.2006.11.014. [DOI] [PubMed] [Google Scholar]
- Okada T, Kawano Y, Sakakibara T, Hazeki O, Ui M. Essential role of phosphatidylinositol 3-kinase in insulin-induced glucose transport and antilipolysis in rat adipocytes. Studies with a selective inhibitor wortmannin. J Biol Chem. 1994;269:3568–3573. [PubMed] [Google Scholar]
- Pannu R, Singh I. Pharmacological strategies for the regulation of inducible nitric oxide synthase: neurodegenerative versus neuroprotective mechanisms. Neurochem Int. 2006;49:170–182. doi: 10.1016/j.neuint.2006.04.010. [DOI] [PubMed] [Google Scholar]
- Plum L, et al. Enhanced PIP3 signaling in POMC neurons causes KATP channel activation and leads to diet-sensitive obesity. J Clin Invest. 2006;116:1886–1901. doi: 10.1172/JCI27123. [DOI] [PMC free article] [PubMed] [Google Scholar]
- Plum L, Schubert M, Bruning JC. The role of insulin receptor signaling in the brain. Trends Endocrinol Metab. 2005;16:59–65. doi: 10.1016/j.tem.2005.01.008. [DOI] [PubMed] [Google Scholar]
- Rickle A, Bogdanovic N, Volkmann I, Zhou X, Pei JJ, Winblad B, Cowburn RF. PTEN levels in Alzheimer's disease medial temporal cortex. Neurochem Int. 2006;48:114–123. doi: 10.1016/j.neuint.2005.08.014. [DOI] [PubMed] [Google Scholar]
- Risner ME, Saunders AM, Altman JF, Ormandy GC, Craft S, Foley IM, Zvartau-Hind ME, Hosford DA, Roses AD. Efficacy of rosiglitazone in a genetically defined population with mild-to-moderate Alzheimer's disease. Pharmacogenomics J. 2006;6:246–254. doi: 10.1038/sj.tpj.6500369. [DOI] [PubMed] [Google Scholar]
- Sasaoka T, Wada T, Tsuneki H. Lipid phosphatases as a possible therapeutic target in cases of type 2 diabetes and obesity. Pharmacol Ther. 2006;112:799–809. doi: 10.1016/j.pharmthera.2006.06.001. [DOI] [PubMed] [Google Scholar]
- Schwock J, Dhani N, Hedley DW. Targeting focal adhesion kinase signaling in tumor growth and metastasis. Expert Opin Ther Targets. 2010;14:77–94. doi: 10.1517/14728220903460340. [DOI] [PubMed] [Google Scholar]
- Serpente N, Birling MC, Price J. The regulation of the expression, phosphorylation, and protein associations of pp125FAK during rat brain development. Mol Cell Neurosci. 1996;7:391–403. doi: 10.1006/mcne.1996.0028. [DOI] [PubMed] [Google Scholar]
- Siciliano JC, Toutant M, Derkinderen P, Sasaki T, Girault JA. Differential regulation of proline-rich tyrosine kinase 2/cell adhesion kinase beta (PYK2/CAKbeta) and pp125(FAK) by glutamate and depolarization in rat hippocampus. J Biol Chem. 1996;271:28942–28946. doi: 10.1074/jbc.271.46.28942. [DOI] [PubMed] [Google Scholar]
- Steen E, Terry BM, Rivera EJ, Cannon JL, Neely TR, Tavares R, Xu XJ, Wands JR, de la Monte SM. Impaired insulin and insulin-like growth factor expression and signaling mechanisms in Alzheimer's disease—is this type 3 diabetes. J Alzheimer's Dis. 2005;7:63–80. doi: 10.3233/jad-2005-7107. [DOI] [PubMed] [Google Scholar]
- Subramaniam S, Zirrgiebel U, von Bohlen Und Halbach O, Strelau J, Laliberte C, Kaplan DR, Unsicker K. ERK activation promotes neuronal degeneration predominantly through plasma membrane damage and independently of caspase-3. J Cell Biol. 2004;165:357–369. doi: 10.1083/jcb.200403028. [DOI] [PMC free article] [PubMed] [Google Scholar]
- Talbot K, et al. Demonstrated brain insulin resistance in Alzheimer's disease patients is associated with IGF-1 resistance, IRS-1 dysregulation, and cognitive decline. J Clin Invest. 2012;122:1316–1338. doi: 10.1172/JCI59903. [DOI] [PMC free article] [PubMed] [Google Scholar]
- Tamura M, Gu J, Danen EH, Takino T, Miyamoto S, Yamada KM. PTEN interactions with focal adhesion kinase and suppression of the extracellular matrix-dependent phosphatidylinositol 3-kinase/Akt cell survival pathway. J Biol Chem. 1999;274:20693–20703. doi: 10.1074/jbc.274.29.20693. [DOI] [PubMed] [Google Scholar]
- Toutant M, Studler JM, Burgaya F, Costa A, Ezan P, Gelman M, Girault JA. Autophosphorylation of Tyr397 and its phosphorylation by Src-family kinases are altered in focal-adhesion-kinase neuronal isoforms. Biochem J. 2000;348:119–128. [PMC free article] [PubMed] [Google Scholar]
- van der Heide LP, Hoekman MF, Biessels GJ, Gispen WH. Insulin inhibits extracellular regulated kinase 1/2 phosphorylation in a phosphatidylinositol 3-kinase (PI3) kinase-dependent manner in Neuro2a cells. J Neurochem. 2003;86:86–91. doi: 10.1046/j.1471-4159.2003.01828.x. [DOI] [PubMed] [Google Scholar]
- van der Heide LP, Ramakers GM, Smidt MP. Insulin signaling in the central nervous system: learning to survive. Prog Neurobiol. 2006;79:205–221. doi: 10.1016/j.pneurobio.2006.06.003. [DOI] [PubMed] [Google Scholar]
- Vinciguerra M, Veyrat-Durebex C, Moukil MA, Rubbia-Brandt L, Rohner-Jeanrenaud F, Foti M. PTEN down-regulation by unsaturated fatty acids triggers hepatic steatosis via an NF-kappaBp65/mTOR-dependent mechanism. Gastroenterology. 2008;134:268–280. doi: 10.1053/j.gastro.2007.10.010. [DOI] [PubMed] [Google Scholar]
- Wijesekara N, et al. Muscle-specific PTEN deletion protects against insulin resistance and diabetes. Mol Cell Biol. 2005;25:1135–1145. doi: 10.1128/MCB.25.3.1135-1145.2005. [DOI] [PMC free article] [PubMed] [Google Scholar]
- Williamson R, et al. Rapid tyrosine phosphorylation of neuronal proteins including tau and focal adhesion kinase in response to amyloid-beta peptide exposure: involvement of Src family protein kinases. J Neurosci. 2002;22:10–20. doi: 10.1523/JNEUROSCI.22-01-00010.2002. [DOI] [PMC free article] [PubMed] [Google Scholar]
- Wu M, et al. Aging-associated dysfunction of Akt/protein kinase B: S-nitrosylation and acetaminophen intervention. PLoS One. 2009;4:e6430. doi: 10.1371/journal.pone.0006430. [DOI] [PMC free article] [PubMed] [Google Scholar]
- Xu YX, Wang HQ, Yan J, Sun XB, Guo JC, Zhu CQ. Antibody binding to cell surface amyloid precursor protein induces neuronal injury by deregulating the phosphorylation of focal adhesion signaling related proteins. Neurosci Lett. 2009;465:276–281. doi: 10.1016/j.neulet.2009.09.022. [DOI] [PubMed] [Google Scholar]
- Yamada KM, Araki M. Tumor suppressor PTEN: modulator of cell signaling, growth, migration and apoptosis. J Cell Sci. 2001;114:2375–2382. doi: 10.1242/jcs.114.13.2375. [DOI] [PubMed] [Google Scholar]
- Zhang X, Li F, Bulloj A, Zhang YW, Tong G, Zhang Z, Liao FF, Xu H. Tumor-suppressor PTEN affects tau phosphorylation, aggregation, and binding to microtubules. FASEB J. 2006;20:1272–1274. doi: 10.1096/fj.06-5721fje. [DOI] [PubMed] [Google Scholar]
- Zhang X, Zhang G, Zhang H, Karin M, Bai H, Cai D. Hypothalamic IKKbeta/NF-kappaB and ER stress link overnutrition to energy imbalance and obesity. Cell. 2008;135:61–73. doi: 10.1016/j.cell.2008.07.043. [DOI] [PMC free article] [PubMed] [Google Scholar]
- Zhao WQ, Alkon DL. Role of insulin and insulin receptor in learning and memory. Mol Cell Endocrinol. 2001;177:125–134. doi: 10.1016/s0303-7207(01)00455-5. [DOI] [PubMed] [Google Scholar]
Associated Data
This section collects any data citations, data availability statements, or supplementary materials included in this article.