

A series of mathematical models was used to quantitatively characterize pheromone-stimulated kinase activation and determine how mitogen-activated protein (MAP) kinase specificity is achieved. The findings reveal how feedback phosphorylation of a common pathway component can limit the activity of a competing MAP kinase through feedback phosphorylation of a common activator, and thereby promote signal fidelity.
Abstract
Different environmental stimuli often use the same set of signaling proteins to achieve very different physiological outcomes. The mating and invasive growth pathways in yeast each employ a mitogen-activated protein (MAP) kinase cascade that includes Ste20, Ste11, and Ste7. Whereas proper mating requires Ste7 activation of the MAP kinase Fus3, invasive growth requires activation of the alternate MAP kinase Kss1. To determine how MAP kinase specificity is achieved, we used a series of mathematical models to quantitatively characterize pheromone-stimulated kinase activation. In accordance with the computational analysis, MAP kinase feedback phosphorylation of Ste7 results in diminished activation of Kss1, but not Fus3. These findings reveal how feedback phosphorylation of a common pathway component can limit the activity of a competing MAP kinase through feedback phosphorylation of a common activator, and thereby promote signal fidelity.
INTRODUCTION
A measure of our understanding of any biological system is our ability to predict its behavior in detail. Thus an emerging strategy is to construct computational models of dynamic changes that occur in response to cellular stimuli. Such models have revealed how small changes outside a cell are amplified and how graded signals are converted to all-or-none responses (Ferrell and Machleder, 1998). In addition to investigating mechanisms that reinforce signaling, many studies have focused on mechanisms that attenuate pathway activity. These studies have demonstrated how negative feedback ensures sustained external signals are not propagated indefinitely (Bhalla and Iyengar, 1999; Yi et al., 2003; Komarova et al., 2005; Yu et al., 2008; Cirit et al., 2010), provides a mechanism for dose-response alignment (Yu et al., 2008), ensures a linear response (Sturm et al., 2010), and increases the robustness of signaling networks (Sturm et al., 2010; Fritsche-Guenther et al., 2011). Previously, we used a combination of experimental analysis and mathematical modeling to identify positive and negative regulators of pathway activity in yeast signaling systems (Hao et al., 2003, 2007). In this study, we used analogous methods to determine how activation of one signaling pathway limits the activity of a second, parallel pathway (cross-inhibition).
For our studies, we investigated a developmental decision in the budding yeast Saccharomyces cerevisiae. Yeast cells can initiate either a mating or an invasive growth program, depending on the presence or absence of specific external cues (Figure 1A). Mating is initiated when a and α haploid cell types secrete and respond to type-specific pheromones acting through G protein–coupled receptors (Wang and Dohlman, 2004). Alternatively, invasive growth occurs in nutrient-poor conditions (Truckses et al., 2004). Combined genetic and biochemical studies revealed that mating and invasive growth require a protein kinase cascade composed of Ste20, Ste11, and Ste7 (Wang and Dohlman, 2004). The pathways diverge at the level of the mitogen-activated protein (MAP) kinase. Whereas deletion of one MAP kinase gene (KSS1) severely impairs invasive growth in haploid cells (Roberts and Fink, 1994; Cook et al., 1997), deletion of another MAP kinase gene (FUS3) impairs pheromone-induced growth arrest. Deletion of FUS3 additionally leads to enhanced Kss1 activation (Sabbagh et al., 2001), Kss1-mediated gene transcription (Madhani and Fink, 1997), and invasive growth behavior (Roberts and Fink, 1994). Thus Kss1 is needed for invasive growth, while Fus3 appears to simultaneously promote mating and suppress invasion (Roberts and Fink, 1994; Madhani and Fink, 1997; Cook et al., 1997; Sabbagh et al., 2001).
FIGURE 1:

Fus3 attenuates Kss1 activity. (A) Components of the mating and invasive-growth pathways. Activation steps are indicated with arrows. Inhibition steps are indicated with a T-shaped line. Ptp2/3 inhibition of Kss1 is presumed but not documented. (B) Wild-type or mutant cells in which Fus3 had been genetically deleted (fus3Δ) or replaced with the catalytically inactive fus3K42R mutant were treated with α factor pheromone (3 μM) for the times indicated, and whole-cell extracts were resolved by 12% SDS–PAGE and immunoblotting with anti–phospho p42/44 antibodies, which recognize the phosphorylated and activated form of Fus3 (p-Fus3) and Kss1 (p-Kss1), or anti-Pgk1 antibodies as a loading control. Data are representative of three or more experiments with similar results. Analysis of (C) fus3Δ strain transformed with a single-copy plasmid expressing analogue-sensitive Fus3Q93A or (D) kss1Δ strain expressing analogue-sensitive Kss1E94A treated with DMSO or 10 μM 1-NM-PP1 for 15 min prior to 3 μM α factor for the time course shown. Whole-cell extracts were resolved, and proteins were detected by immunoblotting by using anti–phospho p44/42, anti-Kss1, anti-Fus3, and anti-G6PDH antibodies (loading control).
Past investigations have uncovered one mechanism by which the mating MAP kinase, Fus3, suppresses the invasive growth program. On pheromone stimulation, Fus3 phosphorylates a key transcription factor in the invasive pathway, Tec1. The protein is then desumoylated, ubiquitinated, and subsequently degraded (Bao et al., 2004; Bruckner et al., 2004; Chou et al., 2004; Wang and Dohlman, 2006; Wang et al., 2009). As a consequence, Tec1 is no longer available to be activated by Kss1. This cannot be the only mechanism of cross-pathway inhibition, however, because Kss1 is hyperactivated when Fus3 is absent or inactive (Sabbagh et al., 2001). Thus additional mechanisms of cross-talk regulation must exist and be acting upstream of the transcription factors. In this paper, we demonstrate that Fus3 phosphorylation of a shared upstream component dampens Kss1 activity while preserving Fus3 function. These findings reveal a new mechanism of feedback inhibition leading to selective pathway activation.
RESULTS
Inhibition of Kss1 by Fus3
Although the molecular mechanisms of MAP kinase activation are well established, it is not known how Fus3 limits the activity of Kss1. To investigate Kss1 regulation by Fus3, we monitored their time-dependent activity using antibodies that recognize the dually phosphorylated and activated forms of both kinases. Figure 1B shows time-course data for pheromone-stimulated MAP kinase phosphorylation. In wild-type cells, phosphorylated Kss1 and Fus3 levels rise rapidly and then decline to near-baseline levels after 120 min of stimulation. The largest difference in temporal profiles of the two kinases is in the kinetics of activation, with Kss1 becoming highly phosphorylated after ∼ 5 min, while Fus3 phosphorylation increases more slowly, peaking 30–60 min after the initial stimulus.
Consistent with previous investigations, we found that Kss1 activation is increased in cells that either lack Fus3 or express a catalytically inactive Fus3K42R mutant (Figure 1B; Gartner et al., 1992; Roberts and Fink, 1994; Madhani and Fink, 1997; Sabbagh et al., 2001). However, previous studies did not establish the mechanism by which Fus3 limits Kss1 activation. Given that Kss1 phosphorylation is affected as early as 5 min after stimulation with pheromone, we reasoned that the observed regulation likely involves a rapid posttranslational modification. In addition, deletion of Fus3 increases the abundance of Kss1 (Andersson et al., 2004; Wu et al., 2011). To determine whether increased Kss1 activation can occur without increased expression, we inhibited Fus3 immediately prior to pheromone addition, using an analogue-sensitive mutant, Fus3Q93A (FUS3-as). We treated FUS3-as cells with the ATP analogue 1-NM-PP1 for 15 min prior to stimulation with pheromone (Figure 1C; Bishop et al., 2000; Yu et al., 2008). In the presence of inhibitor, Kss1 phosphorylation is still elevated, even while Kss1 expression remains unchanged. Under these same conditions, Fus3 phosphorylation is also elevated, as is the rate at which it is phosphorylated (Figure 1B, compare fus3K42R and WT, and FUS3-as with or without analogue). Thus Fus3 serves to dampen activation of both MAP kinases within 5 min of pheromone stimulation. In contrast, disruption of Kss1 activity using the analogue-sensitive Kss1E94A does not affect the activation profiles of either Fus3 or Kss1 (Figure 1D). Hence Fus3, but not Kss1, has a major role in feedback regulation. In light of these results, we next used a predictive computational approach to investigate potential regulatory mechanisms and generate a testable model.
Mathematical models
On the basis of the above observations, we developed a series of six computational models that describe the inhibition of Kss1 by Fus3. The common elements of all six models are shown in Figure 2A, I. Figure 2A, II–IV, illustrates the different biochemical mechanisms considered by each model. All six models include the known positive regulator (Ste7) and three negative regulators of the pathway (Msg5, Ptp2, and Ptp3). Each model considers that transcription of MSG5 and FUS3 is induced by mating pheromone (Roberts et al., 2000), producing a corresponding increase in protein abundance. Fus3 and Kss1 might phosphorylate and inactivate some upstream signaling protein. Any feedback loop at or above the MAP kinase kinase Ste7 is expected to affect activation of both Fus3 and Kss1 equally. However, feedback phosphorylation of Ste7 might serve as a mechanism of cross-inhibition if feedback differentially affects activation of Fus3 and Kss1. Kss1 and Fus3 are partially redundant, but both kinases have distinct substrate preferences and display distinct spatial, temporal, and kinetic properties in vivo (Breitkreutz et al., 2001; Sabbagh et al., 2001; Hao et al., 2008a). Fus3 was shown previously to phosphorylate Ste7 (Errede et al., 1993; Zhou et al., 1993) at approximately seven residues (Maleri et al., 2004). Alternatively, the MAP kinases might phosphorylate and activate some downstream inhibitor, such as a protein phosphatase. Phosphorylation of both Thr-183 and Tyr-185 within Kss1 is necessary for its activation, so dephosphorylation of either residue is sufficient for its inactivation. Fus3 phosphorylates Msg5 (Doi et al., 1994), a dual-specificity phosphatase. In addition, the two protein tyrosine phosphatases Ptp2 and Ptp3 have been implicated in the regulation of Fus3 (Zhan et al., 1997; Zhan and Guan, 1999). However, a role for these phosphatases in the regulation of Kss1 has never been demonstrated.
FIGURE 2:

Six models of Fus3-mediated attenuation of Kss1 activity. (A) I, A schematic diagram of the pathway elements common to all six models. All the models include the positive regulator Ste7 and MAP kinase–dependent induction of Msg5 and Fus3. The phosphatases Ptp2 and Ptp3 are also present in all six models. II–IV, models representing different mechanisms of regulation (red lines and arrows). Model IIa states that Fus3- (and Kss1-) dependent negative feedback decreases activation of both Fus3 and Kss1. Model IIb states that Fus3- (and Kss1-) dependent negative feedback increases deactivation of both Fus3 and Kss1. Model III states that Fus3 phosphorylates and activates all three phosphatases, Ptp2, Ptp3, and Msg5. Model IVa states that the rate of Kss1 phosphorylation and activation (Kss1 conversion to p-Kss1) is inversely proportional to the amount of active Fus3 (p-Fus3). In this model, the phosphatases Msg5 and Ptp2/3 are constitutively active. Model IVb states that Kss1 inactivation is proportional to active Fus3. Again the three phosphatases are taken to be constitutively active. (B) The SSD between the experimental data and output of the six models vs. the number of accepted realizations in the Monte Carlo optimization routine. A smaller SSD indicates a better fit to the data.
With the above considerations in mind, we constructed six models to investigate potential mechanisms of feedback regulation. Model I assumes that Fus3 does not alter the catalytic activity of any inhibitor or activator, but relies only on the transcriptional induction of the negative regulator Msg5. Increased expression of Msg5 is evident 30–60 min after pheromone stimulation (Supplemental Figure S1). This slow accumulation of protein rules out transcriptional induction as a major mechanism of Kss1 inhibition and makes model I suitable as a negative control. Model IIa considers a MAP kinase–dependent negative feedback that decreases the activation of both Fus3 and Kss1. Maleri et al. (2004) have demonstrated a MAP kinase–mediated feedback loop that acts above Ste7. This negative feedback loop is mediated by both Fus3 and Kss1 and affects activation of both kinases equally. To implement this model, we assume that the rate at which Ste7 phosphorylates Fus3 and Kss1 is inversely proportional to the amount of total MAP kinase activity (Fus3 and Kss1). Model IIb does not assume a specific biochemical mechanism, but instead the rates of Fus3 and Kss1 deactivation are proportional to the amount of total activated MAP kinase. In model III, we consider a feedback mechanism that depends on the known phosphatases of MAP kinases. This model allows the possibility that one or both MAP kinases can phosphorylate and activate any combination of the three phosphatases Ptp2, Ptp3, and Msg5. Model IVa and b consider mechanisms of cross-inhibition. In model IVa, Fus3 acts upstream of Kss1. In this model, the rate of Kss1 activation is inversely proportional to the amount of active Fus3. Finally in model IVb, the rate of Kss1 deactivation is proportional to the amount of activated Fus3. Model IVb would be expected to perform best if, for example, an as-yet-unidentified phosphatase underlies Fus3-dependent inhibition of Kss1.
Because Ste7 is the most downstream kinase shared by both the pheromone and invasive-growth pathways, all the models start with this protein. An efficient experimental method for quantitatively measuring Ste7 activity is not currently available. Therefore we considered two general time profiles for Ste7 activity. Given that Kss1 activation is rapid, with peak activity occurring around 5 min, both profiles assume that Ste7 activation occurs immediately. Various regulatory mechanisms limit signaling activity above Ste7, including Bar1-mediated degradation of pheromone, induction of the RGS protein Sst2, and receptor endocytosis. Therefore we investigated two temporal profiles for Ste7 activity. In the first scenario, the temporal profile of Ste7 activity takes the form of a decreasing Hill function. This profile is motivated by our previous investigations, which suggest that the duration of signaling activity is determined by the pheromone concentration and that this dose-to-duration conversion occurs upstream of MAP kinase activation (Behar et al., 2008; Hao et al., 2008a). In the second case, Ste7 activity decays exponentially over time. In either case, the time needed for Ste7 activity to decrease to half its maximum is taken as a free parameter, which is determined by fitting the models to experimental data. The decreasing Hill function is used, because this scenario produced better overall fits to the data (Figure S2). However, the relative performance of the models did not depend on the choice of input signal.
Full details of all the models and the corresponding mathematical equations are given in Materials and Methods.
Evaluation of the models
To fit the models to the data, we chose a Monte Carlo approach based on the Metropolis algorithm (Brown et al., 2004; Yu et al., 2007; Cirit et al., 2010). This optimization method samples the parameter space using a random walk that is biased toward parameter sets that minimize the sum of the squared differences (SSD) between the model output and experimental data. This technique has several advantages over other methods for performing nonlinear regression. The finite probability of accepting suboptimal parameter sets allows the algorithm to escape from local minima in parameter space. The algorithm does not generate a single optimal parameter set, but rather a family of parameter sets that each produces approximately equivalent fits to the data. This feature allows confidence intervals to be placed on model predictions. Finally, the distributions for the model parameter values generated by the algorithm provide a measure of how well the experimental data constrain the model. Thus differences between the models are attributable to differences in biochemical characteristics rather than the choice of parameter values.
All six models were fit to the time-course data for Fus3 and Kss1 activation obtained from wild-type cells as well as from cells that: 1) express the analogue-sensitive Fus3 mutant (Fus3Q93A) pretreated with 1-NM-PP1, 2) express a twofold excess of each MAP kinase (2 × FUS3 and 2 × KSS1), 3) express a twofold excess of each phosphatase (2 × MSG5, 2 × PTP2, and 2 × PTP3), or 4) lack each of these components (kss1Δ, msg5Δ, ptp2Δ, ptp3Δ, and ptp2 ptp3Δ double mutant). The full set of results is shown in Figures 3 and S3–S8. A discussion of how the experimental data were normalized is given in Materials and Methods. Figure 2B shows a plot of the SSD versus the number of accepted realizations in the Monte Carlo optimization process for each of the six models. The results for model IVa, which performed the best (minimum SSD), are given in Figure 3. As expected, model I performed most poorly. It failed to capture the changes in Kss1 activity when Fus3 was inhibited (Figure 4, left column, top row) or overexpressed (Figure 4, left column, center row). Models IIa, IIb, III, and VIb performed equally well, but consistently worse than model IVa. Models IIa and IIb included the possibility that Kss1, together with Fus3, could contribute to feedback regulation.
FIGURE 3:

Results for model IVa. Comparison of experimental data and best-fit modeling results for model IVa. Red solid circles represent experimental data of active Kss1 (y-axis: p-Kss1) or active Fus3 (y-axis: p-Fus3) for wild type normalized to the maximum (100% activation); black solid circles represent experimental data for deletion mutants, analogue-sensitive FUS3 mutant, or twofold overexpression strains. The corresponding red, blue, and black curves are model results. Experimental data and model simulations of total protein level inductions of Fus3 (y-axis: Fus3 total) and Msg5 (y-axis: Msg5 total) are also shown.
FIGURE 4:

Performance of the alternative models. The columns present illustrative results for the alternative models that demonstrate these models’ inability to capture the experimental data. Three results were selected for each model that best reflect the differences between the model and the best-performing model, model IVa (Figure 3). The results are presented in the same format as in Figure 3. The complete sets of results for each model are shown in Figures S3–S8.
Models IIa, IIb, and III show significant differences from model IVa in their ability to capture experimental data of MAP kinase activation. In particular, model IIa (in which Fus3-dependent feedback decreases MAP kinase activation) cannot capture Fus3 phosphorylation when Fus3 is inhibited (Figure 4, second column, top row) or Kss1 activation when Fus3 is overexpressed (Figure 4, second column, center row). Model IIb (in which Fus3 increases deactivation of MAP kinases) does not reproduce Fus3 activation when Fus3 is inhibited (Figure 4, third column, top row) and cannot capture Fus3 activity in the Ptp2/3 deletion strain (Figure 4, third column, bottom row). Model III (in which Fus3 activates all three known phosphatases) cannot capture the rapid increase in Kss1 activity observed when Fus3 is inhibited (Figure 4, fourth column, top row) or the effect of overexpressing Fus3 on Kss1 activity (Figure 4, fourth column, bottom row). The failure of these three models suggests Fus3-mediated feedback may differentially affect Kss1 and Fus3. In support of such a scenario, model IVa (in which Fus3 decreases the rate at which Kss1 is phosphorylated) captures the rapid increase in Kss1 activity when Fus3 is inhibited, as well as all the experimental data (Figure 3). While model IVb (in which Fus3 increases the rate at which Kss1 is dephosphorylated) also produces a rapid increase in Kss1 activity when Fus3 is inhibited (Figure S8), it could not reproduce the effects on Fus3 and Kss1 activity when both PTP2 and PTP3 are deleted (Figure 4, right column)
Experimental validation of model IVa
Our findings above show excellent agreement between model IVa and the available experimental data. On this basis, we postulated that feedback phosphorylation underlies the ability of Fus3 to inhibit Kss1 activity (Figure S7). Candidate targets of feedback inhibition include all upstream kinases, including Ste20, Ste11, and Ste7. We did not consider the kinase scaffold protein Ste5, given that it is required for the activation of Fus3, but not Kss1 (Breitkreutz et al., 2001; Andersson et al., 2004; Maleri et al., 2004; Flatauer et al., 2005). Of the remaining candidates, Ste7 is the most proximal to Fus3 and Kss1, and therefore represents a likely target for feedback regulation. Moreover, Fus3 was previously shown to phosphorylate Ste7, and the major sites have been identified (Maleri et al., 2004).
A key prediction of model IVa is that feedback phosphorylation of Ste7 limits activation of Kss1. To test this requirement, we monitored the consequences of blocking feedback regulation. As shown in Figure 5A, an Ste7 mutant lacking known sites of feedback phosphorylation (Ste7-A7) exhibits a significant elevation in Kss1 phosphorylation. For both wild type and Ste7-A7, the magnitude and duration of Kss1 activation (p-Kss1, red and black filled circles, respectively) are fully consistent with the predictions of model IVa (red and black solid lines, respectively). Notably, differences in Kss1 activation are evident within 5 min of pheromone treatment. Because this is well before Fus3 is fully activated, our findings imply that early (although submaximal) activation of Fus3 is sufficient to regulate Kss1.
FIGURE 5:

Fus3 attenuates Kss1 activity through feedback phosphorylation of Ste7. (A) Top, ste7Δ mutant cells transformed with a single-copy plasmid expressing either Ste7 or Ste7-A7 (lacks feedback phosphorylation sites) were treated with pheromone and analyzed by immunoblotting, as described in Figure 1. Bottom, the immunoblotting results were further quantified by scanning densitometry and compared with the prediction from model V. x-axis, a percentage of maximum of the wild-type response; red solid circles, experimental results for wild-type cells; black solid circles, experimental results for Ste7-A7 mutant. The corresponding red and black curves are predictions from model IVa. (B) Measurements of feedback phosphorylation of Ste7. Ste7-TAP or mutant cells (kss1Δ) were treated with α factor pheromone (3 μM) for the times indicated, and whole-cell extracts were resolved by 12% SDS–PAGE and immunoblotting. Ste7-TAP and phospho-Ste7-TAP (p-Ste7-TAP) were detected by using anti–protein A antibody. Active Kss1 and Fus3 were detected with anti–phospho p44/42 antibody. Anti-G6PDH antibody was used as a loading control. (C) Analysis of Ste7-A7, fus3Δ, and Ste7-A7/fus3Δ strains expressing pRS316-Fus3 (WT) or empty vector (fus3Δ) treated with 3 μM α-factor for 5 min. Whole-cell extracts were resolved as in Figure 1, and proteins were detected by immunoblotting by using anti–phospho p44/42, anti-Kss1, anti-Fus3, and anti-G6PDH antibodies. The graph on the bottom plots three independent experiments quantified by scanning densitometry. Bars represent SE ± mean. (D) The same cells as in (A) cotransformed with an FRE-lacZ reporter (pRS425-Ty1-lacZ) were treated with 3 μM α factor pheromone for 90 min, as indicated (+), and the resulting β-galactosidase activity was measured spectrofluorimetrically. Note that FRE (PRE-TCS) reporters show modest pheromone-induced expression, as previously noted (Baur et al., 1997; Sabbagh et al., 2001)
Another key prediction of model IVa is that feedback phosphorylation occurs rapidly, within 5 min of pheromone addition. To test this requirement, we monitored the electrophoretic mobility shift that accompanies feedback phosphorylation of Ste7 (Zhou et al., 1993). Because Kss1 can also phosphorylate Ste7, this experiment was done in the absence and in the presence of Kss1 expression. As shown in Figure 5B, both the wild-type and kss1Δ mutant strains yield equivalent shifts in Ste7 mobility over the entire time course of stimulation. Thus Kss1 is not necessary for feedback phosphorylation of Ste7, or at least not in response to pheromone stimulation. Moreover, Ste7 is fully phosphorylated within 5 min of pheromone treatment, consistent with the prediction that Fus3 acts quickly to limit the activation of Kss1.
To determine the contribution of Ste7 feedback phosphorylation to cross-inhibition, we monitored Kss1 activation in the absence of Fus3 or the Fus3-phosphorylation sites (Ste7-A7) or both. To account for changes in Kss1 expression, we calculated the ratio of phosphorylated to total Kss1. As shown in Figure 5C, the fraction of phosphorylated Kss1 is elevated in all of these mutant strains. Given that the Kss1 response to pheromone is equivalent in Ste7-A7 and in fus3D Ste7-A7 cells, we conclude that Fus3 limits Kss1 activation through phosphorylation of Ste7. Finally, to verify the functional importance of Ste7 phosphorylation, we measured Kss1-mediated transcription (Madhani and Fink, 1997). In full agreement with the model, the transcription response is substantially elevated in cells expressing the Ste7-A7 mutant (Figure 5D). Taken together, these findings indicate that feedback phosphorylation of Ste7 by Fus3 leads to dampened activation of Kss1.
DISCUSSION
In this study, we used an approach that combined quantitative experimental measurements with mathematical modeling to investigate mechanisms of feedback regulation in the pheromone response of yeast. Recently similar systems-level investigations have been applied to study signaling networks in yeast (Yu et al., 2008; Macia et al., 2009; Muzzey et al., 2009; Malleshaiah et al., 2010) and higher organisms (Cirit et al., 2010; Sprinzak et al., 2010; Sturm et al., 2010; Tay et al., 2010; Fritsche-Guenther et al., 2011; Purvis et al., 2012). These studies have led to novel findings that would not have been readily made by traditional experimental approaches and revealed design principles responsible for the complex behavior exhibited by sophisticated signaling circuits. Of particular relevance are mechanisms that attenuate signaling activity in mammalian MAP kinase networks. For example, Cirit et al. (2010) used a strategy very similar to one presented here to quantify the role of various negative feedback loops in the Erk1/2 MAP kinase pathway. Those studies nicely demonstrated that feedback inhibition of a MAP kinase by Erk1/2 is the dominant regulatory mode contributing to pathway desensitization. In a second study, Sturm et al. (2010) used mathematical modeling to reveal that the Erk1/2 pathway acts as a negative feedback amplifier to ensure a linear response over a large range of input signal strength. They then confirmed this prediction experimentally. Finally, Fritsche-Guenther et al. (2011) used a systems-level approach to demonstrate how negative feedback in MAP kinase signaling makes the system robust to fluctuations in protein levels.
Whereas previous studies focused on mechanisms that attenuate overall signaling activity, we performed a systems-level analysis to discover feedback mechanisms that underlie pathway specificity. Pathway specificity refers to the situation in which two signaling systems produce different physiological outcomes, despite sharing multiple pathway components. Understanding how signaling systems achieve pathway specificity represents a fundamental challenge in systems biology. Our investigations revealed a novel mechanism for pathway specificity in which one MAP kinase, Fus3, limits the activity of a competing MAP kinase, Kss1, through feedback phosphorylation of a common activator, Ste7. Specifically, we showed that under conditions in which Fus3 signaling is propagated, Ste7 is phosphorylated, and Kss1 activity is abrogated (Figure S10). These findings reveal a central role for Ste7 in promoting signal specificity. Previous findings have demonstrated a role of Ste7 in attenuating pathway activity. Following pheromone stimulation, Ste7 is phosphorylated by Ste11, and is subsequently ubiquitinated and degraded by the proteasome protease complex (Zhou et al., 1993; Neiman and Herskowitz, 1994; Wang et al., 2003). Thus Ste7 activity is modulated by both feed-forward and feedback phosphorylation mechanisms. Whereas feed-forward phosphorylation leads to rapid degradation of Ste7 and diminished signaling overall, feedback phosphorylation leads to redirection of Ste7 signaling from Kss1 to Fus3.
In addition to the cross-inhibition mechanism revealed in this study, the specificity of signal transduction can be regulated by other mechanisms (Saito, 2010), such as catalytic unlocking of a kinase by its scaffold (Good et al., 2009) or kinetic insulation by signaling dynamics (Behar et al., 2007; Hao and O'Shea, 2012). Signal specificity is also controlled at multiple levels of the same signaling pathways. Feedback phosphorylation of Ste7 represents just one of several mechanisms used in the yeast pheromone pathway. Pheromone stimulation also leads to selective degradation of the transcription factor Tec1. Tec1 acts downstream of Kss1, but not Fus3, and so selective inactivation of transcription is certain to contribute as well to maintaining pathway specificity (Bao et al., 2004; Bruckner et al., 2004; Chou et al., 2004). Regulating signal activity at various levels may be especially important in this pathway, given the multiple functions ascribed to Kss1. For example, Kss1 up-regulates gene expression when activated, but in its unphosphorylated form acts as a transcriptional repressor (Bardwell et al., 1998). MAP kinases can also contribute to physiological responses by phosphorylating substrates that regulate cell cycle arrest or morphological changes. Therefore inhibition of Kss1 and inhibition of its substrate Tec1 may have distinct functions, depending on circumstance. Alternatively, the existence of multiple mechanisms of cross-inhibition could provide redundancies that help to ensure that the system is robust in the face of environmental, internal, and genetic perturbations.
Given the conservation among MAP kinase pathways in all eukaryotes, we propose that cross-inhibition through feedback phosphorylation of upstream signaling components may represent a general mechanism for pathway specificity that is widely utilized in other MAP kinase signaling pathways in yeast and more complex organisms. For example, we have previously shown that in yeast, the high-osmolarity glycerol MAP kinase Hog1 limits the activation of Kss1 and Fus3, in part through feedback phosphorylation of a shared upstream adaptor protein, Ste50 (Hao et al., 2008b; Nagiec and Dohlman, 2012).
In summary, our work provides another example of the power of combining computational and experimental methods to decipher the design principles of cellular signaling networks. By quantitatively comparing the performance of multiple models of feedback regulation in the mating response of yeast, we were able to establish a novel mechanism for pathway specificity in which feedback phosphorylation of Ste7 selectively limits Kss1 activity to ensure a proper cellular response. Given the similarities of signaling pathways in yeast to those in other organisms, our results and methods should prove relevant to understanding signaling processing by cells in general.
MATERIALS AND METHODS
Strains and plasmids
Standard methods for the growth, maintenance, and transformation of yeast and bacteria, and for the manipulation of DNA, were used throughout. The yeast S. cerevisiae strains used in this study are BY4741 (MATa leu2Δ his3Δ met15Δ ura3Δ), BY4741-derived deletion mutants lacking ste7, fus3, kss1, ptp2, ptp3, msg5, or ptp2/ptp3 (ptp2::URA3, ptp3::KanMX), or BY4741 expressing STE7, FUS3, or MSG5 C-terminally fused to a tandem-affinity purification (TAP) tag (Open Biosystems, Huntsville, AL). All strains are BAR1+ and therefore do not undergo sustained arrest at the pheromone doses used. The filamentous-responsive element (FRE) transcription reporter (Ty1-lacZ) used in this study was described previously (Maleri et al., 2004).
Expression plasmids encoding STE7 (pNC752) and the feedback phosphorylation-deficient ste7A7 mutant (pNC769) were described previously (Maleri et al., 2004). Additional expression plasmids used in this study are those containing FUS3, KSS1, PTP2, PTP3, and MSG5. Each gene was amplified using flanking PCR primers that anneal 600 base pairs upstream or 600 base pairs downstream of the open reading frame. The PCR products were then subcloned to pRS316 and/or pRS305 (for pRS305-PTP2::URA3) and/or pRS306 (for pRS306- fus3K42R) (Invitrogen, Carlsbad, CA). Mutation of pRS316-FUS3 or pRS316-KSS1 to obtain the analogue-sensitive alleles FUS3Q93A or KSS1E94A was conducted with the QuikChange site-directed mutagenesis kit (Agilent, Santa Clara, CA) according to the manufacturer's directions. Expression plasmids or the corresponding empty vector control were transformed into cells and maintained in standard SCD dropout medium (Bio 101, Carlsbad, CA).
TCA acid extraction of protein for immunoblot analysis
Cells were collected to prechilled 50-ml tubes containing 10 mM NaN3 (final concentration) and centrifuged, and the cell pellets were stored at –80°C. Alternatively, in Figure 5B, cells were collected in prechilled 50-ml tubes containing trichloroacetic acid (TCA; 5% final concentration). For preparation of extracts, cell pellets were thawed on ice and resuspended in 250 μl of ice-cold TCA buffer (10 mM Tris, pH 8.0, 10% TCA, 25 mM NH4OAc, 1 mM EDTA). Cells were disrupted by vortexing with 100 μl of glass beads in five 1-min bursts with chilling on ice in between. Lysates were transferred to new tubes and centrifuged for 10 min at 16,000 × g at 4°C. Pellets were resuspended in 0.1 M Tris (pH 11.0) and 3% SDS, boiled for 5 min, and then centrifuged at 16,000 × g. The resulting supernatant was separated, and protein concentration was determined using the DC protein assay (Bio-Rad, Hercules, CA). Twenty micrograms of protein was used per time point.
Whole-cell protein extracts were resolved by 12% SDS–PAGE and immunoblotting with phospho-p42/44 antibody at 1:500 (9101L; Cell Signaling Technologies, Danvers, MA; Sabbagh et al., 2001), G6PDH antibody at 1:105 (Sigma-Aldrich, St. Louis, MO), or anti-protein A antibodies (Sigma-Aldrich). Immunoreactive species were visualized by chemiluminescent detection (Chemical ECL-Plus; Pierce, Rockford, IL) of horseradish peroxidase-conjugated antibodies (sc-2006; Santa Cruz Biotechnology, Santa Cruz, CA) at 1:10,000. The signal was visualized by chemiluminescent detection with minimal exposure to x-ray film. Band intensity was quantified by scanning densitometry with ImageJ (National Institutes of Health).
Selective inhibition of Fus3 or Kss1
Exponentially growing cells (OD600 ∼ 0.8) expressing Fus3Q93A or Kss1E94A were treated with dimethyl sulfoxide (DMSO) or 10 μM 1-NM-PP1, as previously described (Yu et al., 2008), with the exception that cells were treated with inhibitor or vehicle for 15 min prior to treatment with pheromone and collected before pheromone treatment (0 min time point).
Transcription reporter assay
Cell cultures bearing the Ty1-lacZ reporter were grown to A600 of 0.8, dispensed at 90 μl into a 96-well plate, and mixed with 10 μl of α-factor. After incubation at 30°C for 90 min, 20 μl of 130 mM PIPES (pH 7.2), 0.25% Triton-X100, and 0.5 mM fluorescein di-β-galactopyranoside (M0250; Marker Gene Technologies, Eugene, OR) was added to each well, mixed, and incubated at 37°C for 30 min. The reaction was stopped by the addition of 20 μl of 1 M Na2CO3. Fluorescence was quantified using a fluorescence plate reader at A750 nm (SpectraMax M5; Molecular Devices, Sunnyvale, CA).
Model equations
To investigate the mechanisms responsible for signal specificity between the yeast mating response and invasive growth pathways, we devised six differential equation models. Each model corresponds to a different mechanism of cross-inhibition. All six models assume that the total Kss1, Ptp2, and Ptp3 concentrations remain constant for the duration of the experiments. Our experimental results using TAP-tagged proteins strongly support this assumption (unpublished data). We have observed that Fus3 and Msg5 concentrations increase two- to threefold following stimulation with 3 μM of pheromone (see Figure S1C). Therefore all six models take pheromone-dependent transcriptional induction of Fus3 and Msg5 into account. We assumed that the initial values of active Kss1 and Fus3 were zero. In the fus3Δ strain, there is a significant amount of active Kss1 prior to stimulation. However, deletion of FUS3 increases the expression level of Kss1, and for this reason we did not include the fus3 deletion time series in the data set used to test the models. There is also a small increase in the amount of basal Fus3 activity in the Ste7A7 mutant. For simplicity, this slight elevation of activity was not considered in the models.
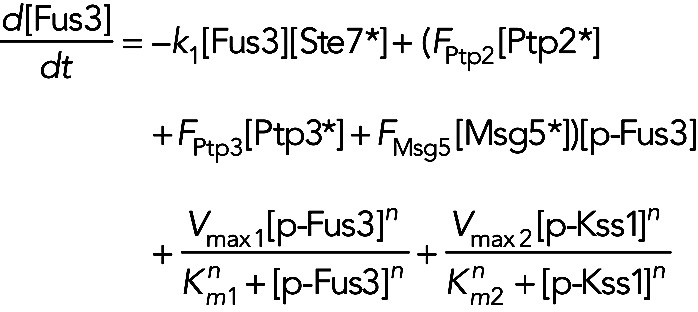
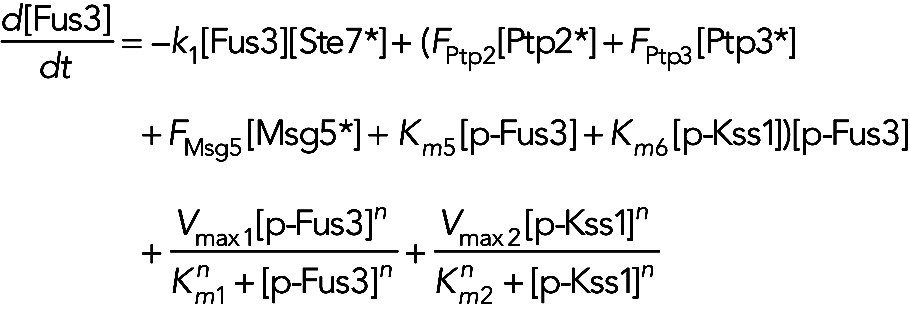
We investigated two functional forms for the temporal profile of active Ste7. Both scenarios ignore the initial activation phase of Ste7. This approximation is based on the observation that Kss1 activation is very rapid, with peak activity occurring around 10 min following pheromone stimulation. Because Ste7 activation must be at least this fast, it is reasonable to assume that Ste7 reaches maximum activation levels immediately following pheromone stimulation. In the first scenario, Ste7 activity follows a decreasing Hill function of the form [Ste7*] = [Ste7]0/[1 + (k5 t)n] (see Figure S2B), where [Ste7*]0 is the initial concentration of active Ste7 and the parameter k5 determines the time at which active Ste7 has been reduced to half its original value. This form of Ste7 activity was motivated by our previous work, which suggests that the upstream signaling proteins in the pheromone pathway function to convert pheromone dose information into signal duration (Behar et al., 2008). In the second scenario, the active Ste7 concentration [Ste7*] decreases exponentially in time. That is, the activity profile of Ste7 has the following form: [Ste7*] = [Ste7*]0 exp(−k5 t), where again [Ste7*]0 is the initial concentration of active Ste7 and k5 is the rate at which Ste7 activity decreases. To minimize the number of free parameters, we assumed a Hill coefficient of n = 8, which produces a step-like Ste7 response (Figure S2B) consistent with the profile suggested by our recent studies. We also assume that all Ste7 molecules are active at t = 0 and set [Ste7*]0 = 700 in both cases. The remaining parameter k5 in the active Ste7 time profiles is determined by fitting the models to the experimental data. In models I, III, IVa, and IVb, the unphosphorylated Fus3 concentration [Fus3] is governed by the following equation:
 (1) (1)
|
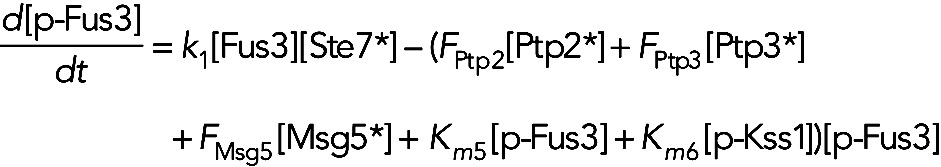
The first term on the right-hand side of Eq. 1 represents the phosphorylation of Fus3 by active Ste7. Our previous work demonstrated the slow phosphorylation rate of Fus3 depends on full catalytic activity (Hao et al., 2008a). That is, a mutant containing a “kinase-dead” version of Fus3 displayed rapid activation kinetics similar to Kss1. Therefore we allowed the rate constant k1′ for Fus3 activation in the inhibitor pretreated fus3-as strain to vary from the value k1 in strains containing wild-type Fus3. The second term in Eq. 1 models the dephosphorylation of Fus3 by the phosphatases Ptp2, Ptp3, and Msg5. Again, the symbol * indicates the active form of the phosphatases. The models make different assumptions about how the phosphatases are activated (see below). If a phosphatase is constitutively active, then the active form is equal to the total concentration of the phosphatase. The last two terms model Fus3- and Kss1-dependent induction of Fus3. We modeled transcriptional induction using Hill kinetics. The Hill coefficient was taken to be 2 and the Km and Vmax values were free parameters determined by fitting the models to experimental data. We did not include a term for degradation of Fus3, because its half-life was measured to greater than 2 h and increased upon stimulation with pheromone (Wang et al., 2006). The equation for the phosphorylated (active) Fus3 concentration, [p-Fus3], is given by
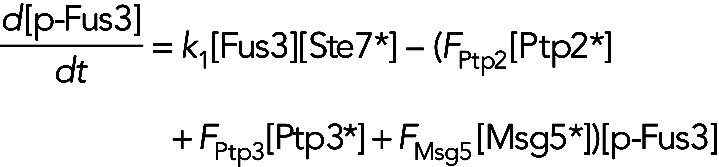 (2) (2)
|
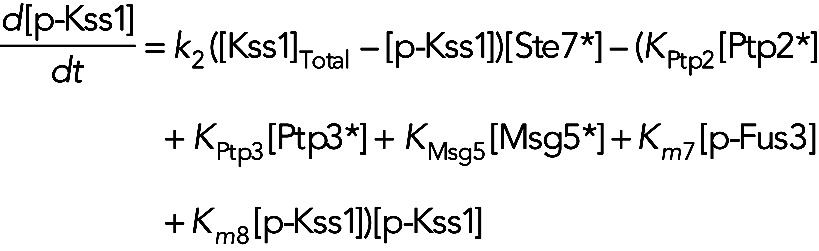
Because we assume that the total Kss1 concentration [Kss1]Total = [Kss1] + [p-Kss1] is constant in time, we only need to consider the active concentration [p-Kss1].
Model IIa assumes the phosphatases are constitutively active, but active forms of both Kss1 and Fus3 inhibit active Ste7. In this model, we have
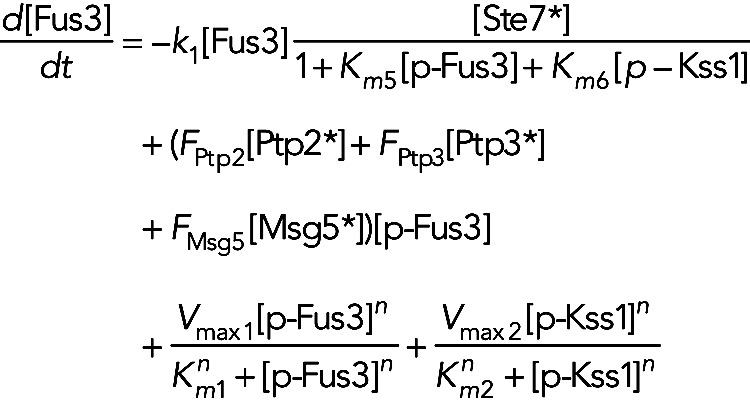 (3) (3)
|
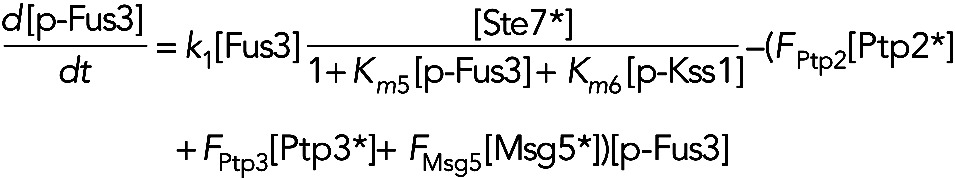 (4) (4)
|
 (5) (5)
|
Model IIb assumes the phosphatases Ptp2, Ptp3, and Msg5 are constitutively active, and Fus3 and Kss1 increase their own dephosphorylation rates. In this model, the equation for unphosphorylated Fus3, phosphorylated Fus3 and phosphorylated Kss1 become
 (6) (6)
|
 (7) (7)
|
 (8) (8)
|
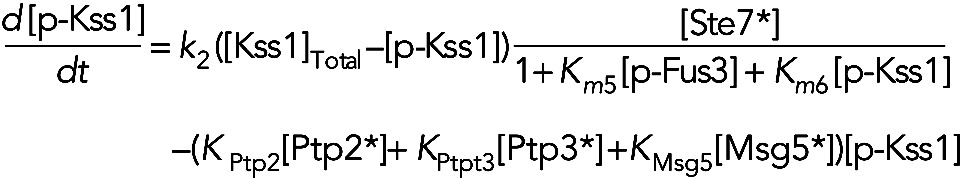
In model IVa, Fus3 inhibits the activation of Kss1, and the three phosphatases are constitutively active. This leads to the following equation for [p-Kss1]:
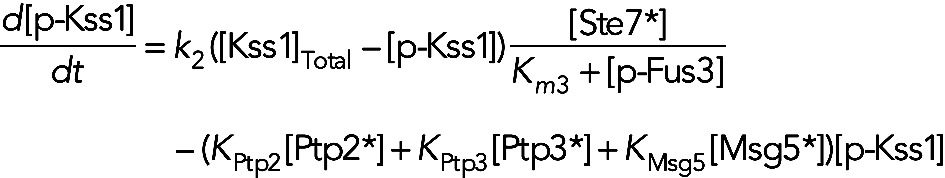 (9) (9)
|
In model IVb, the phosphatases are again assumed to be constitutively active, and Fus3 causes an increase in the dephosphorylation rate of Kss1 through a phosphatase-independent mechanism. In this case, the equation for [p-Kss1] is
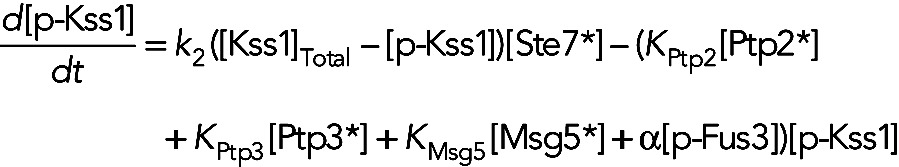 (10) (10)
|
where the term α[p-Fus3][p-Kss1] models the Fus3-dependent Kss1 dephosphorylation rate. For models I and III, the equation for [p-Kss1] is
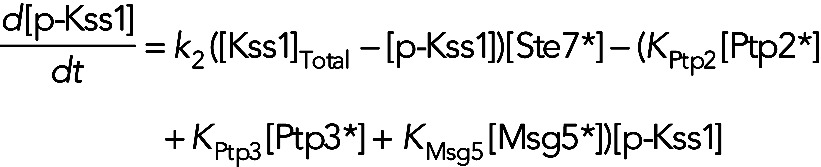 (11) (11)
|
In models I, II, and IV, Msg5 is constitutively active. In this case, the equation for [Msg5*] is
 (12) (12)
|
The first term on the right-hand side, k3, models the constitutive synthesis of Msg5. The second two terms model increased synthesis due to induction by Fus3 and Kss1, respectively. The Hill coefficient n was assumed to be 2 and the Km and Vmax values were free parameters estimated by fitting the models to experimental data. The final term in Eq. 12 models Msg5 degradation. For model III, in which Msg5 requires activation by Fus3, [Msg5] is substituted for [Msg5*] in Eq. 12, and the term − k8[Msg5][p-Fus3] is added to the right-hand side of this equation. The equation for the active Msg5 concentration is given by
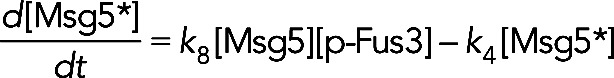 (13) (13)
|
where we have assumed that the degradation rates of the active and inactive forms of Msg5 are the same.
In model III, in which Fus3 phosphorylates and activates Ptp2 and Ptp3, the equations for the active form of these two phosphatases are
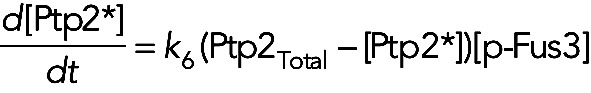 (14) (14)
|
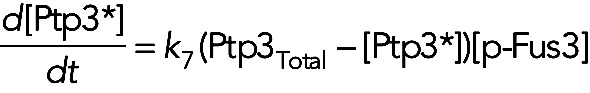 (15) (15)
|
where, for simplicity, we assume that the phosphatases are not dephosphorylated during the time course of the experiment. For models I, II, and IV, in which these two phosphatases are constitutively active, we have [Ptp2*] = [Ptp2]Total and [Ptp3*] = [Ptp3]Total for all times.
Normalizing the data
To estimate the parameter values of the six models, we used the time-course data shown in Figure S1. Each experiment was run with wild-type cells as a control. The experimental method used to measure MAP kinase activity only allows us to measure relative changes in activity. Therefore to compare the model output with data sets from different experimental runs requires a scaling of the experimental data in a way that does not alter the shape of the time-course data or change the relative relationships between the genetically altered strain and the wild-type control. In mathematical terms, if Xij represents the experimental measurement at time point i of the jth experiment, then Xij is related to the actual concentration by an unknown scale factor kj, which will vary for different experimental runs. Our method for selecting an appropriate set of scale factors is based on the assumption that the wild-type cells should respond in roughly an equivalent manner for each experimental run. Therefore, to find the scale factor kj for each experimental time course, we constructed an optimization problem that determines k values by minimizing the variability in the wild-type results.
Assume Xij represents the wild-type measurements and suppose we have m sets of time series containing n data points. To find the set of k values, we minimize the quantity
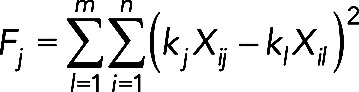 (16) (16)
|
for j = 1 to m and pick the set of k values that produced the overall minimum value of F. We then use this set of k values to scale the time series data for both the wild-type and genetically altered cells. In this way, we preserve the shape of the time courses and the relative ratios for the wild-type and genetically altered strains. Figure S2A shows times series for wild-type Fus3 and Kss1 activity using this scaling method. The solid black line connects the mean values at each time point. For the Fus3 and Msg5 total concentration data, the models were only fit to the shape of the curves.
Data fitting
For evaluation of the ability of each model to reproduce the experimental results, the ordinary differential equations presented above were fit to the experimental data using a Monte Carlo–based approach. The method makes use of the Metropolis algorithm, in which a Boltzmann factor containing the SSD between the experimental data and model output is used to generate acceptance probabilities for suboptimal parameter sets. In this way, the algorithm samples the parameter space using a random walk that is biased toward parameter sets that produce a good fit to the data. Briefly, the algorithm works as follows. An initial set of parameter values is picked. Using these parameter values, the model equations are solved for each experimental condition. The quantity exp(−SSD1/(2σ2)) is calculated, where SSD1 is the sum of the squared differences between the model output and the experimental results. Next, a candidate parameter set is generated at random. The distribution for the candidate parameter values is taken to be a multivariate Gaussian with the means equal to the current parameter values and SDs equal to a specified percentage of the mean values. This percentage is adjusted so that roughly 20% of the candidate sets are accepted. If the randomly chosen parameter values are less than zero, the candidate set is discarded and another candidate set is generated. The model equations are solved again with the candidate parameter set, and the quantity exp[−SSD2/(2σ2)] is computed, where SSD2 is sum of the squared differences using the candidate parameter set. If exp[−SSD1/(2σ2)] × exp[SSD2/(2 σ2)] > 1, then the candidate set produces a better fit to the data, and it is saved. Otherwise, a uniform random number r is generated, and the candidate set is saved if r < exp[−SSD1/(2 σ2)] × exp[SSD2/(2 σ2)]. The variance σ2 is estimated from the variability observed in the wild-type experimental data. If accepted, the candidate parameter set becomes the current set, and the process is repeated. Because there is a finite probability of accepting a suboptimal parameter set, the method has the advantage of being able to escape from local minima and can also be used to determine how well the parameter values are constrained by the data. The accepted parameter sets were recorded and plotted for model IVa in Figure S9.
Supplementary Material
Acknowledgments
The authors thank Ryan Shanks for his supervision of early experiments conducted by M.J.N. during his laboratory rotation. We also thank Daniel Lew for stimulating discussions and comments on the manuscript. The work was supported by National Institutes of Health grants GM073180 (H.G.D.), GM079271 (T.C.E.), and GM084071 (B.E.).
Abbreviations used:
- DMSO
dimethyl sulfoxide
- FRE
filamentous-responsive element
- MAP
mitogen-activated protein
- SSD
sum of the squared differences
- TAP
tandem-affinity purification
- TCA
trichloroacetic acid
Footnotes
This article was published online ahead of print in MBoC in Press (http://www.molbiolcell.org/cgi/doi/10.1091/mbc.E12-04-0333) on August 8, 2012.
*These authors contributed equally to this work.
REFERENCES
- Andersson J, Simpson DM, Qi M, Wang Y, Elion EA. Differential input by Ste5 scaffold and Msg5 phosphatase route a MAPK cascade to multiple outcomes. EMBO J. 2004;23:2564–2576. doi: 10.1038/sj.emboj.7600250. [DOI] [PMC free article] [PubMed] [Google Scholar]
- Bao MZ, Schwartz MA, Cantin GT, Yates JR, III, Madhani HD. Pheromone-dependent destruction of the Tec1 transcription factor is required for MAP kinase signaling specificity in yeast. Cell. 2004;119:991–1000. doi: 10.1016/j.cell.2004.11.052. [DOI] [PubMed] [Google Scholar]
- Bardwell L, Cook JG, Voora D, Baggott DM, Martinez AR, Thorner J. Repression of yeast Ste12 transcription factor by direct binding of unphosphorylated Kss1 MAPK and its regulation by the Ste7 MEK. Genes Dev. 1998;12:2887–2898. doi: 10.1101/gad.12.18.2887. [DOI] [PMC free article] [PubMed] [Google Scholar]
- Baur M, Esch RK, Errede B. Cooperative binding interactions required for function of the Ty1 sterile responsive element. Mol Cell Biol. 1997;17:4330–4337. doi: 10.1128/mcb.17.8.4330. [DOI] [PMC free article] [PubMed] [Google Scholar]
- Behar M, Dohlman HG, Elston TC. Kinetic insulation as an effective mechanism for achieving pathway specificity in intracellular signaling networks. Proc Natl Acad Sci USA. 2007;104:16146–16151. doi: 10.1073/pnas.0703894104. [DOI] [PMC free article] [PubMed] [Google Scholar]
- Behar M, Hao N, Dohlman HG, Elston TC. Dose-to-duration encoding and signaling beyond saturation in intracellular signaling networks. PLoS Comput Biol. 2008;4:e1000197. doi: 10.1371/journal.pcbi.1000197. [DOI] [PMC free article] [PubMed] [Google Scholar]
- Bhalla US, Iyengar R. Emergent properties of networks of biological signaling pathways. Science. 1999;283:381–387. doi: 10.1126/science.283.5400.381. [DOI] [PubMed] [Google Scholar]
- Bishop AC, et al. A chemical switch for inhibitor-sensitive alleles of any protein kinase. Nature. 2000;407:395–401. doi: 10.1038/35030148. [DOI] [PubMed] [Google Scholar]
- Breitkreutz A, Boucher L, Tyers M. MAPK specificity in the yeast pheromone response independent of transcriptional activation. Curr Biol. 2001;11:1266–1271. doi: 10.1016/s0960-9822(01)00370-0. [DOI] [PubMed] [Google Scholar]
- Brown KS, Hill CC, Calero GA, Myers CR, Lee KH, Sethna JP, Cerione RA. The statistical mechanics of complex signaling networks: nerve growth factor signaling. Phys Biol. 2004;1:184–195. doi: 10.1088/1478-3967/1/3/006. [DOI] [PubMed] [Google Scholar]
- Bruckner S, Kohler T, Braus GH, Heise B, Bolte M, Mosch HU. Differential regulation of Tec1 by Fus3 and Kss1 confers signaling specificity in yeast development. Curr Genet. 2004;46:331–342. doi: 10.1007/s00294-004-0545-1. [DOI] [PubMed] [Google Scholar]
- Chou S, Huang L, Liu H. Fus3-regulated Tec1 degradation through SCF(Cdc4) determines MAPK signaling specificity during mating in yeast. Cell. 2004;119:981–990. doi: 10.1016/j.cell.2004.11.053. [DOI] [PubMed] [Google Scholar]
- Cirit M, Wang CC, Haugh JM. Systematic quantification of negative feedback mechanisms in the extracellular signal-regulated kinase (ERK) signaling network. J Biol Chem. 2010;285:36736–36744. doi: 10.1074/jbc.M110.148759. [DOI] [PMC free article] [PubMed] [Google Scholar]
- Cook JG, Bardwell L, Thorner J. Inhibitory and activating functions for MAPK Kss1 in the S. cerevisiae filamentous-growth signalling pathway. Nature. 1997;390:85–88. doi: 10.1038/36355. [DOI] [PubMed] [Google Scholar]
- Doi K, Gartner A, Ammerer G, Errede B, Shinkawa H, Sugimoto K, Matsumoto K. MSG5, a novel protein phosphatase promotes adaptation to pheromone response in S. cerevisiae. EMBO J. 1994;13:61–70. doi: 10.1002/j.1460-2075.1994.tb06235.x. [DOI] [PMC free article] [PubMed] [Google Scholar]
- Errede B, Gartner A, Zhou Z, Nasmyth K, Ammerer G. MAP kinase-related FUS3 from S. cerevisiae is activated by STE7 in vitro. Nature. 1993;362:261–264. doi: 10.1038/362261a0. [DOI] [PubMed] [Google Scholar]
- Ferrell JEJ, Machleder EM. The biochemical basis of an all-or-none cell fate switch in Xenopus oocytes. Science. 1998;280:895–898. doi: 10.1126/science.280.5365.895. [DOI] [PubMed] [Google Scholar]
- Flatauer LJ, Zadeh SF, Bardwell L. Mitogen-activated protein kinases with distinct requirements for Ste5 scaffolding influence signaling specificity in Saccharomyces cerevisiae. Mol Cell Biol. 2005;25:1793–1803. doi: 10.1128/MCB.25.5.1793-1803.2005. [DOI] [PMC free article] [PubMed] [Google Scholar]
- Fritsche-Guenther R, Witzel F, Sieber A, Herr R, Schmidt N, Braun S, Brummer T, Sers C, Bluthgen N. Strong negative feedback from Erk to Raf confers robustness to MAPK signalling. Mol Syst Biol. 2011;7:489. doi: 10.1038/msb.2011.27. [DOI] [PMC free article] [PubMed] [Google Scholar]
- Gartner A, Nasmyth K, Ammerer G. Signal transduction in Saccharomyces cerevisiae requires tyrosine and threonine phosphorylation of FUS3 and KSS1. Genes Dev. 1992;6:1280–1292. doi: 10.1101/gad.6.7.1280. [DOI] [PubMed] [Google Scholar]
- Good M, Tang G, Singleton J, Remenyi A, Lim WA. The Ste5 scaffold directs mating signaling by catalytically unlocking the Fus3 MAP kinase for activation. Cell. 2009;136:1085–1097. doi: 10.1016/j.cell.2009.01.049. [DOI] [PMC free article] [PubMed] [Google Scholar]
- Hao N, Behar M, Parnell SC, Torres MP, Borchers CH, Elston TC, Dohlman HG. A systems-biology analysis of feedback inhibition in the sho1 osmotic-stress-response pathway. Curr Biol. 2007;17:659–667. doi: 10.1016/j.cub.2007.02.044. [DOI] [PubMed] [Google Scholar]
- Hao N, Nayak S, Behar M, Shanks RH, Nagiec MJ, Errede B, Hasty J, Elston TC, Dohlman HG. Regulation of cell signaling dynamics by the protein kinase-scaffold Ste5. Mol Cell. 2008a;30:649–656. doi: 10.1016/j.molcel.2008.04.016. [DOI] [PMC free article] [PubMed] [Google Scholar]
- Hao N, O'Shea EK. Signal-dependent dynamics of transcription factor translocation controls gene expression. Nat Struct Mol Biol. 2012;19:31–39. doi: 10.1038/nsmb.2192. [DOI] [PMC free article] [PubMed] [Google Scholar]
- Hao N, Yildirim N, Wang Y, Elston TC, Dohlman HG. Regulators of G protein signaling and transient activation of signaling: experimental and computational analysis reveals negative and positive feedback controls on G protein activity. J Biol Chem. 2003;278:46506–46515. doi: 10.1074/jbc.M308432200. [DOI] [PubMed] [Google Scholar]
- Hao N, Zeng Y, Elston TC, Dohlman HG. Control of MAPK specificity by feedback phosphorylation of shared adaptor protein Ste50. J Biol Chem. 2008b;283:33798–33802. doi: 10.1074/jbc.C800179200. [DOI] [PMC free article] [PubMed] [Google Scholar]
- Komarova NL, Zou X, Nie Q, Bardwell L. A theoretical framework for specificity in cell signaling. Mol Syst Biol. 2005;1:2005.0023. doi: 10.1038/msb4100031. [DOI] [PMC free article] [PubMed] [Google Scholar]
- Macia J, Regot S, Peeters T, Conde N, Sole R, Posas F. Dynamic signaling in the Hog1 MAPK pathway relies on high basal signal transduction. Sci Signal. 2009;2:ra13. doi: 10.1126/scisignal.2000056. [DOI] [PubMed] [Google Scholar]
- Madhani HD, Fink GR. Combinatorial control required for the specificity of yeast MAPK signaling. Science. 1997;275:1314–1317. doi: 10.1126/science.275.5304.1314. [DOI] [PubMed] [Google Scholar]
- Maleri S, Ge Q, Hackett EA, Wang Y, Dohlman HG, Errede B. Persistent activation by constitutive Ste7 promotes Kss1-mediated invasive growth but fails to support Fus3-dependent mating in yeast. Mol Cell Biol. 2004;24:9221–9238. doi: 10.1128/MCB.24.20.9221-9238.2004. [DOI] [PMC free article] [PubMed] [Google Scholar]
- Malleshaiah MK, Shahrezaei V, Swain PS, Michnick SW. The scaffold protein Ste5 directly controls a switch-like mating decision in yeast. Nature. 2010;465:101–105. doi: 10.1038/nature08946. [DOI] [PubMed] [Google Scholar]
- Muzzey D, Gomez-Uribe CA, Mettetal JT, van Oudenaarden A. A systems-level analysis of perfect adaptation in yeast osmoregulation. Cell. 2009;138:160–171. doi: 10.1016/j.cell.2009.04.047. [DOI] [PMC free article] [PubMed] [Google Scholar]
- Nagiec MJ, Dohlman HG. Checkpoints in a yeast differentiation pathway coordinate signaling during hyperosmotic stress. PLoS Genet. 2012;8:e1002437. doi: 10.1371/journal.pgen.1002437. [DOI] [PMC free article] [PubMed] [Google Scholar]
- Neiman AM, Herskowitz I. Reconstitution of a yeast protein kinase cascade in vitro: activation of the yeast MEK homologue STE7 by STE11. Proc Natl Acad Sci USA. 1994;91:3398–3402. doi: 10.1073/pnas.91.8.3398. [DOI] [PMC free article] [PubMed] [Google Scholar]
- Purvis JE, Karhohs KW, Mock C, Batchelor E, Loewer A, Lahav G. p53 dynamics control cell fate. Science. 2012;336:1440–1444. doi: 10.1126/science.1218351. [DOI] [PMC free article] [PubMed] [Google Scholar]
- Roberts CJ, et al. Signaling and circuitry of multiple MAPK pathways revealed by a matrix of global gene expression profiles. Science. 2000;287:873–880. doi: 10.1126/science.287.5454.873. [DOI] [PubMed] [Google Scholar]
- Roberts RL, Fink GR. Elements of a single MAP kinase cascade in Saccharomyces cerevisiae mediate two developmental programs in the same cell type: mating and invasive growth. Genes Dev. 1994;8:2974–2985. doi: 10.1101/gad.8.24.2974. [DOI] [PubMed] [Google Scholar]
- Sabbagh W, Jr., Flatauer LJ, Bardwell AJ, Bardwell L. Specificity of MAP kinase signaling in yeast differentiation involves transient versus sustained MAPK activation. Mol Cell. 2001;8:683–691. doi: 10.1016/s1097-2765(01)00322-7. [DOI] [PMC free article] [PubMed] [Google Scholar]
- Saito H. Regulation of cross-talk in yeast MAPK signaling pathways. Curr Opin Microbiol. 2010;13:677–683. doi: 10.1016/j.mib.2010.09.001. [DOI] [PubMed] [Google Scholar]
- Sprinzak D, Lakhanpal A, Lebon L, Santat LA, Fontes ME, Anderson GA, Garcia-Ojalvo J, Elowitz MB. Cis-interactions between Notch and Delta generate mutually exclusive signalling states. Nature. 2010;465:86–90. doi: 10.1038/nature08959. [DOI] [PMC free article] [PubMed] [Google Scholar]
- Sturm OE, Orton R, Grindlay J, Birtwistle M, Vyshemirsky V, Gilbert D, Calder M, Pitt A, Kholodenko B, Kolch W. The mammalian MAPK/ERK pathway exhibits properties of a negative feedback amplifier. Sci Signal. 2010;3:ra90. doi: 10.1126/scisignal.2001212. [DOI] [PubMed] [Google Scholar]
- Tay S, Hughey JJ, Lee TK, Lipniacki T, Quake SR, Covert MW. Single-cell NF-κB dynamics reveal digital activation and analogue information processing. Nature. 2010;466:267–271. doi: 10.1038/nature09145. [DOI] [PMC free article] [PubMed] [Google Scholar]
- Truckses DM, Garrenton LS, Thorner J. Jekyll and Hyde in the microbial world. Science. 2004;306:1509–1511. doi: 10.1126/science.1104677. [DOI] [PubMed] [Google Scholar]
- Wang X, Hao N, Dohlman HG, Elston TC. Bistability, stochasticity, and oscillations in the mitogen-activated protein kinase cascade. Biophys J. 2006;90:1961–1978. doi: 10.1529/biophysj.105.073874. [DOI] [PMC free article] [PubMed] [Google Scholar]
- Wang Y, Abu Irqeba A, Ayalew M, Suntay K. Sumoylation of transcription factor Tec1 regulates signaling of mitogen-activated protein kinase pathways in yeast. PLoS One. 2009;4:e7456. doi: 10.1371/journal.pone.0007456. [DOI] [PMC free article] [PubMed] [Google Scholar]
- Wang Y, Dohlman HG. Pheromone signaling mechanisms in yeast: a prototypical sex machine. Science. 2004;306:1508–1509. doi: 10.1126/science.1104568. [DOI] [PubMed] [Google Scholar]
- Wang Y, Dohlman HG. Pheromone-regulated sumoylation of transcription factors that mediate the invasive to mating developmental switch in yeast. J Biol Chem. 2006;281:1964–1969. doi: 10.1074/jbc.M508985200. [DOI] [PubMed] [Google Scholar]
- Wang Y, Ge Q, Houston D, Thorner J, Errede B, Dohlman HG. Regulation of Ste7 ubiquitination by Ste11 phosphorylation and the Skp1-Cullin-F-box complex. J Biol Chem. 2003;278:22284–22289. doi: 10.1074/jbc.M301272200. [DOI] [PubMed] [Google Scholar]
- Wu R, Dephoure N, Haas W, Huttlin EL, Zhai B, Sowa ME, Gygi SP. Correct interpretation of comprehensive phosphorylation dynamics requires normalization by protein expression changes. Mol Cell Proteomics. 2011;10:M111.009654. doi: 10.1074/mcp.M111.009654. [DOI] [PMC free article] [PubMed] [Google Scholar]
- Yi TM, Kitano H, Simon MI. A quantitative characterization of the yeast heterotrimeric G protein cycle. Proc Natl Acad Sci USA. 2003;100:10764–10769. doi: 10.1073/pnas.1834247100. [DOI] [PMC free article] [PubMed] [Google Scholar]
- Yu RC, Pesce CG, Colman-Lerner A, Lok L, Pincus D, Serra E, Holl M, Benjamin K, Gordon A, Brent R. Negative feedback that improves information transmission in yeast signalling. Nature. 2008;456:755–761. doi: 10.1038/nature07513. [DOI] [PMC free article] [PubMed] [Google Scholar]
- Yu Y, Dong W, Altimus C, Tang X, Griffith J, Morello M, Dudek L, Arnold J, Schuttler HB. A genetic network for the clock of Neurospora crassa. Proc Natl Acad Sci USA. 2007;104:2809–2814. doi: 10.1073/pnas.0611005104. [DOI] [PMC free article] [PubMed] [Google Scholar]
- Zhan XL, Deschenes RJ, Guan KL. Differential regulation of FUS3 MAP kinase by tyrosine-specific phosphatases PTP2/PTP3 and dual-specificity phosphatase MSG5 in Saccharomyces cerevisiae. Genes Dev. 1997;11:1690–1702. doi: 10.1101/gad.11.13.1690. [DOI] [PubMed] [Google Scholar]
- Zhan XL, Guan KL. A specific protein-protein interaction accounts for the in vivo substrate selectivity of Ptp3 towards the Fus3 MAP kinase. Genes Dev. 1999;13:2811–2827. doi: 10.1101/gad.13.21.2811. [DOI] [PMC free article] [PubMed] [Google Scholar]
- Zhou Z, Gartner A, Cade R, Ammerer G, Errede B. Pheromone-induced signal transduction in Saccharomyces cerevisiae requires the sequential function of three protein kinases. Mol Cell Biol. 1993;13:2069–2080. doi: 10.1128/mcb.13.4.2069. [DOI] [PMC free article] [PubMed] [Google Scholar]
Associated Data
This section collects any data citations, data availability statements, or supplementary materials included in this article.