Abstract
Endogenous magnetic resonance contrast based on the localized composition of fat in vivo can provide functional information. We found that the unequal pulse timings of the Uhrig’s Dynamical Decoupling (UDD) multipulse echo sequences significantly alter the signal intensity compared to conventional, equal-spaced Carr-Purcell-Meiboom-Gill (CPMG) sequences. The signal increases and decreases depending on the tissue and sequence parameters, as well as on the interpulse spacings; particularly strong differences were observed in fatty tissues, which have a highly structured morphology and a wide range of chemical shifts and J-couplings. We found that the predominant mechanism for fat refocusing under multipulse echo sequences is the chemical structure, with stimulated echoes playing a pivotal role. As a result, specialized pulse sequences can be designed to optimize refocusing of the fat chemical shifts and J-couplings, where the degree of refocusing can be tailored to specific types of fats. To determine the optimal time delays, we simulated various UDD and CPMG pulse sequence timings, and these results are compared to experimental results obtained on excised and in vivo fatty tissue. Applications to intermolecular multiple-quantum coherence (iMQC) imaging, where the improved echo refocusing translates directly into signal enhancements, are presented as well.
Keywords: multipulse echo sequences, strong coupling Hamiltonian, lipids
Introduction
Endogenous magnetic resonance (MR) contrast based on the localized composition of fat in vivo can provide functional information. For example, by isolating the polyunsaturated lipid signal with a selective conventional multiple quantum coherence (MQC) transfer technique, an absence of polyunsaturated fats was observed to correlate with invasive ductal carcinoma in the breast, whereas healthy breast tissue showed a continuous distribution of fats (1). Using intermolecular multiple quantum coherences (iMQCs), fat can be used to image absolute temperature in vivo (2,3) and detect brown adipose tissue (an important goal for obesity research) (4,5). However, the spectrum of fat has at least ten distinct resonances and many J-couplings (6–9), in many cases between spins with very similar resonance frequencies. Even at high fields, the dynamics in a spin echo sequence can be complex, as these frequencies can constructively and destructively interfere for different evolution times. As a result, some sequence delays are inherently better than others. Here, we show that specialized multi-pulse echo sequences can be designed to optimize refocusing of the chemical shifts and J-couplings in fat, where the degree of refocusing can be tailored for specific delays and echo times.
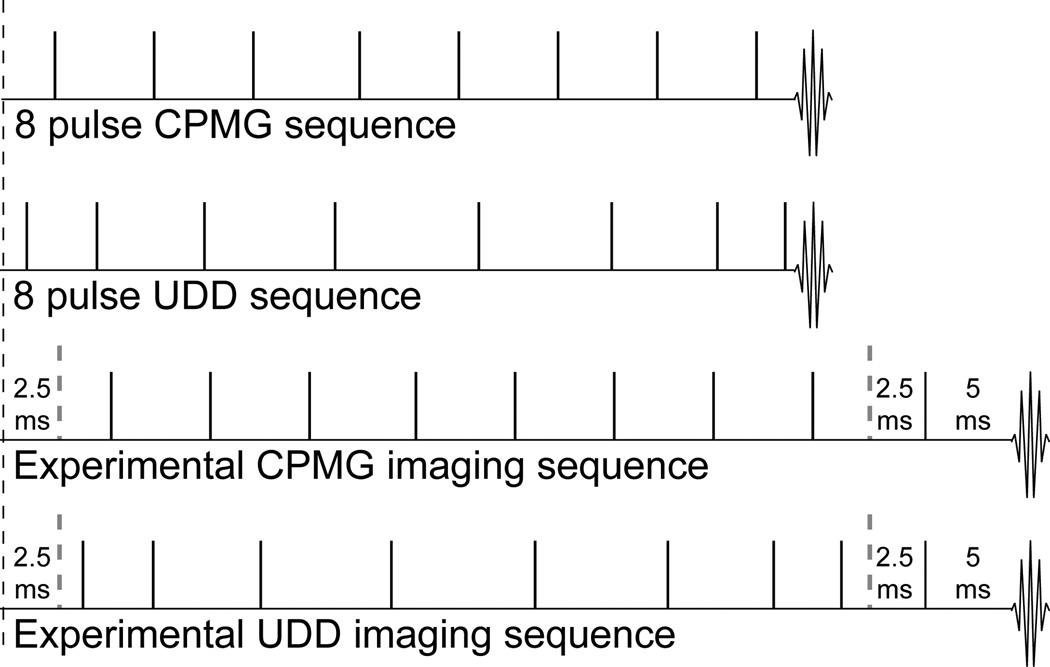
Carr-Purcell-Meiboom-Gill (CPMG) (10,11) multi-pulse echo sequences are well known to provide improved refocusing in tissue compared to standard spin echo sequences (12). The CPMG sequence uses equal interpulse delays, and it is easy to show that for diffusion in a constant gradient, this configuration gives the best signal for a fixed overall sequence length. However, we recently showed that, surprisingly, the equal pulse spacing of the CPMG sequence is not generally optimum for refocusing frequency fluctuations such as those found in vivo (13). For example, Figure 1 shows a non-intuitive unequal spacing called the Uhrig Dynamic Decoupling or UDD sequence (14). This sequence was initially proposed to reduce decoherence in an application unrelated to magnetic resonance, but it was later shown to be more general (15–18). For the UDD sequence, the jth pulse in an n-pulse sequence is located at a time given by . This unique timing led to significant increases in signal in many types of tissue (13). However, these improvements depend on the tissue and sequence parameters, as well as on the interpulse spacings; particularly strong enhancements were observed in fatty tissues, which have a highly structured morphology and a wide range of chemical shifts and J-couplings.
Figure 1.
8 pulse CPMG (top) and UDD (upper middle) sequences. All pulses shown are π pulses, while the location of the π/2 excitation pulse in each sequence is indicated by the black dotted line. The CPMG sequence has equally spaced pulses, while the UDD sequence has shorter delays at the beginning and end and longer delays in the middle. The lower middle and bottom sequences show the timing for the experimental imaging sequences, where a spin echo sequence (TE = 10 ms) is added after the CPMG and UDD sequences to provide slice selection.
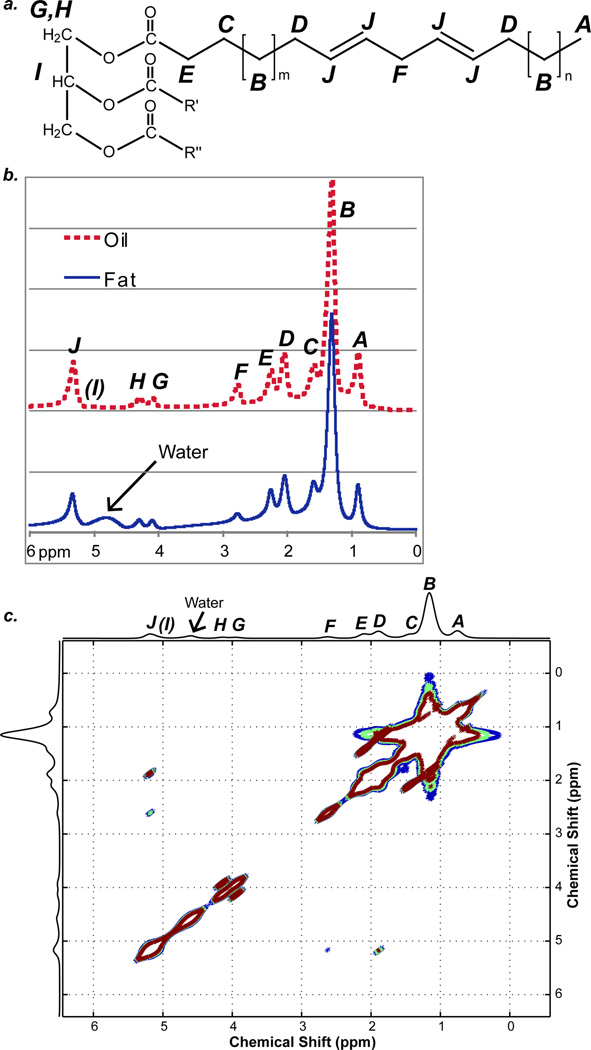
Human adipose tissue is composed mostly of triglycerides (19–22). Three fatty acids (oleic, palmitic, and linoleic) account for 77–89% of the fatty acids in vivo (6–9,19–22). The chemical structure of a typical fat molecule is shown in Figure 2a. The typical fat molecule has 10 resolvable proton resonances (6–9), shown in Figure 2b. Table 1 uses the conventional labeling scheme from A to J in alphabetical order starting from upfield to downfield. While not generally resolvable in vivo, this molecule also has J-couplings between adjacent spins. From the COSY spectrum in Figure 2c, there is J-coupling between resonances A and B; B and C; B and D; C and E; D and J; F and J; and G and H, which provides good agreement with the molecule shown in Figure 2a. These J-couplings are shown in Table 1, where the values were estimated using the incremental method in ChemBioDraw Ultra Version 12.0 (Cambridge Soft Corporation, Cambridge, MA) and provides good agreement with high resolution spectra of similar molecules (23,24). The three most common fatty acids can be differentiated by four resonances (B, D, F, and J) according to the number of saturated and unsaturated carbons. Fat and vegetable oil have nearly identical chemical structures and spectra (Figure 2a); however, fat has a complex microstructure, which oil lacks. By considering both fat and oil, the effects of chemical structure and tissue structure can be separated, allowing us to determine the predominant mechanisms for refocusing.
Figure 2.
a: The chemical structure of a typical fat molecule. b: 1H NMR spectra of excised mouse fat (bottom trace) and vegetable oil (upper trace). Nine resonances can be resolved (A – J, excluding I, as labeled in Figure 2a), and water signal is present in the mouse fat spectrum. c: COSY spectrum of excised mouse fat. J-couplings are present between spins A and B; B and C; B and D; C and E; D and J; F and J; G and H; G and I; and H and I.
Table 1.
Chemical shifts, intensity weighting factors, and J-coupling values of protons in typical fat molecule (shown in Figure 2a).
| Resonance | Functional Group | Chemical Shift (ppm)a |
Weighting Factor |
J-coupling (Hz)a |
|---|---|---|---|---|
| A | CH3 methyl protons | 0.90 | 9 | AB: 8.0 |
| B | CH2 methylene protons | 1.29 | 60 | BC: 7.1; BD = 7.1 |
| C | CH2 methylene protons | 1.64 | 6 | CE = 7.1 |
| D | CH2 allylic protons | 2.18 | 12 | DJ = 6.2 |
| E | CH2 methylene protons | 2.32 | 6 | -- |
| F | CH2 diallylic (bis- allylic) protons |
2.63 | 6 | FJ = −1.0 |
| G | CH2 glycerol backbone protons |
4.20 | 2 | GH = −12.4; GI = 7.0 |
| H | CH2 glycerol backbone protons |
4.45 | 2 | HI = 7.0 |
| I | CH glycerol backbone protons |
5.15 | 1 | -- |
| J | CH olefinic protons | 5.45 | 12 | -- |
In vivo applications typically involve many different components of varying spin complexity, from simple spin systems such as water to more complicated spin systems such as fat or metabolites. In the case of a single spin system (or a non-coupled multi-spin system), differences between multipulse echo sequences may be observed due to stimulated echoes and different spectral density profiles. More specifically, the CPMG sequence would have increased signal under stimulated echoes due to constructive interference patterns at the peak of the echo, while the UDD sequence provides improved refocusing compared to the CPMG sequence for low frequency fluctuations arising from diffusion or susceptibility (13). On the other hand, coupled multi-spin systems also exhibit echo modulations as a result of the J-couplings under multipulse echo sequences (25,26). In fast spin echo imaging, the fat voxels appear bright (26–31), known as the bright fat phenomenon, which was initially thought to be the result of increases in T2 due to decreased J-coupling modulation of echo amplitudes. Other possible mechanisms for increased T2 are diffusion and exchange effects, as well as stimulated echoes. These mechanisms have been investigated in detail by several groups (29,31–35), and stimulated echoes and chemical exchange were found to contribute negligibly (32). Henkelman et al. (29) found that diffusion may play a role in the bright fat signal, but the general consensus has been that the J-couplings play a significant role in refocusing.
The Hamiltonian for a coupled n-spin system in the rotating frame is given by
where Ωi is the chemical shift of spin i, and Jij is the scalar coupling constant between spins i and j. The z component of the J-coupling term commutes with the chemical shift term; the x and y components of the J-coupling term, which permit mutual spin-spin flip-flops, do not commute with the difference between the chemical shifts of spin i and j. Thus, the x and y components are appropriately truncated (leaving only 2πJ12I1zI2z as the two-spin J-coupling term) for long time evolution in the weak coupling limit (i.e., when the chemical shift difference is much larger than the J-coupling constant). Because the phase evolution caused by the J-coupling is not reversed by π pulses, the signal is cosinusoidally modulated with zero values at echo times (TEs) of (2n+1)/2J, n = 0, 1, 2, … (27). In the spectrum, the peaks will oscillate between anti-phase for these TEs and in phase for TEs of (2n+1)/(J), n = 0, 1, 2, …. In principle, appropriate choice of the echo time can accurately refocus the J-coupling and produce in-phase magnetization. Unfortunately, for more complex spectra, there is no single value for TE that can accurately refocus all J-couplings.
On the other hand, when the spin system does not satisfy the weak coupling limit, or when a series of RF pulses is applied rapidly (such that |(Ωi − Ωj)τ|≪ 1, where τ is the interpulse interval), the full J-coupling term 2πJ12I1 · I2 must be considered (25,31,36). A fast series of π pulses yields the following average Hamiltonian:
This strong coupling Hamiltonian is also called the isotropic mixing Hamiltonian and is responsible for the coherence transfer in total correlation spectroscopy (TOCSY) (37) and in homonuclear Hartmann-Hahn (HOHAHA) spectroscopy (38). Under this Hamiltonian, the individual spin operator Ix1 can evolve to create the converse spin operator Ix2 (and vice versa); however, these operators do not evolve independently (as is the case for weak coupling) but rather evolve as collective spin modes (31,37). In fact, because this Hamiltonian commutes with the total Ix or Iy, the total magnetization does not evolve under the strong coupling Hamiltonian, and the coupling between spins is effectively removed. Thus, for sufficiently short τ between π refocusing pulses, the J-coupling modulation that is characteristic of single-echo acquisitions will be suppressed. As a result, both fat and water are refocused for short echo times; experimentally, this causes the fat to appear bright in FSE images. However, for longer echo times, fat is poorly refocused.
Although stimulated echoes do not affect the T2 contrast in FSE images, studies have found that the stimulated echoes do comprise a significant amount (up to 10%) of the overall signal (32,39). Whenever a series of π pulses (n > 3) is applied, stimulated echoes caused by pulse flip angle errors must be considered (32,40–42). Signal contributions from spurious pathways are highly probable in the CPMG and UDD sequences (which undoubtedly improves the CPMG signal for a single spin due to constructive interference patterns at the center of the echo). Although stimulated echoes can be used to increase the overall signal (43,44), refocusing away from the expected echo position inherently generates image distortion. Thus, many methods have been proposed to suppress stimulated echoes (40,41,45–47), and crusher gradients are the most effective of these methods. However, the situation becomes increasingly complicated for a J-coupled multi-spin system, and regimes may exist where the combined effects of stimulated echoes and J-coupling produce a null at the peak of the CPMG echo, while increasing the UDD signal.
In some cases, this enhanced fat signal is undesirable, and several methods have been proposed to obtain FSE image contrast that matches that of traditional SE methods (26,27,48–51). On the other hand, iMQC experiments such as temperature imaging (2,3) and brown fat detection (4,5) rely on the growth of signals with a fat component and are thus improved by better refocusing. In general, multi-pulse echo sequences have the potential to significantly improve the signal in multiple quantum sequences. More specifically, the pulse spacings can be modified to optimize refocusing of the chemical shifts and J-couplings in fat, where the degree of refocusing can be tailored to specific types of fats. To determine the optimal time delays, computer simulations of a fat-like molecule will be used to explore the UDD and CPMG timings (by changing the echo time or number of π pulses) for a 10-spin system, including effects of stimulated echoes due to imperfect π pulses. These results will be compared to localized spectroscopy and imaging of excised fatty tissue.
Methods
Simulations
All simulation work was performed using Matlab software (Mathworks, Inc.). The density matrix evolution ρ̂(t) (36) in systems involving 10 spins were simulated under the effects of various sequences, including the conventional spin echo (SE), double spin echo (DSE), CPMG and UDD with 4, 8 and 16 pulses. The input parameters for the simulation program were the number of spins (N), the proton chemical shifts and respective J-couplings, the sequence type and number of pulses, and the echo time. The magnetic field strength was 7.05 T for all simulations unless otherwise noted. The chemical shifts and J-couplings were used to create the Hamiltonian operator, which is a 2N × 2N matrix. All calculations were performed in the Hamiltonian eigenbasis, which was converted to the Zeeman basis to detect the final signal 〈Îx(t) − iÎy(t)〉 = Tr[ρ̂(t)(Îx − iÎy)]. Only the signal from the final echo was acquired for all simulations. For these simulations, T2 relaxation was ignored. Moreover, all pulses were assumed to be instantaneous and produce exact 90° and 180° rotations. Simulations were also performed for the UDD and CPMG sequences with 170° and 175° pulses, which were averaged over a Gaussian resonance offset (FWHM = 1600 Hz), to determine the effects of stimulated echoes due to flip angle errors. In these simulations, 41 time points from immediately after the final 180 pulse to two times the final delay were acquired. The effects of crusher gradients were not considered in the simulations of stimulated echoes.
Simulations were performed on 1-pentene (CH3CH2CH2CH=CH2) (10-spin system), which was chosen as a model for the lipid hydrocarbon chains, as previously shown by Stables et al. (26). The chemical shifts and J-couplings were estimated using the incremental method in ChemBioDraw Ultra Version 12.0 (CambridgeSoft Corporation, Cambridge, MA) and provided good agreement with previous results (26) and high resolution spectra of similar molecules (23,24). For these simulations, the absolute signal at the peak of the echo was determined for each sequence and TE, and the signal was normalized to the signal immediately after a 90° pulse.
For the simulations of a fat-like molecule, each resonance frequency (A through J) in the fat spectrum was used once for the chemical shifts inputs (for a total of 10 spins), while the J-couplings were estimated from comparisons of literature values (6,9,52,53), experimental 1D and 2D spectra, and spectral simulations using the incremental method in ChemBioDraw Ultra Version 12.0 (CambridgeSoft Corporation, Cambridge, MA) (Table 1). The final signal had significant splitting due to J-couplings, and line broadening was used to produce spectra that matched the experimental results. Finally, to obtain the correct intensities, each frequency was multiplied by the number of spins corresponding to that resonance in a typical fat molecule (see Table 1 for weighting factors).
Samples
All animal studies were performed in accordance with National Institutes of Health (NIH) Institutional Animal Care and Use Committee protocols as approved by Duke University. The obese mice were obtained from Jackson Laboratories (Bar Harbor, ME). Human breast tissue was obtained from anonymous healthy female patients undergoing breast reduction surgery. Institutional Review Board exemption was obtained for the use of human tissue.
Scan Parameters
DSE (double spin echo), CPMG, and UDD sequences were used. For in vivo mouse imaging, the mouse was placed in a supine position, and axial slices through the abdomen or tumor were selected. For the human breast tissue, approximately 100 g of tissue was placed in a 50 mL centrifuge tube, which was used for the imaging. All MRI data was acquired on a Bruker 7.05 T (1H: 300.5 MHz). Only the final echo was acquired for each pulse sequence, allowing fair comparisons between sequences of the same TE. Pulse positions for each sequence were calculated according to the aforementioned equations and are shown in Figure 1. For the images, a 2 mm axial slice was selected with a 40 mm × 40 mm FOV and 128 × 128 matrix size. Images were acquired with a TR of 1.5 s and 8 averages unless otherwise indicated. A 1 ms Hermite 90° pulse was used for excitation, and 1 ms hyperbolic secant (sech) 180° pulses were used for refocusing. Adiabatic pulses (such as sech) have significantly better RF homogeneity than conventional pulses but must be applied in identical pairs to compensate for the induced non-linear phase of the transverse magnetization, where the phase reversal depends only on the formation of an echo and not on the individual delays (54–56). Slice selection was achieved with an extra 2 ms Hermite 180 pulse after the sequence (as discussed below). To reduce the effects of stimulated echoes, all 180 pulses were flanked by crusher gradients in different directions.
All images were processed using ImageJ (NIH, Bethesda, MD) and Matlab software (Mathworks, Inc.).
Results
Simulation Results
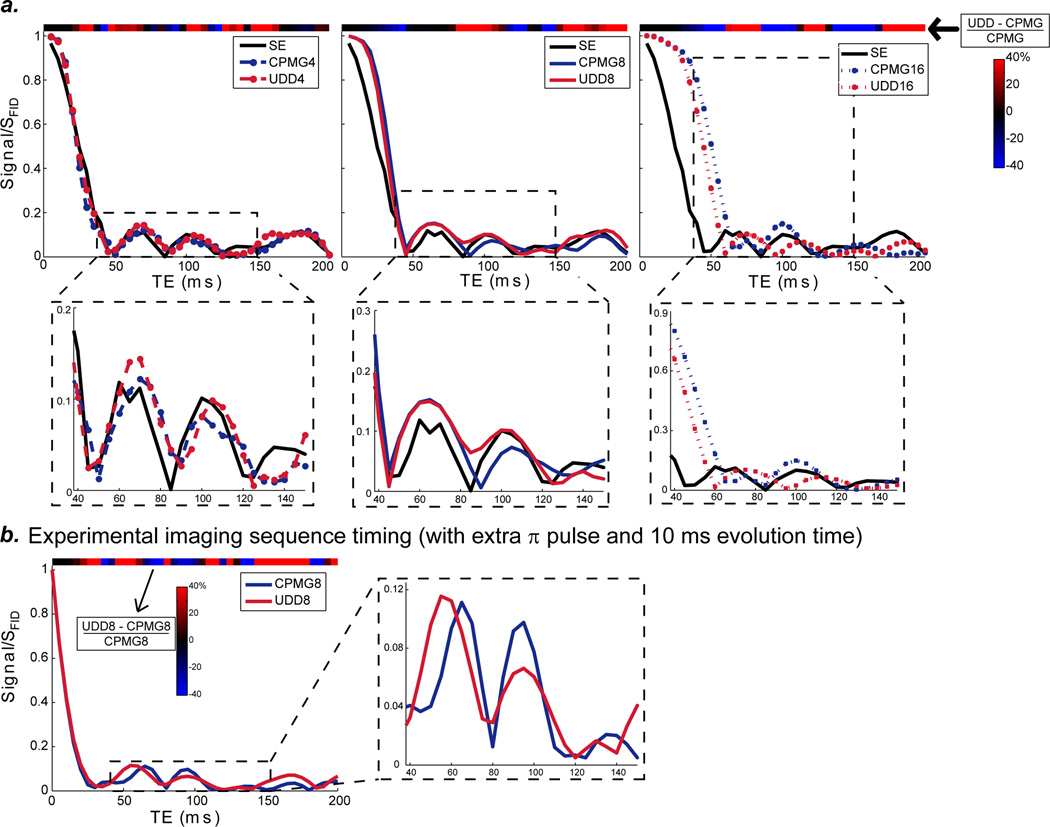
Figure 3a shows the CPMG and UDD magnitude signals (relative to the FID signal) for 1-pentene for a range of echo times. CPMG is shown in blue; and UDD is shown in red; simulations with 4, 8 and 16 pulses are shown on the left, middle, and right, respectively. The insets (below) show the typical experimental regime with echo times from 40 to 150 ms. As the number of pulses increases for each echo time, the interpulse spacing decreases. While the differences between CPMG and UDD seem small, the colorbar at the top of each graph showing the subtraction (UDD – CPMG)/CPMG (%) shows significant differences between CPMG and UDD for the range of echo times. The optimal sequence timing (UDD or CPMG) depends strongly on the echo time and reflects differences in the chemical shift and J-coupling refocusing.
Figure 3.
a: Simulated echo signal for 1-pentene under spin echo (SE) and CPMG and UDD sequences with 4, 8 and 16 pulses, normalized to the FID signal. The inset regions (bottom) show the typical experimental TE regime, from 40 ms to 150 ms. J-couplings cause the signal to drop quickly (to ~10% after 45 ms), with subsequent signal oscillations. The colorbar shown across the top of each graph shows the subtraction (UDD-CPMG)/CPMG and indicates the TEs where UDD is better and where CPMG is better. The optimal signal depends on the echo time and number of pulses and is due to the complicated chemical structure of J-couplings. b: Simulated echo signal for 1-pentene under CPMG8 and UDD8 sequences using the timing of the experimental imaging sequence. The CPMG and UDD timings are calculated using the given TE (such that the echo spacing remains the same), but there is an extra π pulse after the final 180 to provide slice selection and an extra 10 ms of evolution time (2.5 ms before CPMG or UDD; 2.5 ms after CPMG or UDD; and 5 ms after the slice selective pulse). The inset region (right) shows the typical experimental TE regime, from 40 ms to 150 ms, and the colorbar indicates (UDD-CPMG)/CPMG.
Experimentally (where the minimum echo time depends on pulse lengths, crusher gradients, and acquisition time), we have proposed a modification to the UDD and CPMG sequences that permits significantly shorter echo times: the placement of an extra echo pulse after the CPMG or UDD module to permit both slice selection and significantly shorter echo times (5 ms of evolution time was added before and after the pulse as well). Using this modified sequence, minimum echo times for the UDD sequence were 15 ms for 4 pulses, 35 ms for 8 pulses, and 145 ms for 16 pulses. Simulations of 1-pentene under this pulse sequence for UDD8 and CPMG8 (Figure 3b) show that the signal drops off quickly, while the optimal sequence timing again depends strongly on the total echo time (and thus interpulse spacing).
Even for a single spin, contributions from spurious pathways are highly probable in the CPMG and UDD sequences (which, without special care, manifest experimentally as banding artifacts in the UDD images). As a result of the unequal pulse spacings of the UDD sequence, its stimulated echoes refocus both before and after the primary echo. These extra echoes generally interfere with the primary echo in image space, producing bands of constructive and destructive interference in the resulting image. On the other hand, in the CPMG sequence, they are refocused concurrently with the primary echo and lead to images with enhanced intensity.
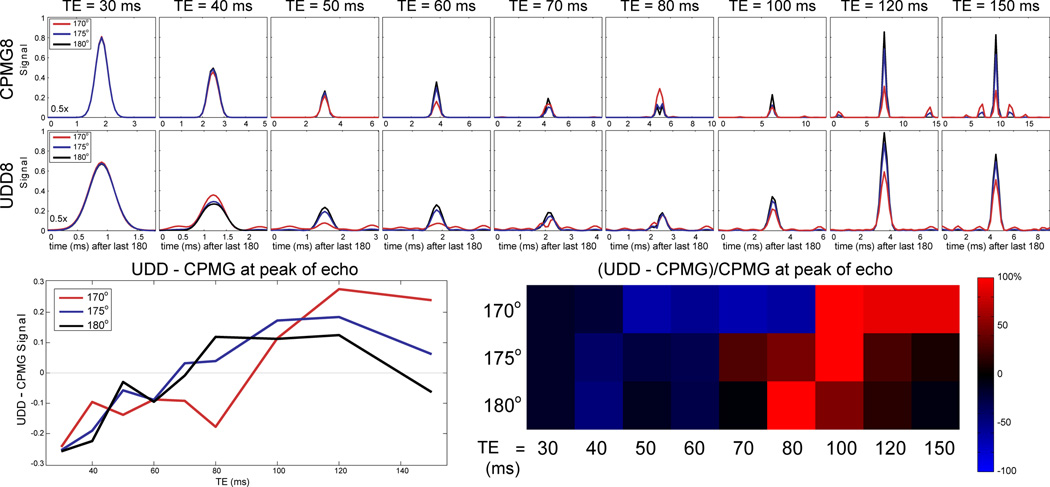
While the CPMG signal for a single-spin system will be increased due to stimulated echoes, the behavior is less certain when there are multiple spins and J-couplings. In these cases, stimulated echoes and J-coupling may combine to decrease the signal at the peak of the CPMG echo but to increase the UDD signal (although the opposite may also be true). The simulated signal for 1-pentene using CPMG8 and UDD8 sequences with pulse flip angles of 180° (perfect), 175°, and 170° for a range of echo times are shown in Figure 4. The UDD echo appears earlier after the final pulse as a result of the shorter last delay compared to the CPMG sequence, and the different CPMG and UDD timescales should be noted (in other words, both the CPMG and UDD echoes are equally sharp). For perfect 180° pulses, the UDD8 signal is only higher than the CPMG8 signal for echo times between 80 and 120. However, for imperfect pulse flip angles (175° and 170°), the optimal sequence echo times shift, and the signal vs. time behavior for CPMG8 and UDD8 are complicated by both the stimulated echo and J-coupling modulation effects.
Figure 4.
Simulated echo signals for 1-pentene with 180° (perfect; black) pulses, 175° pulses (blue), and 170° pulses (red). RF inhomogeneity causes stimulated echoes, which alter the echo signal differently for CPMG and UDD. The different x-axis timescales for CPMG and UDD should be noted, which results from the shorter final UDD delay. The subtraction UDD – CPMG for the signal amplitude at the peak of the echo (bottom left) shows that the shorter TEs tend to favor the CPMG sequence, while the UDD sequence is favored at the longer TEs. This is also reflected in the image, normalized to the CPMG signal (bottom right). Even minor (<10%) RF inhomogeneity leads to significant changes in the optimal sequence for a given TE.
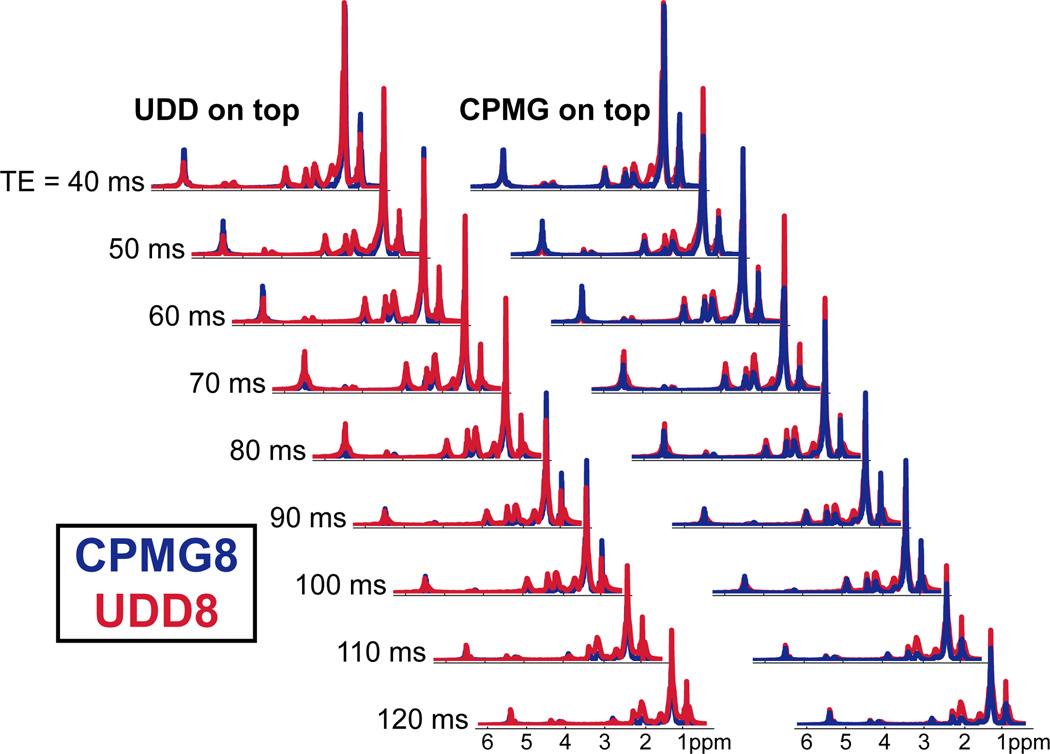
Simulations of a typical fat molecule were also performed by simplifying the fat molecule (shown in Figure 2a) to a single proton for each individual chemical shift (for 10 simulated spins) and then post-multiplying the final signal by the number of protons (approximately 130 actual spins) corresponding to each chemical shift. The simulated spectra of a fat molecule under the CPMG8 (in blue) and UDD8 (in red) sequences for a range of echo times are shown in Figure 5. These spectra show that the shortest echo times do not always have the highest signal intensity (T2 relaxation has been ignored), and that the signal intensities oscillate with echo time. Moreover, the optimal signal for each resonance depends on the pulse sequence and total echo time, both of which relate to the interpulse spacings. Additionally, no single sequence type or echo time provides the optimal signal for all resonances.
Figure 5.
Simulated CPMG8 and UDD8 spectra of a fat-like molecule for a range of echo times. On both the right and left, UDD8 is shown in red and CPMG8 is shown in blue. The left waterfall shows UDD plotted on top of CPMG and shows TEs and resonances where CPMG is better; the right waterfall shows CPMG plotted on top of UDD and shows TEs and resonances where UDD is better.
Experimental Results
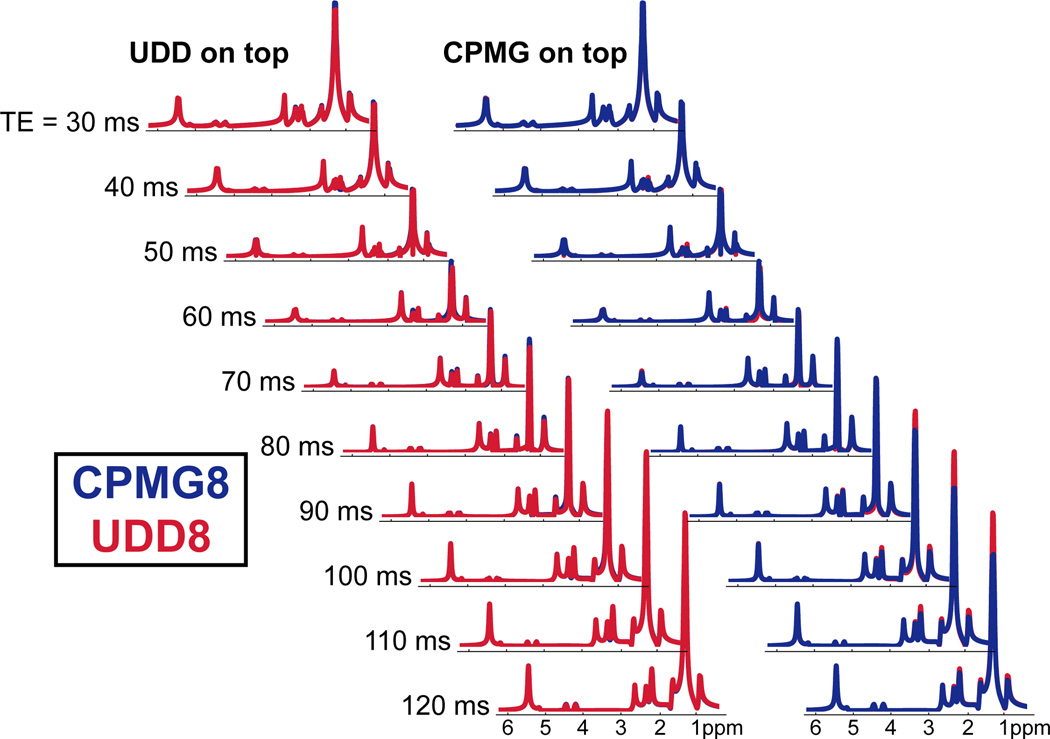
The simulations show that the refocusing of fat depends strongly on the sequence type and total echo time (and thus on the interpulse delays). Spectroscopy can be used to determine which resonances are optimally refocused for a given sequence and TE. Using a tube of vegetable oil as a simplified fat system, Figure 6 shows the spectroscopy results from a voxel-selective modified PRESS sequence (eight selective pulses – three on the read direction, three on the phase direction, and two on the slice direction) with the CPMG (blue) and UDD (red) timings. The left side of the figure shows the resonances that the CPMG sequence refocuses better than the UDD sequence, while the right side shows resonances that the UDD sequence refocuses better than the CPMG sequence for a range of echo times from 40 ms to 120 ms. For the A methyl peak, the CPMG and UDD sequences provide approximately equal refocusing for TEs 60 and 80 ms; CPMG is better than UDD for TEs 40, 90, and 100 ms; and UDD is better than CPMG for TEs 50, 70, 110, and 120 ms. For the B methylene peak, the CPMG and UDD sequences provide approximately equal refocusing for TEs 40 and 60 ms; CPMG is better than UDD for TEs 60, 90, and 100 ms; and UDD is better than CPMG for TEs 50, 70, 80, 110, and 120 ms. For the C methylene, D allylic, and E methylene peaks, the UDD sequence provides more refocusing than the CPMG sequence for all TEs shown. For the F diallylic peaks, the UDD sequence provides more refocusing than the CPMG sequence for the TEs less than 90 ms, while CPMG provides more signal for the longer TEs. The G and H peaks correspond to the glycerol backbone protons (along with the I proton, which was not observed here) and had too little signal intensity to easily discern the optimal sequence. The J olefinic peaks had approximately equal refocusing for the CPMG and UDD sequences for TEs 90, 100, 110, and 120 ms; CPMG provides better refocusing than UDD for TEs 40, 50, and 60 ms; and UDD is better than CPMG for TEs 70 and 80 ms. Improved refocusing of the individual resonances will be advantageous for iMQC imaging applications.
Figure 6.
CPMG8 and UDD8 localized spectroscopy of a tube of vegetable oil for a range of echo times. UDD8 is shown in red and CPMG8 is shown in blue. The left waterfall shows UDD plotted on top of CPMG and shows TEs and resonances where CPMG is better; the right waterfall shows CPMG plotted on top of UDD and shows TEs and resonances where UDD is better.
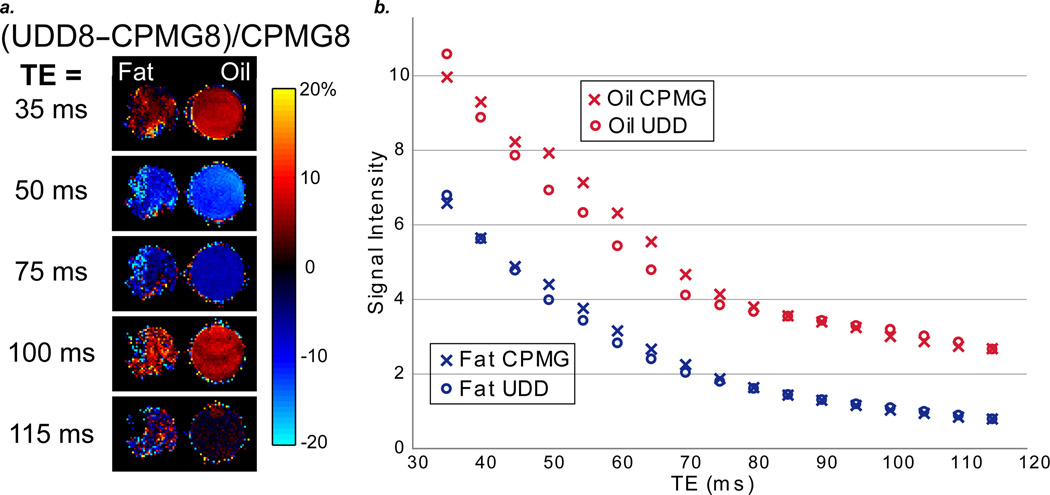
The strong signal dependence on the sequence type and total echo time, both in the simulations and spectroscopy, illustrate the importance of the wide range of chemical shifts and J-couplings (6) (Figure 2b); however, one can consider other mechanisms that could affect the signal refocusing, such as highly structured tissue morphology of fat leading to diffusion and exchange effects. To separate the chemical and tissue structure effects, we compared the CPMG and UDD images for oil and fat to elucidate the predominant mechanism for refocusing. Fat and oil have similar spectral characteristics, but oil lacks fat tissue microstructure. More specifically, similar signal characteristics for oil and fat would indicate that the chemical shifts and J-couplings are the predominant mechanism for signal refocusing, while different signal characteristics would indicate that the microstructure is the predominant mechanism. Moreover, this would allow us to determine whether vegetable oil is a fair test system for fat. Figure 7A compares the UDD and CPMG images for oil and fat and shows that the optimal sequence depends little on the microstructure, whereas the chemical shifts and J-couplings likely play a large role. This can also be seen in Figure 7B for a wider range of echo times. The refocusing of fat depends strongly on the echo time and thus on the interpulse delays, which results predominantly from chemical structure effects (with some contribution from tissue microstructure). Additionally, the similar characteristics show that vegetable oil can be used as a test system for fat. Careful timing of the interpulse delays should provide a mechanism to refocus more of these chemical shifts and J-couplings and thereby increase the signal.
Figure 7.
a: Normalized subtraction images [(UDD8 – CPMG8)/CPMG8] for excised mouse fat and vegetable oil for several echo times. The oil and fat images have similar signal characteristics, which are due to chemical structure effects (as opposed to microstructure). b: Comparison of CPMG8 and UDD8 signal intensities for excised mouse fat and vegetable oil for a range of echo times (35 ms to 115 ms).
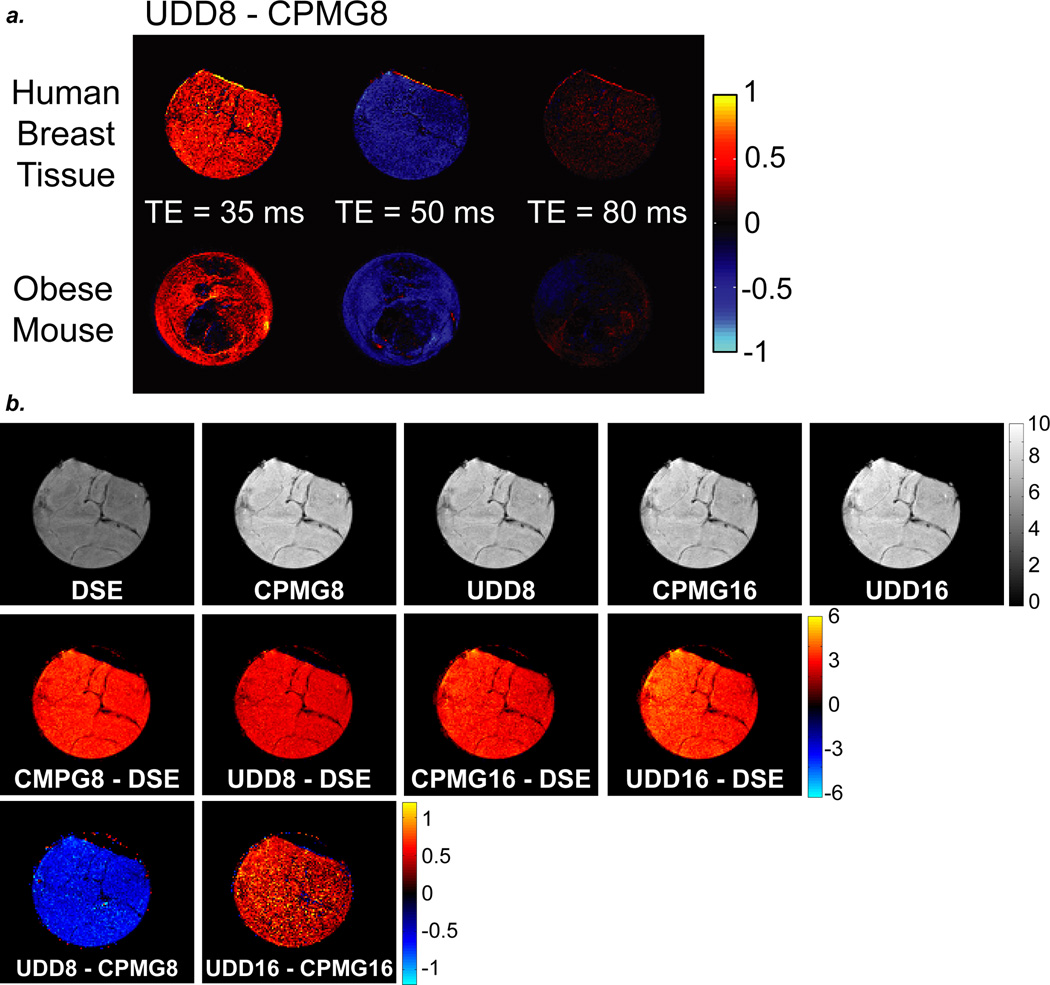
Figure 8 shows the imaging results for CPMG8 and UDD8 in excised human breast tissue (top) and a post-mortem obese mouse (bottom) for several echo times. These images show that the optimal echo time for fat is different for CPMG8 and UDD8, where UDD8 outperforms CPMG8 at the shorter echo time (35 ms) and CPMG8 outperforms UDD8 at the intermediate echo time (50 ms), with about equal signals for UDD8 and CPMG8 at the longer echo time (80 ms). Moreover, the optimal signal depends on the pulse sequence and total echo time, indicating the importance of the interpulse spacings on the refocusing of the chemical shifts and J-couplings.
Figure 8.
a: Subtractions images for UDD8 – CPMG8 of excised human breast tissue (top) and obese mouse fat (bottom) for three TEs. b: Double spin echo (DSE), CPMG8, UDD8, CPMG16, and UDD16 images of excised human breast fat at TE = 120 ms. All CPMG and UDD sequences are better than the DSE sequence at this TE. However, CPMG8 is better than UDD8, while UDD16 is better than CPMG16 for refocusing the fat signal.
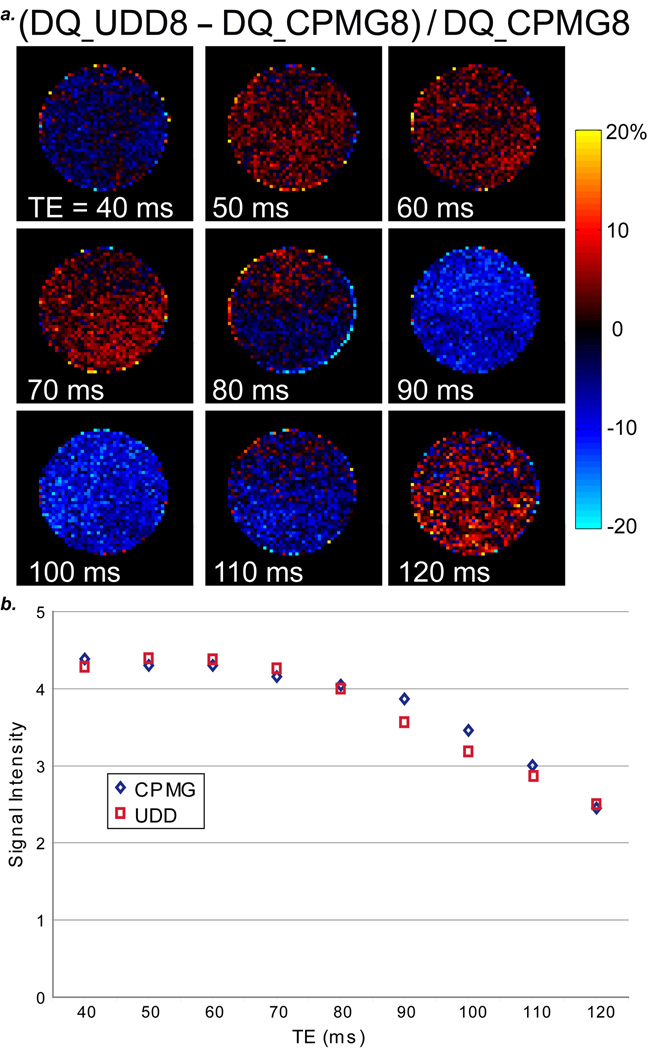
One goal in optimizing the pulse sequence and echo time for fat refocusing is to apply these results to iMQC imaging of fat. Using the UDD8 and CPMG8 sequences following the iDQC-CRAZED (57–61) sequence on a tube of oil (which can be used as a simple model for fat chemical structure refocusing), we can determine the optimal sequence and echo time. More specifically, Figure 9 shows the oil tube subtraction images for (iDQC_UDD8 – iDQC_CPMG8)/iDQC_CPMG8 for a range of TEs from 40 ms to 120 ms. Similar to the simulations and conventional imaging results, the optimal signal refocusing depends on the echo time and sequence. Here, the CPMG and UDD sequences provide approximately equal refocusing for TE = 80 ms; CPMG is better than UDD at TEs 40, 90, 100, and 110 ms, and UDD is better than CPMG at TEs 50, 60, 70, and 120 ms. The combination of simulations, spectroscopy and imaging permits the optimization of refocusing for fat under various pulse sequences and echo times; moreover, the optimal refocusing of fat will aid in iMQC imaging applications.
Figure 9.
a: Normalized subtraction images [(DQ_UDD8 – DQ_CPMG8)/DQ_CPMG8] for a tube of vegetable oil for a range of echo times. Similar to the conventional images, the optimal signal for iDQC followed by UDD8 or CPMG8 shows a strong dependence on the echo time. b: Comparison of DQ_CPMG8 and DQ_UDD8 signal intensities for a tube of vegetable oil for a range of echo times (40 ms to 150 ms).
Discussion
The simulation results show that the signal intensity resulting from the CPMG and UDD sequences depends strongly on the echo time and thus interpulse delays, which reflects differences in the refocusing of J-couplings. Using simulations of 1-pentene, the important parameters for refocusing are the chemical shift difference and J-coupling constant, as well as the sequence and total echo time (both of which determine the interpulse spacings). With the strong J-coupling of 1-pentene (and thus fat), the initial signal intensity decreases quickly, with oscillations and periodic signal recurrences. As shown previously (25,26), as the chemical shift difference decreases, the J-coupling becomes less effective at dephasing the lipid signal. Thus, at lower magnetic fields (corresponding to smaller chemical shift difference frequencies), the dephasing ability of the J-coupling is significantly reduced (although the J-coupling constants result from the molecular magnetic properties and thus do not depend on the external magnetic field). Simulations of the pulse sequence used for the UDD8 and CPMG8 imaging experiments show that the signal drops off quickly, while the optimal echo time depends strongly on the total echo time (and thus interpulse spacing). Moreover, stimulated echoes resulting from imperfect refocusing pulses complicate the signal behavior for the different sequences. Even for relatively small pulse flip angle errors, the signal changes dramatically (most notably for CPMG8 at TE = 150 ms and UDD8 at TE = 60 ms). The optimal sequence timing (UDD or CPMG) depends strongly on the chemical shift differences, echo times, and J-couplings, indicating the lack of a global optimum for refocusing.
Using a tube of vegetable oil as a model system for fat, spectroscopy was used to determine which resonances are optimally refocused for a given sequence and TE. The refocusing of each peak was found to depend strongly on the TE and sequence; in other words, neither sequence can optimally refocus all resonances at all TEs. While the simulations show the importance of the wide range of chemical shifts and J-couplings, other mechanisms should also be considered, including the highly structured tissue morphology of fat leading to diffusion and exchange effects. Comparisons of CPMG and UDD images for oil and fat revealed that the refocusing of both samples predominantly results from chemical structure effects (with some contribution from tissue microstructure). Images were acquired using the CPMG8 and UDD8 sequences for a range of echo times in a post-mortem obese mouse and excised human breast tissue. In both fat samples, the optimal signal depended on the pulse sequence and total echo time, indicating the importance of the interpulse spacings on the refocusing of the chemical shifts and J-couplings. Similarly, iMQC images of vegetable oil were acquired and show significant differences in refocusing between the CPMG and UDD sequences (applied after the iDQC sequence) for different echo times. The addition of these multipulse echo sequences after the iDQC sequence provides time for the signals to grow in. The combination of simulations, spectroscopy and imaging permits the optimization of refocusing for fat under various pulse sequences and echo times; moreover, the optimal refocusing of fat will aid in iMQC imaging applications.
There are some limitations of this study. Although the simulated and experimental results are qualitatively similar, they are quantitatively different and can only show which mechanisms and parameters will affect the signal. Most of the simulations (with the exception of Figure 3b) lacked an extra π pulse and 10 ms delay present in the imaging sequences, and this could be a major source of discordance between the simulated and experimental results. While 1-pentene can provide some insight into the behavior of fat spins under multipulse echo sequences, it can only model the spin topology for the last few protons in the lipid chain and cannot yield any information for the other spins. The 10-spin simulation of the fat-like molecule makes several assumptions and simplifications, and we lack precise knowledge of the coupling constants, which were estimated from known hydrocarbon chains and using incremental method software. Moreover, the effects of J-coupling may be altered to various degrees by stimulated echoes, which we account for in the simulations, or by diffusion, chemical exchange effects, or coherence transfer cross-relaxation phenomena, which are not accounted for in the simulations (26,30). In addition, the simulations ignore all relaxation effects, including the known differential relaxation rates between protons in the hydrocarbon chain. Experimentally, vegetable oil is not a perfect model for fat. Over 90% of human fat is composed of seven fatty acids (which have different carbon chain lengths and numbers of double bonds); the predominant fatty acids are oleic (45–50%), palmitic (19–24%), and linoleic (13–15%), with the remaining mystiric, palmitoleic, stearic, and linolenic fatty acids accounting for another 13–18% (6). While vegetable oil can also contain these fatty acids, the composition of oil is different. Strictly speaking, the pulse repetition rate may not fall in the strong coupling (fast pulse) limit, especially for the longer echo times. However, an intermediate regime may exist between the strong and weakly coupled limits (26), and in fact, the UDD sequence results may be more difficult to interpret because of the changing interpulse delays (which are shorter at the beginning and end and longer in the middle of the sequence, as opposed to CPMG that has equidistant spacing between pulses). Finally, the effect of the strong coupling Hamiltonian depends on the offsets and chemical shifts (31,62), further complicating the comparisons between the simulation and experimental results.
Conclusion
We have demonstrated through density matrix simulations and experiments using an oil phantom and fatty tissue samples that J-couplings play a significant role in refocusing fat under multi-pulse echo sequences. Moreover, comparisons of oil and fat images reveal that microstructure, which includes the effects of diffusion and exchange, likely plays a negligible role in the refocusing, while the chemical structure and J-couplings are the predominant mechanism for refocusing. Density matrix simulations can be used to optimize the signal refocusing for a particular echo time or resonance. The experimental results on vegetable oil provided good agreement with the simulations of 1-pentene, where the signal intensity depends on the sequence and number of pulses, as well as total echo time. These results show that the conventional equally-spaced CPMG sequence is not the global optimal timing, although the optimal timing to refocus J-couplings may not be the UDD sequence either. The simulation, spectroscopy, and imaging results should prove useful for tailoring specialized pulse sequences with optimized interpulse delays aimed at improving the refocusing of the fat signal. This increased fat signal will ultimately prove useful for iMQC applications that rely on the growth of signals with a fat component.
Acknowledgements
This work was supported by NIH under Grant No. EB 02122. The author (AMS) would like to thank Dr. R.T. Branca for helpful discussions. The authors also acknowledge Dr. S. Hollenbeck for providing the excised tissue samples.
References
- 1.He QH, Shkarin P, Hooley RJ, Lannin DR, Weinreb JC, Bossuyt VIJ. In vivo MR spectroscopic imaging of polyunsaturated fatty acids (PUFA) in healthy and cancerous breast tissues by selective multiple-quantum coherence transfer (Sel-MQC): A preliminary study. Magnetic Resonance in Medicine. 2007;58(6):1079–1085. doi: 10.1002/mrm.21335. [DOI] [PubMed] [Google Scholar]
- 2.Galiana G, Branca RT, Jenista ER, Warren WS. Accurate temperature imaging based on intermolecular coherences in magnetic resonance. Science. 2008;322(5900):421–424. doi: 10.1126/science.1163242. [DOI] [PMC free article] [PubMed] [Google Scholar]
- 3.Jenista E, Galiana G, Branca RT, Yarmolenko PS, Stokes AM, Dewhirst MW, Warren WS. Application of mixed spin iMQCs for temperature and chemical-selective imaging. Journal of Magnetic Resonance. 2010;204(2):208–218. doi: 10.1016/j.jmr.2010.02.021. [DOI] [PMC free article] [PubMed] [Google Scholar]
- 4.Branca RT, Warren WS. In vivo brown adipose tissue detection and characterization using water-lipid intermolecular zero-quantum coherences. Magnetic Resonance in Medicine. 2010;65(2):313–319. doi: 10.1002/mrm.22622. [DOI] [PMC free article] [PubMed] [Google Scholar]
- 5.Branca RT, Warren WS. In vivo NMR detection of diet-induced changes in adipose tissue composition. Journal of Lipid Research. 2011;52:833–839. doi: 10.1194/jlr.D012468. [DOI] [PMC free article] [PubMed] [Google Scholar]
- 6.Ren JM, Dimitrov I, Sherry AD, Malloy CR. Composition of adipose tissue and marrow fat in humans by H-1 NMR at 7 Tesla. Journal of Lipid Research. 2008;49(9):2055–2062. doi: 10.1194/jlr.D800010-JLR200. [DOI] [PMC free article] [PubMed] [Google Scholar]
- 7.Knothe G, Kenar JA. Determination of the fatty acid profile by H-1-NMR spectroscopy. European Journal of Lipid Science and Technology. 2004;106(2):88–96. [Google Scholar]
- 8.Miyake Y, Yokomizo K, Matsuzaki N. Determination of unsaturated fatty acid composition by high-resolution nuclear magnetic resonance spectroscopy. Journal of the American Oil Chemists Society. 1998;75(9):1091–1094. [Google Scholar]
- 9.Yeung DKW, Lam SL, Griffith JF, Chan ABW, Chen Z, Tsang PH, Leung PC. Analysis of bone marrow fatty acid composition using high-resolution proton NMR spectroscopy. Chemistry and Physics of Lipids. 2008;151(2):103–109. doi: 10.1016/j.chemphyslip.2007.10.006. [DOI] [PubMed] [Google Scholar]
- 10.Carr HY, Purcell EM. Effects of Diffusion on Free Precession in Nuclear Magnetic Resonance Experiments. Physical Review. 1954;94(3):630–638. [Google Scholar]
- 11.Meiboom S, Gill D. Modified Spin-Echo Method for Measuring Nuclear Relaxation Times. Review of Scientific Instruments. 1958;29(8):688–691. [Google Scholar]
- 12.Michaeli S, Grohn H, Grohn O, Sorce DJ, Kauppinen R, Springer CS, Ugurbil K, Garwood M. Exchange-influenced T-2p contrast in human brain images measured with adiabatic radio frequency pulses. Magnetic Resonance in Medicine. 2005;53(4):823–829. doi: 10.1002/mrm.20428. [DOI] [PubMed] [Google Scholar]
- 13.Jenista ER, Stokes AM, Branca RT, Warren WS. Optimized, unequal pulse spacing in multiple echo sequences improves refocusing in magnetic resonance. Journal of Chemical Physics. 2009;131(20) doi: 10.1063/1.3263196. [DOI] [PMC free article] [PubMed] [Google Scholar]
- 14.Uhrig GS. Keeping a Quantum Bit Alive by Optimized Pi-Pulse Sequences. Physical Review Letters. 2007;98(10):100504. doi: 10.1103/PhysRevLett.98.100504. [DOI] [PubMed] [Google Scholar]
- 15.Biercuk MJ, Uys H, VanDevender AP, Shiga N, Itano WM, Bollinger JJ. Optimized dynamical decoupling in a model quantum memory. Nature Letters. 2009;458(7241):996–1000. doi: 10.1038/nature07951. [DOI] [PubMed] [Google Scholar]
- 16.Cywinski L, Lutchyn RM, Nave CP, Das Sarma S. How to enhance dephasing time in superconducting qubits. Physical Review B. 2008;77(17) [Google Scholar]
- 17.Yang W, Liu RB. Universality of Uhrig Dynamical Decoupling for Suppressing Qubit Pure Dephasing and Relaxation. Physical Review Letters. 2008;101(18):180403. doi: 10.1103/PhysRevLett.101.180403. [DOI] [PubMed] [Google Scholar]
- 18.Lee B, Witzel WM, Das Sarma S. Universal pulse sequence to minimize spin dephasing in the central spin decoherence problem. Physical Review Letters. 2008;100(16) doi: 10.1103/PhysRevLett.100.160505. [DOI] [PubMed] [Google Scholar]
- 19.Kokatnur MG, Oalmann MC, Johnson WD, Malcom GT, Strong JP. Fatty-Acid Composition of Human Adipose-Tissue from 2 Anatomical Sites in a Biracial Community. American Journal of Clinical Nutrition. 1979;32(11):2198–2205. doi: 10.1093/ajcn/32.11.2198. [DOI] [PubMed] [Google Scholar]
- 20.Field CJ, Angel A, Clandinin MT. Relationship of Diet to the Fatty-Acid Composition of Human Adipose-Tissue Structural and Stored Lipids. American Journal of Clinical Nutrition. 1985;42(6):1206–1220. doi: 10.1093/ajcn/42.6.1206. [DOI] [PubMed] [Google Scholar]
- 21.Insull W, Bartsch GE. Fatty Acid Composition of Human Adipose Tissue Related to Age Sex and Race. American Journal of Clinical Nutrition. 1967;20(1):13. doi: 10.1093/ajcn/20.1.13. [DOI] [PubMed] [Google Scholar]
- 22.Malcom GT, Bhattacharyya AK, Velezduran M, Guzman MA, Oalmann MC, Strong JP. Fatty-Acid Composition of Adipose-Tissue in Humans - Differences between Subcutaneous Sites. American Journal of Clinical Nutrition. 1989;50(2):288–291. doi: 10.1093/ajcn/50.2.288. [DOI] [PubMed] [Google Scholar]
- 23.Pouchert CJ, Aldrich Chemical C, Behnke J. The Aldrich library of13C and 1H FT NMR spectra. Milwaukee, Wisc.: Aldrich Chemical Co.; 1993. [Google Scholar]
- 24.Bothner-By AA, Naar-Colin C. The Proton Magnetic Resonance Spectra of Olefins. I Propene, Butene-1 and Hexene-1. Journal of the American Chemical Society. 1961;83:231–236. [Google Scholar]
- 25.Allerhand A. Analysis of Carr-Purcell Spin-Echo Nmr Experiments on Multiple-Spin Systems .I. Effect of Homonuclear Coupling. Journal of Chemical Physics. 1966;44(1):1. [Google Scholar]
- 26.Stables LA, Kennan RP, Anderson AW, Constable RT, Gore JC. Analysis of J coupling-induced fat suppression in DIET imaging. Journal of Magnetic Resonance. 1999;136(2):143–151. doi: 10.1006/jmre.1998.1628. [DOI] [PubMed] [Google Scholar]
- 27.Constable RT, Smith RC, Gore JC. Coupled-Spin Fast Spin-Echo Mr-Imaging. Jmri-Journal of Magnetic Resonance Imaging. 1993;3(3):547–552. doi: 10.1002/jmri.1880030319. [DOI] [PubMed] [Google Scholar]
- 28.Gambarota G, van der Graaf M, Klomp D, Mulkern RV, Heerschap A. Echo-time independent signal modulations using PRESS sequences: A new approach to spectral editing of strongly coupled AB spin systems. Journal of Magnetic Resonance. 2005;177(2):299–306. doi: 10.1016/j.jmr.2005.08.006. [DOI] [PubMed] [Google Scholar]
- 29.Henkelman RM, Hardy PA, Bishop JE, Poon CS, Plewes DB. Why Fat Is Bright in Rare and Fast Spin-Echo Imaging. Jmri-Journal of Magnetic Resonance Imaging. 1992;2(5):533–540. doi: 10.1002/jmri.1880020511. [DOI] [PubMed] [Google Scholar]
- 30.Stables LA, Kennan RP, Anderson AW, Gore JC. Density matrix simulations of the effects of J coupling in spin echo and fast spin echo imaging. Journal of Magnetic Resonance. 1999;140(2):305–314. doi: 10.1006/jmre.1998.1655. [DOI] [PubMed] [Google Scholar]
- 31.Williamson DS, Mulkern RV, Jakab PD, Jolesz FA. Coherence transfer by isotropic mixing in Carr-Purcell-Meiboom-Gill imaging: Implications for the bright fat phenomenon in fast spin-echo imaging. Magnetic Resonance in Medicine. 1996;35(4):506–513. doi: 10.1002/mrm.1910350409. [DOI] [PubMed] [Google Scholar]
- 32.Constable RT, Anderson AW, Zhong J, Gore JC. Factors Influencing Contrast in Fast Spin-Echo Mr Imaging. Magnetic Resonance Imaging. 1992;10(4):497–511. doi: 10.1016/0730-725x(92)90001-g. [DOI] [PubMed] [Google Scholar]
- 33.Melki PS, Jolesz FA, Mulkern RV. Partial Rf Echo-Planar Imaging with the Faise Method .2. Contrast Equivalence with Spin-Echo Sequences. Magnetic Resonance in Medicine. 1992;26(2):342–354. doi: 10.1002/mrm.1910260213. [DOI] [PubMed] [Google Scholar]
- 34.Melki PS, Mulkern RV. Magnetization Transfer Effects in Multislice Rare Sequences. Magnetic Resonance in Medicine. 1992;24(1):189–195. doi: 10.1002/mrm.1910240122. [DOI] [PubMed] [Google Scholar]
- 35.Wright GA, Macovski A. Lipid Signal Enhancement in Spin-Echo Trains. Proceedings of the International Society for Magnetic Resonance in Medicine; 11th Annual Meeting; 1992. p. 437. [Google Scholar]
- 36.Slichter CP. Principles of Magnetic Resonance. New York: Springer-Verlag; 1990. [Google Scholar]
- 37.Braunschweiler L, Ernst RR. Coherence Transfer by Isotropic Mixing - Application to Proton Correlation Spectroscopy. Journal of Magnetic Resonance. 1983;53(3):521–528. [Google Scholar]
- 38.Davis DG, Bax A. Assignment of Complex H-1-Nmr Spectra Via Two-Dimensional Homonuclear Hartmann-Hahn Spectroscopy. Journal of the American Chemical Society. 1985;107(9):2820–2821. [Google Scholar]
- 39.Hennig J, Nauerth A, Friedburg H. Rare Imaging - a Fast Imaging Method for Clinical Mr. Magnetic Resonance in Medicine. 1986;3(6):823–833. doi: 10.1002/mrm.1910030602. [DOI] [PubMed] [Google Scholar]
- 40.Zur Y, Stokar S. A Phase-Cycling Technique for Canceling Spurious Echoes in Nmr Imaging. Journal of Magnetic Resonance. 1987;71(2):212–228. [Google Scholar]
- 41.Zur Y, Zou X, Neuringer LJ. Multiecho, Spin-Echo Sequence to Eliminate Unwanted Echoes. Magnetic Resonance in Medicine. 1991;19(2):464–469. doi: 10.1002/mrm.1910190239. [DOI] [PubMed] [Google Scholar]
- 42.Crawley AP, Henkelman RM. A Stimulated Echo Artifact from Slice Interference in Magnetic-Resonance-Imaging. Medical Physics. 1987;14(5):842–848. doi: 10.1118/1.596011. [DOI] [PubMed] [Google Scholar]
- 43.Melki PS, Mulkern RV, Panych LP, Jolesz FA. Comparing the Faise Method with Conventional Dual-Echo Sequences. Jmri-Journal of Magnetic Resonance Imaging. 1991;1(3):319–326. doi: 10.1002/jmri.1880010310. [DOI] [PubMed] [Google Scholar]
- 44.Constable RT, Smith RC, Gore JC. Signal-to-Noise and Contrast in Fast Spin-Echo (Fse) and Inversion Recovery Fse Imaging. Journal of Computer Assisted Tomography. 1992;16(1):41–47. doi: 10.1097/00004728-199201000-00008. [DOI] [PubMed] [Google Scholar]
- 45.Crawley AP, Henkelman RM. Errors in T2 Estimation Using Multislice Multiple-Echo Imaging. Magnetic Resonance in Medicine. 1987;4(1):34–47. doi: 10.1002/mrm.1910040105. [DOI] [PubMed] [Google Scholar]
- 46.Majumdar S, Orphanoudakis SC, Gmitro A, Odonnell M, Gore JC. Errors in the Measurements of T2 Using Multiple-Echo Mri Techniques .1. Effects of Radiofrequency Pulse Imperfections. Magnetic Resonance in Medicine. 1986;3(3):397–417. doi: 10.1002/mrm.1910030305. [DOI] [PubMed] [Google Scholar]
- 47.Poon CS, Henkelman RM. Practical T2 Quantitation for Clinical-Applications. Jmri-Journal of Magnetic Resonance Imaging. 1992;2(5):541–553. doi: 10.1002/jmri.1880020512. [DOI] [PubMed] [Google Scholar]
- 48.Butts K, Pauly JM, Glover GH, Pelc NJ. Dual echo "DIET" fast spin echo imaging. Proceedings of the International Society for Magnetic Resonance in Medicine; 3rd Scientific Meeting; 1995. p. 651. [Google Scholar]
- 49.Kanazawa H, Takai H, Machida Y, Hanawa M. Contrast naturalization of fast spin echo imaging: A fat reduction technique free from field inhomogeneity. Proceedings of the International Society for Magnetic Resonance in Medicine; 2nd Scientific Meeting; 1994. p. 474. [Google Scholar]
- 50.Kanazawa H, Miyazaki M, Takai H, Kassai Y, Hanawa M. A new fat-suppressed fast spin echo technique using DIET-PASTA. Proceedings of the International Society for Magnetic Resonance in Medicine; 4th Scientific Meeting; 1996. p. 1547. [Google Scholar]
- 51.Block W, Pauly J, Kerr A, Nishimura D. Consistent fat suppression with compensated spectral-spatial pulses. Magnetic Resonance in Medicine. 1997;38(2):198–206. doi: 10.1002/mrm.1910380207. [DOI] [PubMed] [Google Scholar]
- 52.Oostendorp M, Engelke UFH, Willemsen MAAP, Wevers RA. Diagnosing inborn errors of lipid metabolism with proton nuclear magnetic resonance spectroscopy. Clinical Chemistry. 2006;52(7):1395–1405. doi: 10.1373/clinchem.2006.069112. [DOI] [PubMed] [Google Scholar]
- 53.Strobel K, van den Hoff J, Pietzsch J. Localized proton magnetic resonance spectroscopy of lipids in adipose tissue at high spatial resolution in mice in vivo. Journal of Lipid Research. 2008;49(2):473–480. doi: 10.1194/jlr.D700024-JLR200. [DOI] [PubMed] [Google Scholar]
- 54.Garwood M, DelaBarre L. The return of the frequency sweep: Designing adiabatic pulses for contemporary NMR. Journal of Magnetic Resonance. 2001;153(2):155–177. doi: 10.1006/jmre.2001.2340. [DOI] [PubMed] [Google Scholar]
- 55.Conolly S, Glover G, Nishimura D, Macovski A. A Reduced Power Selective Adiabatic Spin-Echo Pulse Sequence. Magnetic Resonance in Medicine. 1991;18(1):28–38. doi: 10.1002/mrm.1910180105. [DOI] [PubMed] [Google Scholar]
- 56.Hwang TL, Shaka AJ. Water Suppression That Works - Excitation Sculpting Using Arbitrary Wave-Forms and Pulsed-Field Gradients. Journal of Magnetic Resonance Series A. 1995;112(2):275–279. [Google Scholar]
- 57.He QH, Richter W, Vathyam S, Warren WS. Intermolecular Multiple-Quantum Coherences and Cross Correlations in Solution Nuclear-Magnetic-Resonance. Journal of Chemical Physics. 1993;98(9):6779–6800. [Google Scholar]
- 58.Warren WS, Richter W, Andreotti AH, Farmer BT. Generation of Impossible Cross-Peaks between Bulk Water and Biomolecules in Solution Nmr. Science. 1993;262(5142):2005–2009. doi: 10.1126/science.8266096. [DOI] [PubMed] [Google Scholar]
- 59.Branca RT, Capuani S, Maraviglia B. About the crazed sequence. Concepts in Magnetic Resonance Part A. 2004;21A(1):22–36. [Google Scholar]
- 60.Richter W, Warren WS. Intermolecular multiple quantum coherences in liquids. Concepts in Magnetic Resonance. 2000;12(6):396–409. [Google Scholar]
- 61.Zhong JH, Chen Z, Kwok E. In vivo intermolecular double-quantum imaging on a clinical 1.5 T MR scanner. Magnetic Resonance in Medicine. 2000;43(3):335–341. doi: 10.1002/(sici)1522-2594(200003)43:3<335::aid-mrm3>3.0.co;2-1. [DOI] [PubMed] [Google Scholar]
- 62.Rance M. Improved Techniques for Homonuclear Rotating-Frame and Isotropic Mixing Experiments. Journal of Magnetic Resonance. 1987;74(3):557–564. [Google Scholar]


